http://dx.doi.org/10.4236/cs.2016.76069
Improving Voltage Stability of Power
System by Optimal Location of FACTS
Devices Using Bio-Inspired Algorithms
Archana Naganathan, Vidhyapriya Ranganathan
Department of Information Technology, PSG College of Technology, Coimbatore, India
Received 23 March 2016; accepted 8 May 2016; published 13 May 2016
Copyright © 2016 by authors and Scientific Research Publishing Inc.
This work is licensed under the Creative Commons Attribution International License (CC BY).
http://creativecommons.org/licenses/by/4.0/
Abstract
Power system operations can be optimized using power electronics based FACTS devices. The lo-cation of these devices at appropriate transmission line plays a major role in their performance. In this paper, two bio-inspired algorithms are used to optimally locate two FACTS devices: UPFC and STATCOM, so as to reduce the voltage collapse and real power losses. Particle swarm optimization and BAT algorithms are chosen as their behaviour is similar. VCPI index is used as a metric to cal-culate the voltage collapse scenario of the power system. The algorithm is tested on two bench-mark power systems: IEEE 118 and the Indian UPSEB 75 bus system. Performance metrics are compared with the system without FACTS devices. Application of PSO and BAT algorithms to op-timally locate the FACTS devices reduces the VCPI index and real power losses in the system.
Keywords
BAT, FACTS, Optimal Location, PSO, STATCOM, UPFC, Voltage Stability
1. Introduction
network to enhance controllability and power transfer capability. Each of these FACTS devices provide different benefits to the power system and hence using more than one FACTS device can optimize different parameters, making the power system more reliable. Since real time power systems are huge complex networks with many transmission lines, it is important to find a suitable location for these devices. Placing a FACTS device randomly in a location will not satisfy the objective, and sometimes will produce negative effect on the network.
Many algorithms are used to locate these FACTS devices optimally in the system with different objectives. Genetic algorithm (GA) is widely used to locate FACTS devices. In [1], GA is applied to find optimal location of four FACTS devices namely UPFC, TCSC, TCPST and SVC, with cost as the objective function. Firefly al-gorithm is used in [2] to locate SVC with power loss and voltage deviation control. Particle Swarm Optimization (PSO) based method [3]-[6] is applied to this problem with different types of objectives in the literature. In [7]-[9], artificial bee colony algorithm is used to locate FACTS devices. To minimize average loadability to re-lieve overloads, a linear programming [10] and a non-linear programming [11] based optimal location of UPFCs are presented in the literature. A fuzzy [12] approach based optimal location of UPFC under network contingen-cies is simulated to improve system stability and security. In this paper two types of FACTS devices: UPFC and STATCOM are used as UPFC is one of the best FACTS device, operating under system insecurity [13] [14]. STATCOM is also capable of operating under various stressed conditions of the power system [15] [16]. PSO and BAT algorithms are used to find the optimal location of these devices with multi-objective optimization. Voltage stability and real power loss are considered as optimizing parameters, with voltage deviation penalty. The proposed algorithm is tested on the standard IEEE 118 bus system and the UPSEB 75 bus system with dif-ferent loading conditions.
2. Problem Formulation
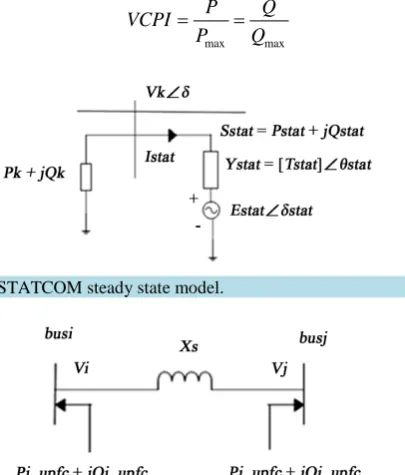
Power injection model is used for both STATCOM and UPFC. STATCOM is modeled as a controllable voltage source (Estat ∠θstat) in series with an impedance (Ystat) (Figure 1).
Power injection model (Figure 2) is used in this paper, in which UPFC is represented as two voltage sources in steady state between buses i and j.
Voltage stability is a major concern in power system, especially during load variations. An accurate and relia-ble index was proposed by Moghavvemi and Faruque [17] to analyse the stability of the system. Voltage stabili-ty proximistabili-ty indicator is based on the maximum power that is transferred between two nodes in a power system network. It is expressed as in Equation (1) [17].
max max
P Q
VCPI
P Q
[image:2.595.215.418.458.696.2]= = (1)
[image:2.595.224.406.618.704.2]Figure 1. STATCOM steady state model.
where P, Q are the real and reactive power transferred and Pmax and Qmax are the maximum values of real and
reactive power that can be transferred over a line. The objective of this paper is to reduce the value of VCPI of the power system by using FACTS devices. FACTS devices like STATCOM and UPFC are generally installed in power systems to improve voltage stability. In a large power system network, these FACTS devices can be placed in many possible nodes, and at each location the performance of the system varies. Since real time power system networks are very huge with hundreds of transmission lines, it is not possible to fix these devices with a trial and error method. Also, fixing the FACTS devices at randomly chosen locations may worsen the system performance. Hence this paper proposes two bio-inspired algorithms: PSO and BAT to find an optimal location of these devices so as to improve the system performance. Based on the VCPI metrics, the fitness function for the optimal location is framed as in equation (2)
1 2
Fitness function= f ∗VCPI+ f ∗Real power loss+Vp (2)
where f1 and f2 are constants and Vp is the voltage penalty that is laid on the equation for crossing voltage limits.
Constraints including real and reactive power balance, FACTS installation are considered as given in Equations (3)-(6).
( )
( )
1 cos sin 0
N
gi di j j ij ij ij ij
P −P −
∑
=V G θ +B θ = (3)( )
( )
1 sin cos 0
N
gi di j i ij ij j ij
Q −Q −
∑
=V G θ −Bi θ = (4)1 cos
n
gi factsi di j i j ij ij i j
P +P =P +
∑
=V V Y α + +θ θ (5)1 cos
n
gi factsi di j i j ij ij i j
Q +Q =Q +
∑
=V V Y α + −θ θ (6)where Pgi, Qgi, Pdi and Qdiare the real and reactive power generated and real and reactive power demand, Pfactsi
and Qfactsi are the real and reactive powers injected/absorbed by FACTS, V is the voltage, G, B, Y are the
con-ductance, susceptance and admittance of the lines. Cost of FACTS devices is also calculated using the Equations (7)-(8) [11].
( )
cost of statcom $ =Statcom rating in MVar 50∗ (7)
( )
2cost of upfc $ =188.2−0.2691 upfc rating∗ +0.0003 upfc rating∗ (8)
3. PSO Based Optimal Location
Particle swarm optimization [18] is a bio-inspired technique, inspired from the intelligent behaviour of a flock of birds moving in search of their food. PSO is a simple algorithm that can solve complex problems, with various boundary conditions in a small time duration. In a PSO algorithm, the swarm interacts in a group which en-hances the solution to a problem. Two parameters of a particle: position and velocity, are used as information to travel in the search space. Each particle travels to various locations and saves the value of the best location and velocity obtained so far (Personal best). Similarly a swarm of particles in a society are aware of another value called global best, which is the best value among all personal bests. The position and velocity of each particle is updated for every move, using the equations (9) and (10).
[ ] [ ]
1{
1( )
(
[ ]
[ ]
)
}
{
2( )
(
[ ]
)
}
v i+ =v i + c ∗rand ∗ pbest i −location i + c ∗rand ∗ gbest−location i (9)
[
1]
[ ] [ ]
location i+ =location i +v i (10)
where v[] is the velocity of the particle, location[] is the position of the particle, pbest and gbest are the personal and global best values. rand() is a random number function that generates values between 0 and 1, c1, c2 are
learning constants, taken as 2.
The procedure to find an optimal location of FACTS devices using PSO is as follows:
Step 1: Initialize the FACTS devices (STATCOM and UPFC) with random position and size (in MVar). Load the system data: line data, bus data, load power is initially set as 100%. Initialize PSO parameters.
Step 3: If the VCPI value is better than the previous values, then the position is updated.
Step 4: The VCPI values from all locations are compared and the best value is set as the global best value. Step 5: The location and size are updated using the standard PSO position and velocity Equations (9) & (10). If the value obtained for position is a floating value, then it is rounded off to an integer, as location of FACTS can only be a real number.
Step 6: The process is repeated for a specified number of iterations.
Step 7: The same procedure is again performed for a loading factor of 110% and 120%.
4. BAT Based Optimal Location
BAT [19] is also a bio-inspired algorithm based on the echo location behaviour of microbats. They emit a loud voice and listens for the echo from the surroundings, thereby detecting prays and avoiding obstacles. Similar to the PSO algorithm, BAT algorithm also has two parameters: the position (location[]) and velocity (v[]) of bats. The equation used to determine these values are given in (11) and (12).
[ ] [ ]
(
[ ]
*)
[ ]
1v i+ =v i + location i −location f i (11)
[
1]
[ ] [
1]
location i+ =location i +v i+ (12)
where
[ ]
min(
min max)
f i = f + f −f β (13)
and location* is the global best location of all the bats in the search space. 'f' is the frequency assigned to each bat, and β is a random vector of (0,1), generated from a uniform distribution. To obtain a new solution for the bats, random walk is used as in equation (14).
[
]
[ ]
tlocation new =location old +A (14)
where is a random number between (−1, 1) and A is the average loudness of all the bats. This local search differentiates BAT from PSO algorithm. FACTS optimal location can be found using BAT algorithm with the following procedure:
Step1: Initialize the FACTS devices (STATCOM and UPFC) with random position and size (in MVar). Load the system data: line data, bus data, load power is initially set as 100%.
Step2: Initialize BAT parameters, frequency, and loudness (Ai), rand and pulse rate ri. Step3: For each location, calculate the fitness value VCPI.
Step4: Update the position and velocities using relevant equations and frequencies. Step5: if (rand > ri).
Select a solution among the best solutions.
Generate a local solution around the selected best solution. Step6: if (rand < ri).
Generate a new solution by flying randomly.
Step7: if (rand < Loudness & f(location[i]) < f(location∗)). Accept the new solutions Increase ri and reduce Ai. Step8: Rank the bats and find the current best location∗.
5. Results and Discussions
The proposed algorithms are tested on the IEEE 118 bus system and the Indian Uttar Pradesh State Electricity Board 75 bus system. The parameter settings of PSO are given inTable 1 and that of BAT inTable 2.
5.1. Case Study 1: IEEE 118 Bus System
Table 1. PSO parameters.
Parameter Value
Population size 20
C1 1.5
C2 2.5
Inertia 0.3
Damp ratio 0.95
[image:5.595.84.538.200.646.2]Iterations 30
Table 2. BAT parameters.
Parameter Value
Population size 20
A 0.5
r 0.5
Fmin 0
Fmax 2
Iterations 30
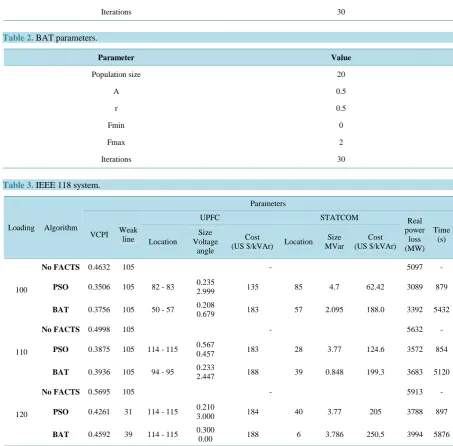
Table 3.IEEE 118 system.
Loading Algorithm
Parameters
VCPI Weak line
UPFC STATCOM Real
power loss (MW)
Time (s) Location
Size Voltage
angle
Cost
(US $/kVAr) Location Size MVar
Cost (US $/kVAr)
100
No FACTS 0.4632 105 - 5097 -
PSO 0.3506 105 82 - 83 0.235
2.999 135 85 4.7 62.42 3089 879
BAT 0.3756 105 50 - 57 0.208
0.679 183 57 2.095 188.0 3392 5432
110
No FACTS 0.4998 105 - 5632 -
PSO 0.3875 105 114 - 115 0.567 0.457 183 28 3.77 124.6 3572 854
BAT 0.3936 105 94 - 95 0.233 2.447 188 39 0.848 199.3 3683 5120
120
No FACTS 0.5695 105 - 5913 -
PSO 0.4261 31 114 - 115 0.210
3.000 184 40 3.77 205 3788 897
BAT 0.4592 39 114 - 115 0.300
0.00 188 6 3.786 250.5 3994 5876
of FACTS using PSO, there is a reduction of VCPI by 24.3% and with BAT algorithm by 18.9%. Similarly the real power loss of the system is 5097 MW, which is 39.4% and 33.4% more when compared to the system with optimally located FACTS device using PSO and BAT respectively.
5.2. Case Study 2: UPSEB 75 Bus System
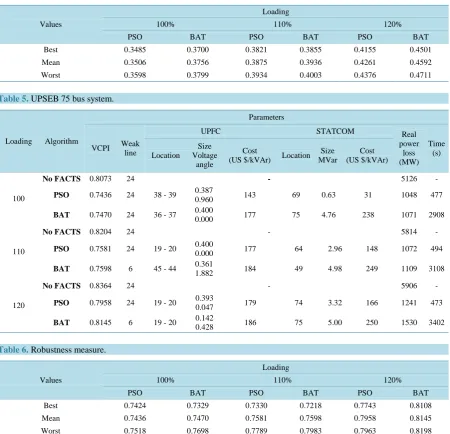
The UPSEB 75 bus system is an Indian Utility system of the state of Uttar Pradesh in India. It includes 15 gene-rators and 98 transmission lines [20]. The results with all types of loading conditions are given in Table 5. The VCPI value without installation of FACTS device is 0.8364. By optimally locating FACTS devices using PSO and BAT techniques, the VCPI value is reduced to 11.1% and 7.5% respectively. The real power losses are also reduced by 79.5% using FACTS devices with PSO and 79% using BAT when compared to the system before installation of FACTS (5126 MW). PSO algorithm also obtains the results faster when compared to BAT algo-rithm.
PSO and BAT algorithms are tested 100 times for each loading conditions and their best, worst and average values are tabulated inTable 6.
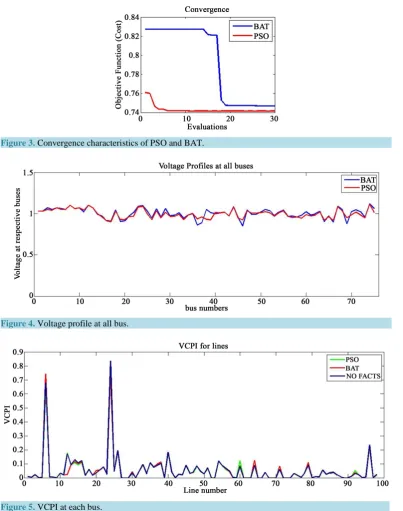
The convergence characteristics of PSO and BAT are given in Figure 3. PSO is seen to converge faster than BAT algorithm. A comparison of voltage profile and VCPI values of each bus obtained using the algorithms is given in Figure 4and Figure 5. It is observed that PSO performs better than BAT in maintaining the voltage values at 1 p.u. and in decreasing the VCPI values, thereby improving the stability of the system.
Table 4. Output of multiple runs.
Values
Loading
100% 110% 120%
PSO BAT PSO BAT PSO BAT
Best 0.3485 0.3700 0.3821 0.3855 0.4155 0.4501
Mean 0.3506 0.3756 0.3875 0.3936 0.4261 0.4592
[image:6.595.89.540.282.716.2]Worst 0.3598 0.3799 0.3934 0.4003 0.4376 0.4711
Table 5. UPSEB 75 bus system.
Loading Algorithm
Parameters
VCPI Weak line
UPFC STATCOM Real
power loss (MW) Time (s) Location Size Voltage angle Cost
(US $/kVAr) Location Size MVar
Cost (US $/kVAr)
100
No FACTS 0.8073 24 - 5126 -
PSO 0.7436 24 38 - 39 0.387
0.960 143 69 0.63 31 1048 477
BAT 0.7470 24 36 - 37 0.400
0.000 177 75 4.76 238 1071 2908
110
No FACTS 0.8204 24 - 5814 -
PSO 0.7581 24 19 - 20 0.400
0.000 177 64 2.96 148 1072 494
BAT 0.7598 6 45 - 44 0.361 1.882 184 49 4.98 249 1109 3108
120
No FACTS 0.8364 24 - 5906 -
PSO 0.7958 24 19 - 20 0.393
0.047 179 74 3.32 166 1241 473
BAT 0.8145 6 19 - 20 0.142
0.428 186 75 5.00 250 1530 3402
Table 6. Robustness measure.
Values
Loading
100% 110% 120%
PSO BAT PSO BAT PSO BAT
Best 0.7424 0.7329 0.7330 0.7218 0.7743 0.8108
Mean 0.7436 0.7470 0.7581 0.7598 0.7958 0.8145
Figure 3.Convergence characteristics of PSO and BAT.
Figure 4. Voltage profile at all bus.
Figure 5. VCPI at each bus.
6. Conclusion
References
[1] Cai, L.J., Erlich, I. and Stamtsis, G. (2004) Optimal Choice and Allocation of FACTS Devices in Deregulated Electric-ity Market Using Genetic Algorithms. Proceedings of the Power Systems Conference and Exposition, Vol. 1, 201-207.
http://dx.doi.org/10.1109/psce.2004.1397562
[2] Rao, B.V. and Kumar, G.V.N. (2014) Sensitivity Analysis based Optimal Location and Tuning of Static VAR Com-pensator using Firefly Algorithm. Indian Journal of Science and Technology, 7,201-1210.
[3] Balamurali, G. and Thanushkodi, K. (2011) Novel Selection Factors Based Optimal Placement of TCSC Controller in Power Transmission System for Contingencies Using PSO. Proceedings of the International Conference on Sustaina-ble Energy and Intelligent Systems, Chennai, 20-22 July 2011, 352-357. http://dx.doi.org/10.1049/cp.2011.0388
[4] Tibin, J., Sini, X., Chitra, S. and Cherian, V.I. (2011) PSO Based Optimal Placement and Setting of FACTS Devices for Improving the Performance of Power Distribution System. Bonfring International Journal of Power Systems and Intergrated Circuits, 1, 60-64.
[5] Shaheen, H.I., Rashed, G.I. and Cheng, S.J. (2008) Optimal Location and Parameters Setting of UPFC based on GA and PSO for Enhancing Power System Security under Single Contingencies. Power and Energy Society General Meeting—Conversion and Delivery of Electrical Energy in the 21st Century, Pittsburgh, 20-24 July 2008, 1-8.
[6] Saravanan, M., Slochanal, S.M.R., Venkatesh, P. and Abraham, J.P.S. (2007) Application of Particle Swarm Optimiza-tion Technique for Optimal LocaOptimiza-tion of FACTS Devices Considering Cost of InstallaOptimiza-tion and System Loadability. Electric Power Systems Research, 77, 276-283. http://dx.doi.org/10.1016/j.epsr.2006.03.006
[7] Khorsandi, A., Hosseinian, S.H. and Ghazanfari, A. (2013) Modified Artificial Bee Colony Algorithm Based on Fuzzy Multi-Objective Technique for Optimal Power Flow Problem. Electric Power Systems Research, 95, 206-213.
http://dx.doi.org/10.1016/j.epsr.2012.09.002
[8] Balarama Krishna Rao, Y.V., Srinivasa Rao, R. and Reddy, V.V.K. (2014) ABC Algorithm Based Comparative Anal-ysis of Optimal SVC and TCSC Placement to Maximize Loadability. International Journal of Electrical and Electron-ics Engineering Research (IJEEER), 4, 53-64.
http://www.tjprc.org/view-archives.php?year=2014_41_2&id=15&jtype=2&page=8
[9] Thangalakshmi,S. and Valsalal, P. (2014) Congestion Management by Optimal Allocation of Facts Controllers Using Hybrid Fish Bee Optimization. Journal of Computer Science, 10, 1766-1775.
[10] Shao, W. and Vittal, V. (2006) LP-Based OPF for Corrective FACTS Control to Relieve Overloads and Voltage Viola-tions. IEEE Transactions on Power Systems, 21, 1832-1839. http://dx.doi.org/10.1109/TPWRS.2006.881127
[11] Lashkar Ara, A., Kazemi, A. and Nabavi Niaki, S.A. (2012) Multiobjective Optimal Location of FACTS Shunt-Series Controllers for Power System Operation Planning. IEEE Transactions on Power Delivery, 27, 481-490.
http://dx.doi.org/10.1109/TPWRD.2011.2176559
[12] Visakha, K., Thukaram, D. and Jenkins, L. (2004) Application of UPFC for System Security Improvement under Nor-mal and Network Contingencies. Electric Power Systems Research, 70, 46-55.
http://dx.doi.org/10.1016/j.epsr.2003.11.011
[13] Gyugyi, L. (1992) Unified Power-Flow Control Concept for Flexible AC Transmission Systems. IEE Proceedings C, Generation, Transmission and Distribution, 139, 323-331. http://dx.doi.org/10.1049/ip-c.1992.0048
[14] Huang, Z.Y., Ni, Y.X., Shen, C.M., Wu, F.F., Chen, S.S. and Zhang, B.L. (2000) Application of Unified Power Flow Controller in Interconnected Power Systems-Modeling, Interface, Control Strategy, and Case Study. IEEE Transac-tions on Power Systems, 15, 817-824. http://dx.doi.org/10.1109/59.867179
[15] Teleke, S., Yazdani, A., Gudimetla, B., Enslin, J. and Castaneda, J. (2011) Application of STATCOM for Power Qual-ity Improvement. Power Systems Conference and Exposition (PSCE), Phoenix, 20-23 March 2011, 1-6.
http://dx.doi.org/10.1109/psce.2011.5772500
[16] Singh, B., Murthy, S.S. and Gupta, S. (2004) Analysis and Design of STATCOM-based Voltage Regulator for Self- Excited Induction Generators. IEEE Transactions on Energy Conversion, 19,783-790.
http://dx.doi.org/10.1109/TEC.2004.827710
[17] Moghavvemi, M. and Faruque, M.O. (1999) Estimation of Voltage Collapse from Local Measurement of Line Power Flow and Bus Voltages. Proceedings of the International Conference on Electric Power Engineering, Budapest, 29 August-2 September 1999, 77. http://dx.doi.org/10.1109/ptc.1999.826508
[18] Kennedy, J. and Eberhart, R. (1995) Particle Swarm Optimization. Proceedings of the IEEE International Conference on Neural Networks, Vol. 4, 1942-1948. http://dx.doi.org/10.1109/ICNN.1995.488968
http://dx.doi.org/10.1007/978-3-642-12538-6_6