Munich Personal RePEc Archive
Estimation of economic discounting rate
for practical project appraisal: the case
of Turkey
Halicioglu, Ferda and Karatas, Cevat
Department of Economics, Yeditepe University, Turkey
2010
Online at
https://mpra.ub.uni-muenchen.de/29577/
ESTIMATION OF ECONOMIC DISCOUNTING RATE FOR PRACTICAL PROJECT APPRAISAL: THE CASE OF TURKEY
Ferda Halicioglu*
Department of Economics, Yeditepe University, Turkey
Cevat Karatas
Department of Economics, Yeditepe University, Turkey
Abstract
This study focuses on estimating an economic discounting rate (EDR) to be used in project appraisals by the State Planning Organisation (SPO) of Turkey. The EDR is a policy tool used for selecting the best projects to meet the economic targets of development plans and to enable planners to choose the most profitable and feasible projects. Since the resources available to the economy are scarce, planners are expected to use cost-benefit analysis (CBA) especially, Net Present Value (NPV) criteria. The NPV is considered to be more reliable than the internal rate of return. Therefore, selection of an appropriate social discount rate is a key issue in the application of CBA for project appraisal. In this article, an attempt is made to estimate the EDR of Turkey via a “growth models” approach, providing fresh evidence for enhancing the project appraisal system in Turkey. The results reveal that the EDR of Turkey is 12.94% in the estimation period of 1985-2009.
JEL Classifications: O22; C22.
Keywords: Project Appraisal; Growth Model; ARDL; Turkey.
Corresponding Author’s E-mail address:
INTRODUCTION
Selecting an appropriate discount rate is the most controversial issue in the application of CBA for project appraisals. It is a key parameter affecting the viability and profitability of investment projects. The planners, who are required to use CBA, and in particular NPV calculations, are confronted with the choice of a reliable social discount rate. Clearly, feasibility and profitability of public projects turn out to be very sensitive to the selected discount rate. The question of discount rate has been debated extensively in by economists such as Pigou (1950), Sen (1961), Eckstein (1961), Feldstein (1964), Baumol (1968), Little and Mirrlees (1968, 1974), Squire and van der Tak (1975), Scott (1976), Irwin (1978), Gittinger (1982), Phillips (1986), Price (1988), Markandya and Pearce (1991), Karatas (1989, 2001), and Shukla (1997).
In the CBA analysis, there are two main approaches to estimating a suitable discount rate: social opportunity cost of capital (SOC) and social time preference (STP). The SOC approach, also known as economic discount rate (EDR), measures the next-best alternative investment’s value to society.
The EDR is estimated using either micro- or macro-economic data using one of various empirical approaches. The most common approaches for estimating the EDR are static and dynamic Cobb-Douglas production functions, incremental capital output ratios (ICOR), growth models, analysis of market rates of interest, national plan objectives and cost of borrowing from external and internal sources. The STP measures society’s trade-off for present consumption in order to improve future consumption. The critical component of this approach is the elasticity of the marginal utility of consumption. Kula (2004) provides a range of possible measures and their suitability for estimating this parameter. Evans (2005) summarizes previous evidence for this approach with further empirical estimations for 20 OECD countries. Recent application of this approach is also included in Evans and Sezer (2005) and Percoco (2008).
This study’s primary objective is to produce a reliable EDR for Turkey on the basis of a simplified version of the “growth model” approach, which is deemed free of some of the shortcomings of other methods, as discussed in Shukla (1997).
public projects, this paper will focus on the estimation of an EDR for Turkey.
A BRIEF LITERATURE SURVEY
The debate on the choice of discount rate for public projects has centered on two types of discount rates: the social time preference rate (STR) and the social opportunity cost of capital (SOC). Pigou (1950) argued that individuals are “short-sighted” about the future and that government intervention is needed to give adequate weight to the welfare of future generations. Pigou (1950), Sen (1961), and Dobb (1969) are in favor of imposing responsibility on the public for the welfare of future generations, while Eckstein (1961) and Marglin (1963) claim that the interest of future generations should be recognised to the extent that the current public policy makers sanction them through the democratic process.
Feldstein (1964) has advocated that for public investment decisions, market determined future consumption must be rejected in favor of a politically determined social time preference function. He stated that “the STP rate should be a normative rate reflecting the government’s valuation of the relative desirability of consumption at different points of time.” Therefore, the rate of discount chosen by the government should be used to discount the stream of consumption, which is foregone by society as the public project under consideration has been undertaken.
return. Therefore, the social opportunity cost of a public project which displaces equivalent private investment will be underestimated by taking, only the marginal rate of return on private investment.
Another distinct method is to consider the “past average social rate of return” to capital as the best approximation for a desired rate in present value computations. But this rate should include taxes paid on income from capital as well as any other external effects not perceived by the individual investor, as discussed in Harberger (1972). It is more accurate to estimate the social rate of return on investment, which may be considerably higher than the private rate of return.
As we pointed out earlier, the STP rate need not be constant as it may vary according to changes in the growth rates and level of consumption, the rate of population growth, and the pure time preference rate. Similarly, a SDR based upon the SOC may depend on factors which will affect the marginal productivity of capital. According to Harberger (1967), these factors include the rate of capital formation, the growth rate of the labor force, technical advances, changes in the pattern of demand, and relative shifts toward or away from capital-intensive industries.
Burgess (2008) leads to a simulating discussion on the SOC criteria suggesting that SDR should reflect the SOC rather than the STP rate to ensure that public investments produce Pareto welfare improvements. Even if social welfare improvement is judged to be possible without passing the compensation test, the SDR should still reflect the SOC to ensure that the project is the most efficient use of public funds.
Creedy and Guest (2008) provide an analytical review of the estimation of alternative time streams relationship to the concept of time preferences. The nature of time preferences based on an axiomatic approach is also discussed. Roumboutsos (2010) emphasizes the importance of the SDR in the sustainability of public projects and reveals that the use of smaller discount rates has a severe influence on the selection of the project procurement method, e,g., whether the project will be produced traditionally or through public-private partnership.
Egypt: (1982) 10.0%; Weiss (1985) for Jamaica: 10.0%; Adhiari (1986) for Nepal: 9.0%; Shukla (1997) for India” 10.24%; Kula (2004) for India: 5.2%; Azar (2007) for the USA: 6.17%; and Percoco (2008) for Italy: 3.8%.
GROWTH MODEL APPROACH TO ESTIMATION OF THE EDR
The estimation of an EDR largely depends on the availability of data required for the preferred approach. Adhikari (1987) and Shukla (1997) provide detailed accounts of these approaches, along with their advantages and disadvantages. Initial studies for estimating an EDR were based on the static and dynamic Cobb-Douglas production functions. Although theoretically this approach is sound the estimation of marginal capital productivity capital with this method proves to be rather difficult due to complexity regarding the concept of capital and also the lack of data on the total capital stock for Turkey. In the ICOR approach, the rate is obtained from national statistics without capital stock estimation. Nevertheless, labor’s share must be excluded to find real opportunity cost of capital, which is not an easy task. Some research on the EDR uses market interest as a reliable proxy, but it may be not reliable indicator when there is volatility and instability in the financial markets, which was a common feature in Turkey during the estimation period. Finally, the growth model approach suggested by Hahn and Matthews (1964) has been modified by Shuckla (1997). This approach turns out to be more reliable than other advocated methods. The reliability of the approaches for estimation of the EDR is discussed in Shukla (1997), which essentially suggests that, on the whole, the growth model approach is much more reliable than other methods. This section of our study heavily relies on Shukla (1997), who simplifies the approach further due to the fact that incorporating savings, investment, production, technical progress, income distribution and so on is constrained by the data. The approach of Shukla (1987) differs from previous studies for estimating marginal propensity to consume (MPS). This method does not require an estimation of the capital stock of the economy. Shuckla’s approach is based on Harrod-Domar type of annual net output (Yt) and is expressed
with capital (Kt) and other resources, including labour for a particular
(t).
t t t AK
At is the net output to net capital ratio, which indicates that it is directly
proportional to capital invested. Therefore, the saved proportion of the total net output (s) is reinvested to produce new capital stock (Kt+1) in
the year t+1, which is expressed by the following equation:
t t t K sY
K+1 = + (2)
where s is the MPS.
It is assumed that the capital is the only variable and other inputs of production are constant. The net output from new capital asset is obtained as follows:
t t t Y qsY
Y+1 = + (3)
Equation (3) is expanded with an intercept and stochastic error term ut.
t t
t qsY u
Y+1 =α +(1+ ) + (4)
In equation (4), q stands for the marginal product of capital or for the EDR, and qs is the proportion of the marginal product which is saved; in other words, qs is the productivity of savings. Equation (4) is an autoregressive regression of net domestic product (NDP) lagged by one year with only the capital changing. The other inputs of production, such as land, are assumed to be constant. Change in labour input will adjust accordingly and technological progress is embedded into the autoregressive equation via time-dependent changes. The time series of NDP should be generated to estimate the value of 1+qs empirically. NDP series are generated by subtracting CFC (consumption of fixed capital) from GDP (gross domestic product).
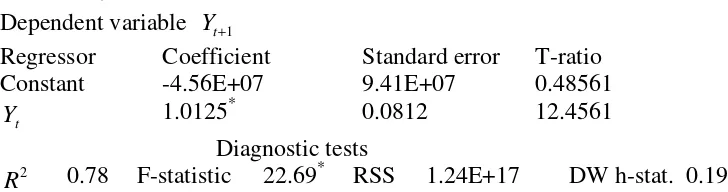
TABLE 1. SUMMARY COCHRANE-ORCUTT RESULTS
Dependent variable Yt+1
Regressor Coefficient Standard error T-ratio Constant -4.56E+07 9.41E+07 0.48561
t
Y 1.0125* 0.0812 12.4561
Diagnostic tests
2
R 0.78 F-statistic 22.69* RSS 1.24E+17 DW h-stat. 0.19 *
indicates 1% significance level. RSS stands for residual sum of squares. T-ratios are in absolute values. The C-O method is implemented with AR(2) errors. The results are achieved after 4 iterations.
The slope coefficient of equation (4) provides the information for the term 1+qs which is equal to 1.0125. Once we obtain the MPS value we can retrieve the value of q. The long-run consumption equation is expressed in its simplest form with a view of estimating the marginal propensity to consume (MPC) as follows:
t t t a a Y
C = 1+ 2 +ε (5)
C is private consumption expenditures, Y is gross domestic product, and t is stochastic error term. This study differs from previous studies
mainly in the methodology for estimating the value of MPC. Recent advances in time series analysis dictate that the long-run relation in equation (5) should incorporate the short-run dynamic adjustment process. A common practice for achieving this goal is to express equation (5) in an error-correction model, as suggested in Engle-Granger (1987). t t m i m i i t i i t i
t b b C b Y
C = + ∆ + ∆ +λε +µ
∆ − = = − − 1 1 1 2 0 2 1
0 (6)
equivalent from equation (5). εt−1 is substituted by linear combination of the lagged variables, as in equation (7).
An ARDL representation of equation (6) is formulated as follows:
= − − − = − + ∆ + + + ∆ + = ∆ 2 0 1 4 1 3 2 1 1 1 0 n i t t t i t i n i i t i
t b b C b Y bC bY v
C (7)
Pesaran et al. (2001) co-integration approach, also known as bounds testing, has some methodological advantages in comparison to other single co-integration procedures. They are as follows: a) endogeneity problems and an inability to test hypotheses on the estimated coefficients in the long-run associated with the Engle-Granger (1987) method are avoided; b) the long and short-run parameters of the model in question are estimated simultaneously; c) the ARDL approach to testing for the existence of a long-run relationship between the variables in the levels is applicable irrespective of whether the underlying regressors are purely I(0), purely I(1), or a combination of the two; and d) the small sample properties of the bounds testing approach are far superior to that of multivariate co-integration, as argued in Narayan (2005).
Given that Pesaran et al. (2001) co-integration approach is a relatively recent development in econometric time-series literature, a brief outline of this procedure is as follows: the bounds testing procedure is based on Fisher (F) or Wald-statistics and is the first stage of the ARDL co-integration method. Accordingly, a joint significance test that implies no cointegration hypothesis, (H0: b3 = b4 =0), against the
alternative hypothesis, (H1: at least b3≠0; or b4 ≠0), should be
performed for equation (7).
The F-test used for this procedure has a non-standard distribution. Thus, Pesaran et al. (2001) compute two sets of critical values for a given significance level, with and without a time trend. One set assumes that all variables are I(0) and the other set assumes they are all I(1). If the computed F-statistic exceeds the upper critical bounds value, then H0 is rejected. If the F-statistic falls into the bounds,
the critical values produced by Narayan (2005) are more appropriate than that of Pesaran et al. (2001).
The short-run effects between the dependent and independent variable are inferred by the size of the coefficients of the different variables in equation (7). The long-term effect is measured by estimates of lagged explanatory variables that are normalized on an estimate of b3.
Once a long-run relationship has been established, equation (7) is estimated using an appropriate lag selection criterion. In the second stage of the ARDL co-integration procedure, it is also possible to obtain the ARDL representation of the error correction model. To estimate the speed with which the dependent variable adjusts to independent variables within the bounds testing approach, following Pesaran et al., the lagged level variables in equation (7) are replaced by ECt-1, as in equation (8):
= − − = − + ∆ + + ∆ + = ∆ 2 0 1 2 1 1 1 0 k i t t i t i k i i t i
t c c C c Y EC
C δ µ (8)
A negative and statistically significant estimation of δ not only represents the speed of adjustment, but also provides an alternative means of supporting co-integration between the variables.
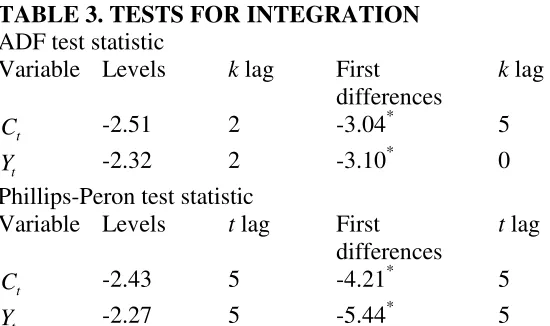
Annual data over the period 1985-2009 were used to estimate equation (8) by the Pesaran et al. (2001) procedure. Data definition and sources of data are cited in the appendix. To implement the Pesaran et al. procedure, one has to ensure that none of the explanatory variables in equation (5) is above I(1). It is, therefore, essential to apply some unit root tests. Two different types of unit root tests were implemented: Augmented Dickey-Fuller (ADF) (1981) and Phillips-Perron (PP) (1988). The unit root test result displayed in the appendix, Table 3 which verifies that the model variables in equation (5) are either I(0) or
was applied to equation (7) in order to establish a long-run relationship between the variables.
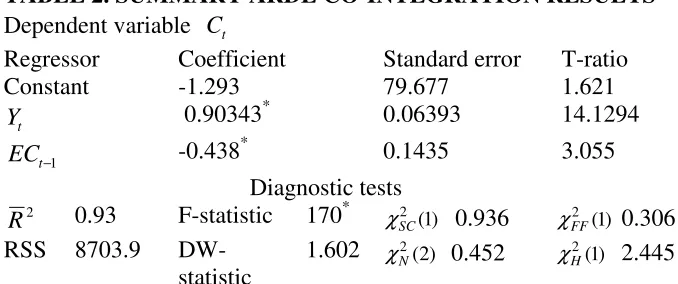
[image:11.595.124.463.246.388.2]The calculated F-statistic was 19.60, which is greater than the critical value of 4.63 at the 5% level of significance. This result confirms the long-run relationship in equation (5). The summary results of the ARDL co-integration procedure are presented in Table 2.
TABLE 2. SUMMARY ARDL CO-INTEGRATION RESULTS
Dependent variable Ct
Regressor Coefficient Standard error T-ratio
Constant -1.293 79.677 1.621
t
Y 0.90343* 0.06393 14.1294
1
−
t
EC -0.438* 0.1435 3.055
Diagnostic tests
2
R 0.93 F-statistic 170* χSC2 (1) 0.936 χFF2 (1) 0.306 RSS 8703.9
DW-statistic
1.602 χN2(2) 0.452 χH2(1) 2.445
*
indicates 1% significance levels. RSS stands for residual sum of squares. T-ratios are in absolute values.χSC2 ,χFF2 ,χN2 , and χH2 are Lagrange multiplier statistics for
tests of residual correlation, functional form mis-specification, non-normal errors and heteroskedasticity, respectively. These statistics are distributed as chi-squared variates with degrees of freedom in parentheses. The critical values for χ2(1)=3.84
and χ2(2)=5.99 at 5% significance level.
The results displayed in Table 2 pass a number of diagnostic tests. The magnitude and sign expectations on the estimated coefficients are theoretically satisfactory.
The error-correction term is statistically significant and its magnitude is moderate, indicating a reasonable return to equilibrium in the case of disequilibrium.
The long-run value of MPC is 0.90343, therefore from the equation of MPC+MPS=1 we can obtain the long-run value of MPS (s) as 0.09657. The OLS estimation of equation (4), which is reported in Table 1, indicates that 1+qs=1.0125; hence 1+0.09657q=1.0125, which leads to
CONCLUDING REMARKS
In the case of public projects such as electricity generation, transport or water and waste water treatment services, the appropriate discount rate should be the social opportunity cost rate. However, the project analyst, acting on behalf of both the present and future generations, should reflect inter-temporal choices, which perhaps favoring the increased welfare of future generations. In that case, the SDR should be lowered slightly to give priority to long-lived and capital lumpy social projects.
Owing to the shortage of capital and the implicit imperfection of the market in developing countries, the real cost of capital will most probably exceed the maximum cost authorised by the law or other regulations. Thus, the shortage of capital will lead to a rate of interest higher than the market rate. The re-evaluation of capital cost becomes even more pertinent when the government intervenes in capital markets and there also exists a notoriously disorganised capital market.
Developing countries should use the SDR since market rate of interest does not reflect the “intrinsic” value of capital. Putting it differently, the actual cost does not represent the equilibrium rate of interest which would prevail under a free and competitive market. If capital is underpriced and no shadow price is used, capital intensive projects will be favoured. On the other hand, if higher social discount rates are used, many of the investment projects may not appear profitable, and this can hamper efficient resource allocation.
In this paper, we estimated the value of the EDR for Turkey by using the data over the period from 1985-2009. The estimation of the EDR largely depends on the availability of data required for particular, plausible quantitative models. This paper, therefore, has only focused on the “growth model”, which seems to provide more sound and reliable results compared to other estimation techniques. The empirical results obtained for the EDR (12.94%) in Turkey is close the social discount rate found by Mashayekhi (1980).
The planning agency responsible for project evaluation in the public sector should be aware of the fact that the EDR of 12.94% may be deemed a bit high, particularly for the appraisal of public projects in less developed regions. Therefore, a variant of the EDR, namely a lower discount rate, can be pursued to enable the selection of more investment projects, along with applications of shadow wage rates and social prices for other inputs used in public projects.
APPENDIX
Data definition and sources
Annual data over the period from 1985-2009 used to implement the empirical analysis. All data come from the following source: Turkish Institute of Statistics (TIS).
Variables:
GDP=Y is gross domestic product in millions of Turkish Lira (TL), which is deflated by CPI.
PCE=C is private consumption expenditures in millions of TL, which is deflated by CPI.
CFC is consumption of fixed capital in millions of TL, which is deflated by CPI.
CPI is consumer price index is based on 2000 prices.
Unit Root Testing Procedure
[image:14.595.127.402.457.620.2]The time series properties of the variables in equation (5) are checked through Augmented Dickey-Fuller (ADF) of Dickey and Fuller (1981) and Phillips-Perron (1988) unit root-testing procedures. All the series in equation (1) appear to contain a unit root in their levels, but are stationary in their first differences, indicating that they are integrated at order one, i.e., I(1). The results are displayed in Table 3.
TABLE 3. TESTS FOR INTEGRATION
ADF test statistic
Variable Levels k lag First differences
k lag
t
C -2.51 2 -3.04* 5
t
Y -2.32 2 -3.10* 0
Phillips-Peron test statistic
Variable Levels t lag First differences
t lag
t
C -2.43 5 -4.21* 5
t
Y -2.27 5 -5.44* 5
REFERENCES
Adhikari, R., “Estimation of economic discount rate for practical project appraisal: the case of Nepal”, Project Appraisal, 1987, Vol.2, No.2, pp.113-122.
Adhikari, R., “National economic parameters for Nepal”, Project
Planning Centre Occasional Papers, 1986, No.9, University of
Bradford.
Azar, S. A., “Measuring the US social discount rate”, Applied
Financial Economics Letters, 2007, Vol.3, No.1, pp.63-66.
Baumol, W. J., “On the social rate of discount”, American Economic
Review, 1968, Vol.58, No.4, pp. 788-802.
Burgess, D., “Removing some dissonance from the social discount rate debate”, Working Papers, 2008, No.2, RBC Financial Group, Economic Policy Research Institute, Department of Economics, University of Western Ontario, Canada.
Creedy, J. and Guest, R., “Discounting and the time preference rate”,
The Economic Record, 2008, Vol.84, No.264, pp.109-127.
Curry, S. and Weiss, J., Project Analysis in Developing Countries, 2000, 2nd edition, London: Palgrave.
Dickey, D. A. and Fuller, W. A., “Likelihood ratio statistics for autoregressive time series with a unit root”, Econometrica, 1981, Vol.49, pp.1057-1072.
Dobb, M., An Essay on Economic Growth and Planning, 1969, London: Modern Reader.
Evans, D. J. and Sezer, H., “Social discount rates for member countries of the European Union”, Journal of Economic Studies, 2005, Vol.32, No.1, pp.47-59.
Eckstein, O., A Survey of the Theory of Public Expenditure, Public
Finance, Needs, Sources, Utilisation, 1961, New York: Princeton
University Press.
Engle, R. and Granger, C., “Cointegration and error correction representation: estimation and testing”, Econometrica, 1987, Vol.55, pp.251-276.
Feldstein, M. S., “The social time preference discount rate in cost-benefit analysis”, The Economic Journal, 1964, Vol.74, No.2, pp.360-379.
Gittinger, J. P., Economic Analysis of Agricultural Projects, 1982, Baltimore: The Johns-Hopkins University Press.
Irwin, G. W., Modern Cost Benefit Methods, 1978, London: MacMillan Press.
Hahn, F. H. and Mathews, R. C., “The theory of economic growth: a survey”, The Economic Journal, 1964, Vol.74, No.4, pp.779-902.
Harberger, A. C., Project Evaluation, 1972, London: MacMillan Press.
Harberger, A. C., Techniques of Project Appraisal, 1967, New York: National Bureau of Economic Planning.
Karatas, C., “Third Bosphorus bridge versus Bosphorus road tube tunnel and combined alternative: an economic appraisal”, Project
Appraisal, 1989, Vol. 4, No.2, pp.67-78.
Karatas, C., “Economic appraisal of the Bosphorus tube tunnel and Istanbul metro alternatives and their environmental impacts”, METU
Studies in Development, 2001, Vol..2, No. 1-2, pp.133-167.
Kula, E., “Estimation of a social rate of interest for India”, Journal of
Agricultural Economics, 2005, Vol.55, No.1, pp.91-99.
Little, M. D. and Mirrlees, A. J., Manual of Industrial Project Analysis
in Developing Countries, 1968, Paris: OECD.
Little, M. D. and Mirrless, A. J., Project Appraisal and Planning for
Developing Countries, 1974, New York: Basic Books IUC Publishers.
MacKean, R., Efficiency in Government through Systems Analysis, 1958, New York: John Wiley and Sons.
MacKinnon, J. G., Critical value for cointegration tests, 1991, in R. F. Engel and C. W. Granger (Eds.), Long run relationships: readings in cointegration (pp. 267-287), Oxford University Press, Oxford.
Marglin, S. A., “The social rate of discount on the optimal rate of investment”, Quarterly Journal of Economics, 1963, Vol.77, No.1, pp.95-111.
Markandya, A. and Pearce, D. W., “Development, the environment, and the social rate of discount”, The World Bank Research Observer, 1991, Vol. 6, No.2, pp.137-152.
Mashayekhi, A., “Shadow prices for project appraisal in Turkey”,
World Bank Staff Working Papers, 1980, No.392, Washington, DC:
World Bank.
Morales, L., “Barbados”, 1981, in Powers, T. (ed.), Estimating
Accounting Prices for Project Appraisal, Washington DC:
Inter-American Development Bank.
Narayan, P. K., “The Saving and investment nexus for China: evidence from cointegration tests”, 2005, Applied Economics, Vol.37, pp.1979-1990.
Page, J., “Shadow prices for trade strategy and investment planning in Egypt”, World Bank Staff Working Papers, 1982, No.521, Washington, DC: World Bank.
Pesaran, M. H., Shin, Y. and Smith, R. J., “Bounds testing approaches to the analysis of level relationships”, Journal of Applied
Phillips, P. C. B. and Perron, P., “Testing for a unit root in time series regression”, Biometrika, 1988, Vol.75, pp.335-346.
Phillips, D. A., “Pitfalls in estimating social discount rates: a case study”, Project Appraisal, 1986, Vol.1, No.1, pp.15-20.
Percoco, M., “A social discount rate for Italy”, Applied Economics
Letters, 2008, Vol.15, No.1, pp.73-77.
Pigou, A. C., The Economics of Welfare, 1950, London: MacMillan Press.
Price, C., “Investment reinvestment and social discount rate for forestry”, Forest Ecology and Management, 1988, Vol. 24, No.2, pp.293-310.
Roumboutsos, A. B., “Sustainability, social discount rates and the selection of project procurement method”, International Advances in
Economic Research, 2010, Vol. 6, No.2, pp.165-174.
Sen, A. K., “On optimizing the rate of saving”, The Economic
Journal, 1961, Vol.71, No.2, pp.479-496.
Scott, M. F., “Investment and growth”, Oxford Economic Papers, 1976, Vol.28, No.1, pp. 317-363.
Shukla, D. K., “Estimation of economic discount rate for project appraisal in India”, Project Appraisal, 1997, Vol. 12, No.1, pp.53-63.
Squire, T. and van der Tak, H. G., Economic Analysis of Projects, 1975, Baltimore: The Johns-Hopkins University Press.
Weiss, J., “National economic parameters for Jamaica”, Project
Planning Centre Occasional Papers, 1985, No.7, University of