PublisherInfo
PublisherName : BioMed Central
PublisherLocation : London
PublisherImprintName : BioMed Central
A new concept for Urate in human serum: Evidences that support
the existence of Urate as loosely associated and protein-bound
Urate in human serum
ArticleInfo
ArticleID : 312
ArticleDOI : 10.1186/ar312
ArticleCitationID : E002
ArticleSequenceNumber : 14
ArticleCategory : Non-peer-reviewed research
ArticleFirstPage : 1
ArticleLastPage : 10
ArticleHistory : RegistrationDate : 2001–4–25 OnlineDate : 2001–4–25
ArticleCopyright : BioMed Central Ltd2001
ArticleGrants :
Ahmed
Nabil Hegazi
Ph.D.
,Aff1 Corresponding Affiliation:Aff1Email: [email protected]
Aff1Clinical lab., Ain Shams University Hospitals, Ain Shams University, Egypt
Introduction
In this paper, it has been experimentally proved for the first time that urate is present in human serum bound to proteins. The protein-bound urates, when liberated, absorb in the ultraviolet light at wavelengths shorter than 293 - 295 nm, the wavelength at which the pure uric acid solution gives his maximum peak [1] .
Furthermore; the presence of other protein-bound substances which after being free, give rise to an increase in the absorption spectrum in the region between 270 and 300 nm and not attacked by uricase has been established.
Materials and Reagents
According to the fact that uric acid has its maximum absorbance in the U.V. light between the W.Ls of 290 nm and 295 nm under optimized conditions and making use of the specific destructive effect of uricase on uric acid, the absorption spectrum of a serum sample was carefully studied in the region between 270–300 nm before and after incubation with uricase.
Reagents
• Sodium hydroxide solution ; 0.1 and 0.4 mol/L.
• Tris buffer, pH. 8.5, 0.1 mol/L; Keep at 4°C.
• Uricase (urate : oxygen oxidoreductase, EC 1.7.3.3), 25 units in 25 ml of 0.1 mol/L Tris buffer, pH. 8.5, divide in 0.5 ml aliquots and keep frozen till use.
• Uricase (urate:oxygen oxidoreductase, EC 1.7.3.3),25 unit in 1 ml of 0.1 mol/ L of glycine buffer pH 9.35, just before use.
• Trichloroacetic acid (TCA) 50 g./L.
• Uric acid standard solution, 5.949 mmol/L.
Experimentals
Incubation of diluted serum with uricase
To 6 ml of Tris buffer solution, 0.1 mol/L, pH. 8.5, in a test tube add 20 uL of serum and mix. Set up a standard by diluting 10 uL of the standard uric acid solution, 5.945 mmol/L, to a final volume of five ml with the Tris buffer solution. Record the absorbance in the region between 275 and 300 nm against the Tris buffer solution as blank. Add 0.1 unit of uricase (reagent 4) to each tube and incubate at room temperature (25°C) for two hours. Record the absorbance again for both the sample tube and the standard against the blank within the same range of wavelengths. Repeat the measurements after 48 hours incubations
Incubation of both the protein-free supernatant and
the protein solution separately with uricase
To 200 uL of serum, add 1.8 ml of 50 g/L TCA, mix and centrifuge (1200 × g) for five minutes. Transfer 1 ml of the clear supernatant to a tube containing 3 ml of 1.33 mol/L glycine buffer, pH 9.35, and carry out the optical measurement in the region from 270–300 nm against a blank consists of 1 ml of 50 g/L TCA and 3 ml of the glycine buffer. On the other hand, dissolve the precipitated proteins in 5 ml of 0.1 mol/L sodium hydroxide solution, Buffer 1 ml of this solution with 3 ml of glycine buffer, 1.33 mol/L, pH 9.35 and carry out the optical measurements in the same way as with the clear protein-free supernatant. After the addition of 0.1 unit of uricase (reagent 4) to each of the buffered solutions, record the absorbance as before after incubation at room temperature (25°C) for two hours, 24 and 72 hours.
Incubation of the protein-free supernatant with
hydroxide solution 0.4 mol/L, at 60°C fore different
periods
To each of three test tubes containing 200 uL of a serum sample,add 0.8 ml of 0.4 mol/L sodium hydroxide solution, mix and leave in water bath 60°C.
After 5 minutes add 1 ml of 0.2 mol/L citric acid, mix and leave for further 1 minutes in the bath. After centrifugation (1200 × g) transfer 1 ml of the clear supernatant to another tube containing 3 ml of glycine buffer 1.33 mol/L pH 9.35 and keep ready for optical measurements.
Repeat this step with the other two test tubes after leaving in the water bath 60°C for periods of 10, and 15 minutes respectively.
Record the U.V spectrum for each of the three tubes in the region between 270 and 300 nm.; Then add 5 units of uricase (reagent 5) to each tube, mix and leave at room temp. (28°C) for two hours. Record the absorbance again in the same region of W.Ls.
Results
[image:4.612.52.556.524.726.2]The results obtained are illustrated in tables1,2and figures1,2,3,4&5.
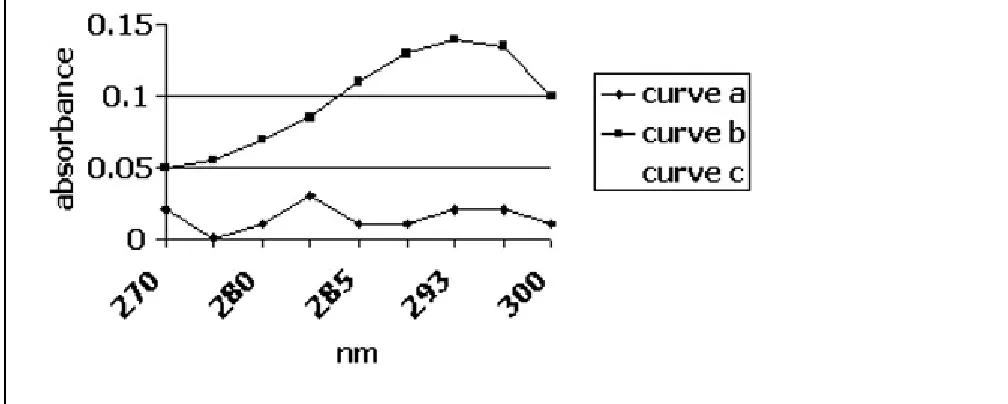
Figure 2 Curve (a) represents the difference between absorbance of the precipitated- protein solution before and after 24 hours incubation with uricase. The max. decrease obtained was at 283 nm. Curve (b) represents the difference between absorbance of the protein-free solution before and after 2 hours incubation with uricase. The max. decrease obtained was at 293 nm.
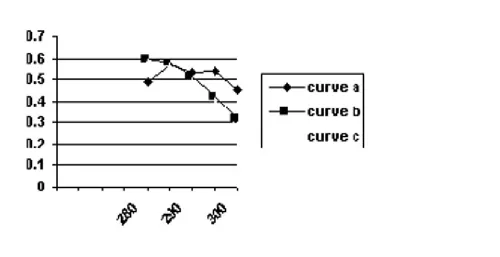
[image:5.612.55.555.433.690.2]same W.L at which the free uric acid solution gives its maximum absorption peak. More urate were liberated and absorb in the region between 290–295 nm.
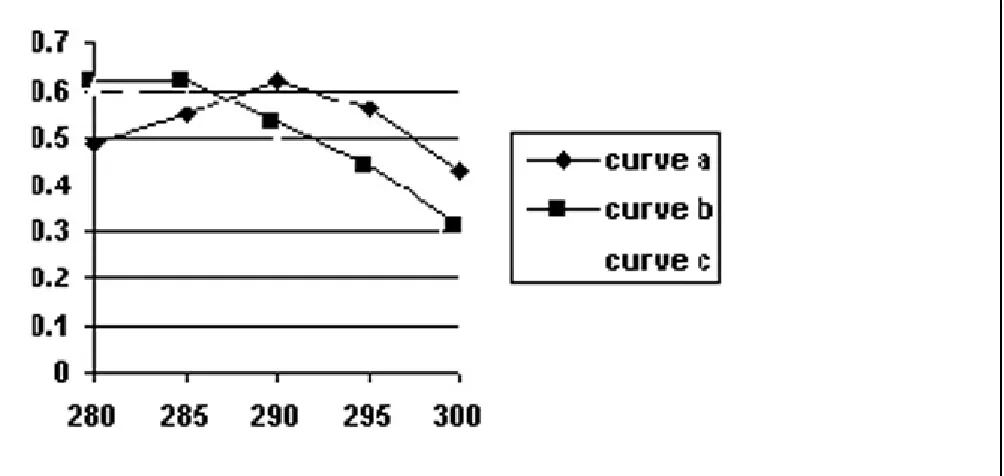
[image:6.612.57.559.486.724.2]Figure 5 The absorption spectra of the protein-free supernatant after leaving the serum sample for 15 minutes with sodium hydroxide solution 0.4 mol/L at 60°C. (a)-Before destruction with uricase. (b)-After destruction with uricase. The maximum decrease in absorbance recorded was at 295 nm,the same W.L at which the free uric acid solution gives its maximum absorption peak. More urate were liberated and absorb in the region between 287–290 nm.
Table 1 The absorption spectra of both the diluted serum sample and the pure uric acid solution before and after the action of uricase
W.L ABSORBANCE
nm
The serum The pure uric
sample acid sol.
A B A-B C U0 U2 U0-U2
270 0.225 0.205 0.020 0.27 0.05 0.030 0.02
275 0.250 0.230 0.020 0.28 0.07 0.020 0.05
280 0.240 0.230 0.010 0.29 0.10 0.030 0.07
283 0.250 0.215 0.035* 0.30 0.130 0.030 0.10
285 0.255 0.220 0.035* 0.29 0.150 0.030 0.12
290 0.250 0.220 0.030 0.25 0.180 0.030 0.15
293 0.220 0.205 0.015 0.165 0.190 0.030 0.16*
295 0.160 0.155 0.005 0.150 0.180 0.030 0.15
300 0.110 0.110 0.000 0.110 0.170 0.030 0.14
[image:7.612.59.555.145.391.2]The serum sample: A : The absorbance before the addition of uricase. B : The absorbance after 2 hours incubation with uricase. A-B : The difference between absorbances before and after incubation for 2 hours with uricase, the max. decrease is at 283–285 nm. C : The absorbance after 48 hours incubation with uricase, the abosrbance recorded was higher than that recorded before the action of uricase over the whole region of measurement (270–300 nm). The pure uric acid solution: U0: The absorbance before the addition of uricase. U2: The absorbance two hours after the action of uricase. U0- U2: The difference between absorbance before and after two hours incubation with uricase, the max. decrease is at 293 nm.
Table 2 The absorption spectra of both the precipitated protein solution and the protein-free supernatant before and after the action of uricase
W.L ABSORBANCE
nm
The precipitated The protein-free
protein solution supernatant.
B0 B24 B0-24 B72 A0 A2 A0- A2
270 0.620 0.600 0.020 0.63 0.210 0.160 0.050
280 0.610 0.600 0.010 0.65 0.220 0.150 0.070
283 0.600 0.570 0.030* 0.65 0.230 0.145 0.085
285 0.580 0.570 0.010 0.63 0.250 0.140 0.110
290 0.520 0.510 0.010 0.55 0.270 0.140 0.130
293 0.480 0.470 0.020 0.52 0.280 0.140 0.140*
295 0.400 0.380 0.020 0.42 0.270 0.135 0.135
300 0.300 0.290 0.010 0.40 0.230 0.130 0.100
The precipitated-protein soution: B0: The asorbance before the addition of uricase. B24: The absorbance after 24 hours incubation with uricase. B0-B24: The decrease in the absorbance after incubation for 24 hours with uricase, the max. decrease is at 283 nm. B72: The absorbance after 72 hours incubation with uricase, the absorbance recorded was higher than that recorded before the action of uricase over the whole region of measurement (270-300 nm). The protein -free supernatant : A0: The absorbance before the addition of uricase. A2: The absorbance two hours after the action of uricase. A0- A2: The difference between absorbance before and after two hours incubation with uricase, the max. decrease reached at 293 nm.
Table1(a,b) & figure1-curve a; denote a maximum decrease in absorbance at 283–290 nm after the action of uricase on the buffered diluted serum. On the other hand, the strongest band recorded for the pure uric acid solution was at 293 nm, table1{ U0-U2) } & figure1curve-b; the same wave length at which urate in the buffered protein-free clear supernatant also gives its maximum peak., Table2(A0 -A2.), figure2b.
In addition, table2, B0- B24,& figure2a; show a maximum decrease in absorbance at 283-285 nm when the buffered protein solution was left under the action of uricase for 24 hours.
After longer incubation periods, 48 hours, table1, C & table2, B72, the recorded absorbance was higher than the original values obtained before the action of uricase, table1, A & table, B0.
The absorption spectra of the clear protein-free supernatant after subjecting the serum for the action of sodium hydroxide solution 0.4 mol/L at 60°C for 5, 10 and 15 minutes, before and after destruction with uricase, as presented in figures3,4and5showed maximum decrease in absorbace at 295 nm – the same W.L at which the free uric acid gives its maximum absorption peak –, along the experiment periods of time (5,10 & 15 minutes),
Moreover, after 15 minutes, more urate were liberated and absorb at 290 nm – figure5.
Discussion
This, could be attributed to the presence of a sort of co-ordination between serum urates and proteins under physiologic conditions. As soon as the proteins were precipitated, part of the serum urates were identified in the protein-free supernatant at the same wavelength at which the free uric acid solution has its maximum peak. This part of serum urate is easily attacked by uricase.
The other part of serum urate appeared to be relatively strongly bound to proteins and is hardly attacked by uricase. After being free, it absorbs at shorter W.Ls, 283–285 nm (experiment [2]).
This might be understood on the basis of the old suggestion of gudzent [2] that both the lactam (keto) and the lactim (enol) toutomers of uric acid might be stable enough to coexist in biological fluids under certain circumstances.
In serum, these forms are expected to co-ordinate with proteins through hydrogen bonding. The energy of the hydrogen bond varies from 8.37 kJ for the H-N...H to 29.29 kJ for the H-O...H [3]. Therefore, it appears that the lactim toutomer will be relatively more strongly bound to proteins. Since the hydrogen bond by itself is a weak bond, this can explain why the loosely associated urate (lactam) is easily liberated as soon as the folded (quaternary) structure of proteins was disturbed. However the existence of protein-bound urate (PBU) could not be simply explained on the basis of hydrogen bond formation between the lactim toutomer of urate and proteins. Other type of co-ordinations might be involve to give that relatively stable protein-bound substance (PBU).
On the other hand, the hydrogen bond formation causes a relatively large amount of polarity in serum urate as compared to the pure uric acid solution. This may explain the spectral shifts in the absorbance maximum (283–290 nm) of serum urate compared to 293, 295 nm for the pure uric acid solution at the same pH (8.5, 9.35). Also this may explain the relative shift in the absorbance of the more polar lactim (PBU) to shorter W.Ls as compared to the relatively less polar lactam.
In addition, further investigation of the absorption spectra of serum between 270 nm and 300 nm before and after destruction with uricase demonstrate the presence of protein-bound substances which give their absorption spectra, after liberation from proteins, in the UV light at the W.Ls characteristic to uric acid or urate in serum and not affected by uricase. The rates of liberation of these substances differ than the rate of destruction of uric acid by uricase.
This represents the major obstacle against any attempt to record the real decrease in absorbance at 283–285 nm when serum proteins or the serum were subjected for the action of uricase. Actually, the results obtained are the difference between decrease in uric acid due to the destructive action of uricase and the increase of these liberated substances from proteins .
At the beginning, the rate of destruction of uric acid is higher than the rate of liberation of these substances, the result is a decrease in absorbance at 283–285 nm, the W.L. characteristic for urate max. absorbance in serum.
By the time the rate of liberation of these substances is increased in relation to the destruction rate of urate, this gives rise to increase in absorbance not only at the specific W.L characteristic to urate max. absorbance in serum, but also in the region from 270–300 nm.
Obviously, these substances will interfere with determination of serum urate if the measurements were carried out in the ultraviolet light after destruction with uricase.
References
1. Praetorius E, Poulsen H: Enzymatic determination of uric acid with detailed directions. Scand. J. Clin. & Lab. Inves . 1953, 5: 273-280.
2. Gudzent : Quantitative Clinical Chemistry, (Peters, J. P., and Van Slyke, D.D., Ed.) vol. Williams's Wilkins Company, Baltimore, and I table. 1946, 24:
635-3. Finar IL: Organic Chemistry, volume I, The English Language Book. Society and Longman group Limited,. 1973,