Comparative Study on the Effectiveness of TCSC and
UPFC Facts Controllers
N.Ashok kumar
1M.Rathinakumar
2M.Yogesh
3J.Dinesh
41
Assistant Professor , EEE Department, SCSVMV University, Tamilnadu, India.
2
Professor & HOD , EEE Department, SCSVMV University, Tamilnadu, India.
3&4
Senior Subject Matter Expert , SPi Global ,Tamilnadu, India
ABSTRACT
This paper discusses about the effectiveness of two FACTS devices TCSC and UPFC. One series device and another is the combination of series and shunt device (UPFC) in providing solutions for transmission line congestion problems. Here these FACTS devices are applied and tested in a IEEE-14 BUS system using MATLAB – SIMULINK platform. The results indicate certain findings which give certain idea which are definitely useful both academic point of it as well as the research scope of it.
Keywords
Matlab- Simulink,Power flow,TCSC,UPFC.
1. INTRODUCTION
Transmission line congestion is a widely discussed topic at the present scenario. Congestion on transmission line has a potential to create cascaded faults in the power system network and to collapse the power system. An increase in the demand of power leads to overloading of transmission lines to work under the maximum stressed state. This we call it as transmission line congestion. Congestion may be alleviated through various ways. Among the technical solutions, we have a system redispatch, system reconfiguration, out aging of congested lines, operation of FACTS devices and operation of transformer tap changers [1].
In this paper two FACTS devices TCSC and UPFC are applied over an IEEE 14 bus system and their results are analyzed,Particularly in the parameter of increasing the active power flow and providing reactive power support to the power system. Power flow in the transmission line can be controlled by regulating the voltage at the two ends of the line, the phase angle or the resistance of the line [2]. Thyristor controlled series compensator works on the principal of regulating the voltage of the transmission line by injecting voltage employing a capacitor or inductor. The converter based unified power flow controller regulates the output voltage of the converter to control the power flow. Generally there are three types of model of FACTS devices available in the literature.
1. Steady state model for system steady state evaluation
2. Electromagnetic model for detailed equipment level investigation.
3. Dynamics model for stability studies. [2]
This paper deals with the steady state models of TCSC and UPFC which is incorporated using Matlab Simulink. The placement of FACTS devices holds the key in the order it relieves the congestion. Many methods are available to help in the location of FACTS devices like sensitivity index method [4]. Here based on the load flow results, Bus 2 and Bus 9 are selected . Based on their power flow values and FACTS devices are applied over there. TCSC is applied for their ability to manipulate power flows in desired lines and to rapidly modulate the line’s series impedance in response to power system dynamics [3]. UPFC consisting of two convertors is capable of simultaneously controlling three power system quantities i.e. the bus voltage, real and reactive power flows [3]. Even though FACTS controllers have many specific areas of applications in power systems like to damp the low frequency oscillations [5], to increase the voltage stability margin [6], In this work a simulation based study on the effectiveness of manipulating the active and reactive power flows in a power system is analyzed. Here particularly for TCSC and UPFC comparison is made in their ability to manipulate power flows.
2. FACTS DEVICES MODEL
2.1 Facts Devices
FACTS controllers can be broadly divided into four categories, which include
Series controllers, Shunt controllers,
Combined series-series controllers, and Combined series-shunt controllers.
2.1.1. Thyristor – Controlled Series
Compensator (TCSC):
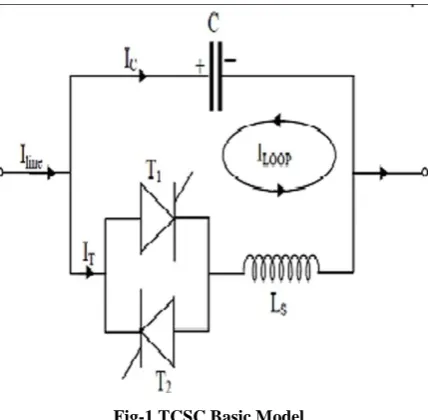
[image:2.595.327.543.152.296.2]The basic conceptual TCSC module comprises a series capacitor, C, in parallel with a thyristor-controlled reactor, LS, as shown in Fig.1. However, a practical TCSC module also includes protective equipment normally installed with series capacitors [8]. A metal-oxide varistor (MOV), essentially a nonlinear resistor, is connected across the series capacitor to prevent the occurrence of high-capacitor over- voltages. Not only does the MOV limit the voltage across the capacitor, but it allows the capacitor to remain in circuit even during fault conditions and helps improve the transient stability.
Fig-1 TCSC Basic Model
Also installed across the capacitor is a circuit breaker, CB, for controlling its insertion in the line. In addition, the CB bypasses the capacitor if severe fault or equipment-malfunction events occur. A current-limiting inductor, Ld, is incorporated in the circuit to restrict both the magnitude and the frequency of the capacitor current during the capacitor-bypass operation. An actual TCSC system usually comprises a cascaded combination of many such TCSC modules, together with a fixed-series capacitor, CF. This fixed series capacitor is provided primarily to minimize costs.
Operation of the TCSC:
A TCSC is a series-controlled capacitive reactance that can provide continuous control of the power of the AC line over a wide range. From the system viewpoint, the principle of variable-series 40 compensation is simply to increase the fundamental-frequency voltage across a fixed capacitor (FC) in a series compensated line through
appropriate variation of the firing angle, α [44]. This enhanced voltage changes the effective value of the series-capacitive reactance.
A simple understanding of TCSC functioning can be obtained by analyzing the behavior of a variable inductor connected in parallel with an FC, as shown in Fig. 2
Fig.2 A variable Inductor in Shunt with a FC
The equivalent impedance, Zeq, of this LC combination is expressed below. The impedance of the FC alone, however, is given by There are essentially three modes of TCSC operation.
1
1
eq
Z
j
wc
wL
The impedance of the FC alone, however, is given by
j
1
wc
(i) Bypassed Thyristor Mode (ii) Blocked thyristor Mode
(iii) Partially Conducting thyristor Mode
Two alternative power flow models to assess the impact of TCSC equipment in network wide applications are presented in this section. The simpler TCSC model exploits the concept of a variable series reactance. The series reactance is adjusted automatically, within limits, to satisfy a specified amount of active power flows through it.
The more advanced model uses directly the TCSC reactance–firing-angle characteristic, given in the form of a nonlinear relation. The TCSC firing angle is chosen to be the state variable in the Newton– Raphson power flow solution.
Impedance Characteristic:
[image:2.595.80.296.344.554.2]Fig.3 Impedance Vs Firing Angle Characterstics Curve
The net reactance of TCR, XL (α) is varied from its minimum value XL to maximum value infinity. Likewise effective resistance of TCSC starts increasing from TCR XL value to till the occurrence of parallel resonance condition XL (α) = XC, theoretically XTCSC is infinity. This region is inductive region. Further increasing of XL (α) gives capacitive region, Starts decreasing from the infinity point of minimum value of capacitive reactance XC. Thus, impedance characteristics of TCSC shows, both capacitive and inductive region are possible though varying firing angle (α).
From 90 < α < αLlim Inductive region. αLlim < α < αClim Capacitive region
Between αLlim < α < αClim Resonance region
While selecting inductance, XL should be sufficiently smaller than that of the capacitor XC. Since getting both effective inductive and capacitive reactance across the device. Suppose if XC is smaller than the XL, then the only capacitive region is possible in impedance characteristics. In any shunt network, the effective value of resistance follows the lesser resistance present in the branch. So only one capacitive reactance region will appears. Also XL should not be equal to XC value; or else a resonance develops that result in infinite impedance – an unacceptable condition.
Note that while varying XL (α), a condition should not allow to occur X ((α) = XC.
2.1.2. Unified Power Flow Controller
(UPFC):
The UPFC is the most versatile FACTS controllers with capabilities of voltage regulation, series compensation, and phase shifting. The UPFC is a member of the family of compensators and power flow controllers [8]. The latter utilizes the synchronous voltage source (SVS) concept to provide a unique comprehensive capability for transmission system control. The UPFC is able to control simultaneously or selectively all the parameters affecting the power flow 51 patterns in a transmission network, including voltage magnitudes and phases, and real and reactive powers. These basic capabilities make the UPFC the most powerful device in the present day transmission and control systems.
Basic operating principles of UPFC
: As illustrated in Fig 4, the UPFC is a generalized SVS represented at the fundamental frequency by controllablevoltage phasor of magnitude Vpq and angle injected in series with the transmission line. Note that the angle ρ can be controlled over the full range from 0 to 2π. In the system shown in Fig 4, the SVS exchanges both real and reactive power to the transmission system.
Fig.4 Representation of UPFC in Two machine power System
In the UPFC, the real power supplied to or absorbed from the system is provided by one of the end buses to which it is connected. This meets the objective of the UPFC to control power flow rather than increasing the generation capacity of the system.
Fig.5 UPFC implementation by two Back-to-back VSC
As shown in Fig 5, the UPFC consists of two voltage-sourced converters, one in the series and one in shunt, both using Gate Turn-Off (GTO) thyristor valves and operated from a common DC storage capacitor. This configuration facilitates free flow of real power between the AC terminals of the two converters in either direction while enabling each converter to independently generate or absorb reactive power on its own as terminal.
transformer is generated internally while the real power exchanged is converted into DC power and appears on the DC link as a positive or negative real power demand. By contrast, the shunt converter, referred to as Converter 1, supplies or absorbs the real power demanded by Converter 2 on the common DC link and supports the real power exchange resulting from the series voltage injection. It converts the DC power demand of Converter 2 into Ac and couples it to the transmission line via a shunt connected transformer.
Converter 1 can also generate or absorb reactive power in addition to catering to the real power needs of Converter 2; consequently, it provides independent shunt reactive compensation for the line. It is to be noted that the reactive power exchanged is generated locally and hence, does not have to be transmitted by the line. On the other hand, there exists a closed path for the real power exchanged by the series voltage that is injected through the converters back to the line. Thus, there can be a reactive power exchange between Converter 1 and the line. This exchange is independent of the reactive power exchanged by Converter 2.
3. CRITERIA FOR OPTIMAL
PLACEMENT
3.1 Best location for TCSC and UPFC
Placement
To define the appropriate placement of TCSC and UPFC, firstly the base load flow study is carried out for the data given in Appendix I .Weak and strong bus are identified with the values of active and reactive power flows respectively. P, Q is computed and ranked. It is noted that TCSC should not be placed between two generator buses. The reason for selecting a 14-bus system is, only a small part of a very large transmission.
4. SIMULATION RESULTS
The simulation was carried out for IEEE-14 bus system without FACTS devices and the results are tabulated as follows.
4.1.
Without FACTS Devices
The proposed method has been tested to IEEE 14- Bus System as shown in the Figure 6. Two FACTS devices are inserted in the system in between a bus having low active power flow and a bus having high active power flow comparative results are getting and tabulated with real and reactive power values.
Fig.6 14-Bus IEEE standard system
The above figure represents IEEE-14 bus system, the following results shown in Fig.7 and Fig.8 represents the outputs without controllers.
Fig.7 Bus1 Real And Reactive Power flows without controllers
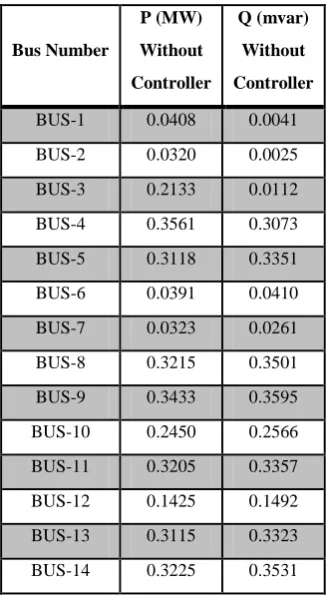
TABLE I
POWER FLOW WITHOUT CONTROLLER
Bus Number
P (MW)
Without
Controller
Q (mvar)
Without
Controller
BUS-1 0.0408 0.0041 BUS-2 0.0320 0.0025 BUS-3 0.2133 0.0112 BUS-4 0.3561 0.3073 BUS-5 0.3118 0.3351 BUS-6 0.0391 0.0410 BUS-7 0.0323 0.0261 BUS-8 0.3215 0.3501 BUS-9 0.3433 0.3595 BUS-10 0.2450 0.2566 BUS-11 0.3205 0.3357 BUS-12 0.1425 0.1492 BUS-13 0.3115 0.3323 BUS-14 0.3225 0.3531
From the Table I, it is clear that BUS-2 is the bus having low power flow ( active power in particular) with lowest P, Q values and Bus 4 and BUS-9 are the buses with high P, Q values. So, in between BUS-2 and BUS-9 FACTS controllers are placed. The following table represents the nature of buses depending on their power flow values.
TABLE II
DETAILED ANALYSIS OF 14 BUS SYSTEM
Bus
Number Remarks
1 LOW POWER FLOW
2 VERY LOW POWER FLOW 3 HIGH POWER FLOW 4 HIGH POWER FLOW 5 HIGH POWER FLOW
6 LOW POWER FLOW
7 LOW POWER FLOW
8 HIGH POWER FLOW 9 VERY HIGH POWER FLOW 10 HIGH POWER FLOW 11 HIGH POWER FLOW 12 HIGH POWER FLOW
13 HIGH POWER FLOW 14 HIGH POWER FLOW
[image:5.595.103.267.119.419.2]4.2.Results after placement Of TCSC
Fig.9 Simulink model of IEEE-14 bus system with TCSC
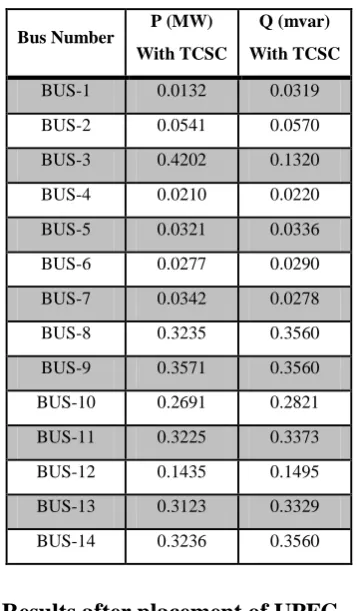
The following output results indicate the increase in power flows in Bus-2 and Bus -9 after placing TCSC
[image:5.595.332.537.158.335.2]Fig.10 Bus-2 Real And Reactive Power
[image:5.595.328.573.576.717.2]TABLE III
POWER FLOW WITH TCSC CONTROLLER
Bus Number
P (MW)
With TCSC
Q (mvar)
With TCSC
BUS-1 0.0132 0.0319 BUS-2 0.0541 0.0570 BUS-3 0.4202 0.1320 BUS-4 0.0210 0.0220 BUS-5 0.0321 0.0336 BUS-6 0.0277 0.0290 BUS-7 0.0342 0.0278 BUS-8 0.3235 0.3560 BUS-9 0.3571 0.3560 BUS-10 0.2691 0.2821 BUS-11 0.3225 0.3373 BUS-12 0.1435 0.1495 BUS-13 0.3123 0.3329 BUS-14 0.3236 0.3560
[image:6.595.95.276.117.423.2]4.3.Results after placement of UPFC
Fig.12 Simulink model of IEEE-14 bus system with UPFC
[image:6.595.324.576.255.399.2]The above figure represents UPFC placed in between Bus 2 and Bus 9 in an IEEE -14 bus system. The results are tabulated as follows. The output graphs are shown for bus 2 and bus 8. Also to be noted is that bus 9 has a steep fall in the value.
Fig.13 Bus-2 Real And Reactive Power
Fig.14 Bus-8 Real And Reactive Power
TABLE IV
POWER FLOW WITH UPFC CONTROLLER
Bus Number P (MW) With UPFC
Q (mvar)
With UPFC
[image:6.595.344.522.450.731.2]5.
RESULTS AND DISCUSSION
By placing the TCSC and UPFC on the 14 Bus system, at the bus having low active power flow (BUS-2) and the bus having high active power flow (BUS-9), It is seen that the real and reactive power flows has considerable variations . The power flow in the system after the placement of TCSC has increased the active power flow in bus2 and bus 9. But in the case of UPFC it has increase in active power flow in bus 2 but decrease in active power flow in bus 9. This opens a significant research lead on the performance of TCSC and UPFC particularly in the control of active power flow. Since TCSC is a dedicated series connected controller it exhibits supremacy in the control of active power flow compared to UPFC. Anyway this result is to be further validated by testing it in different power system models.
TABLE V
COMPARATIVE RESULTS OF POWER FLOW TCSC& UPFC CONTROLLER
Bus Number P (MW) With TCSC Q (MW) With TCSC P (MW) With UPFC Q (MW) With UPFC
BUS-1 0.0132 0.0319 0.0128 0.0318 BUS-2 0.0541 0.0570 0.0330 0.0355 BUS-3 0.4202 0.1320 0.4100 0.1315 BUS-4 0.0210 0.0220 0.0202 0.0202 BUS-5 0.0321 0.0336 0.0318 0.0353 BUS-6 0.0277 0.0290 0.0266 0.0288 BUS-7 0.0342 0.0278 0.0332 0.0258 BUS-8 0.3235 0.3560 0.3201 0.3342 BUS-9 0.3571 0.3560 0.0861 0.0875 BUS-10 0.2691 0.2821 0.0562 0.0584 BUS-11 0.3225 0.3373 0.3115 0.3355 BUS-12 0.1435 0.1495 0.1425 0.1492 BUS-13 0.3123 0.3329 0.3117 0.3332 BUS-14 0.3236 0.3560 0.3221 0.3558 The above table represents a cross comparison between two controllers TCSC and UPFC in manipulating the active power flow component. This nature of the results is to be further tested with larger power systems and to be validated.
6.
CONCLUSION
This paper gives a concise idea on each of the FACT devices, UPFC and TCSC . Their Individual contribution towards the improvement of active power flow and reactive power flow and has been tested on a 14-bus system. The TCSC device located at the optimum locations is observed to have a better active power flow improvement than the UPFC. This results are to be further validated by testing it in different power system models. Further the reasons for their [TCSC] performance
dominance particularly in active power flow control over UPFC has still to be further investigated.
7.
REFERENCES
[1] L. Rajalakshmi, M. V. Suganyadevi, S. Parameswari, “Congestion Management in Deregulated Power System by locating Series FACTS devices.”IJCA , Volume 13-No 8, January 2011.
[2] Samina E. Mubeen, R. K. Nema, Gayatri Agnihotri, “Comparison of Power flow control TCSC versus UPFC IEEE Publications.
[3] J.G. Singh, S. N. Singh, S. C. Srivastava, “Placement of FACTS controllers for enhancing power system loadability”. IEEE Publications 2006.
[4] J. G. Singh, S.N. Singh, S. C. Srivastava “Enhancement of Power System Security through Optimal Placement of TCSC and UPFC.” IEEE Publications 2007.
[5] M.A .Furini, P.B.de Araujo, “ A Comparative Study of the Damping Oscillation Function of TCSC and UPFC IEEE Publications 2008.
[6] Mehrdad Ahmadi Kamarposhti, Mostafa Alinezhad, Hamid Lesani, Nemat Talebi “Comparison of SVC ,STATCOM, TCSC and UPFC controllers for Static Voltage Stability Evaluated by Continuation Power Flow Method. IEEE Publications 2008.
[7] K.R. Padiyar, 2002, “Power System Dynamic Stability and Control,” Second Edition, BS Publications, Hyderabad.
[8] N.G. Hingorani, L. Gyugyi, 1999, “Understanding FACTS: Concepts and Technology of Flexible AC Transmission Systems,” IEEE Press, New York. [9] S. Kannan, S. Slochanal, and N.P. Padhy,
"Application and Comparison of Metaheuristic Techniques to Generation Expansion Planning Problem," IEEE Trans. on Power Systems, vol. 20, no. 1, pp. 466-475, Feb. 2005
[10] C. Huang, C.J. Huang, and M. Wang, "A Particle swarm optimization to identifying the ARMAX model for short-term load forecasting," IEEE Trans. on Power Systems, vol. 20, no. 2, pp. 1126-1133, May 2005.
[11] J. C. Hernandez, Y. del Valle, G.K. Venayagamoorthy, and R.G. Harley, "Optimal allocation of a STATCOM in a 45 bus section of the Brazilian power system using particle swarm optimization," To be presented on the IEEE Swarm Intelligence Symposium 2006 (2006), Indianapolis, 2006.
[12] J. Kennedy, and R. Eberhart, "Particle swarm optimization," in Proc. IEEE Int. Conf. Neural Networks, vol. 4, 1995, pp. 1942-1948.
[13] R. Eberhart, and J. Kennedy, "A new optimizer using particle swarm theory," in Proc. 6th Int. Symp. Micro Machine and Human Science (MHS '95), 1995, pp. 39-43.