Detecting Activation Patterns for Working
Memory Task: A Study
Khushbu Mehta
ME(CSE)Student
Government College of Engineering Aurangabad, India
Meghana Nagori
Asst. Professor, CSE Dept. Government College of Engineering
Aurangabad, India
ABSTRACT
fMRI is an advanced non-invasive technique used by neurologists to measure and study the brain region activations while performing a particular task. The objective of this paper is to observe the activation patterns in healthy controls and schizophrenics while performing working memory task. In order to study this the authors have used data from fBIRN and the working memory task is SIRP(The Sternberg Item Recognition Paradigm).The research flow proposed by the authors is to preprocess the fMRI data and then estimate parameters using GLM(General Linear Models) as observed from design matrix. Finally it concludes by generating activation maps for both healthy controls and schizophrenics along with extracting activated regions for both. The paper is organized in six sections. Section I and II introduces fMRI and schizophrenia. Section III briefly discusses the data acquisition methods, parameters, SIRP task and tools used. Section IV illustrates the entire preprocessing steps. In section V, a brief discussion on parameter estimation is carried out. Section VI concludes the findings made by the authors from generated SPM(Statistical Parametric Mapping) maps.
General Terms
Pattern Recognition
Keywords
fMRI, Schizophrenia, Working Memory, SIRP, Activation map, GLM
1.
fMRI
fMRI is an advanced technique to measure and study the brain functions and activity. Brain researchers, psychologists, psychiatrists and neurologists are using fMRI technology in understanding the function and the activity of the brain, because fMRI is a non-invasive powerful tool. It gives accurate visualization of the location of activity in brain regions related to specific particular task [1].While taking the fMRI images of the person, he cannot be injected by any of the radioactive material, so it is not harmful for the person even if it is performed so many times. BOLD (Blood Oxygen Level Dependent) fMRI is the most commonly used fMRI technique other than these fMRI techniques - Perfusion fMRI, Diffusion-Weighted imaging fMRI and MRI spectroscopy, offers images with temporal resolution on the order of 100 milliseconds and spatial resolution of 1-2 millimeters. It works by detecting the changes in the blood oxygenation and flow that occur in response to neural activity. When brain area is more active, it consumes more oxygen and to meet this increased demand, blood flow increases to the active area. With this fMRI one can make statistical statements in comparing different mental states within an individual across the sessions and to produce activation maps showing which
parts of the brain are involved in a particular mental process carrying out specific particular task [2, 3]. Thus, fMRI has an important use in understanding how a brain functions in healthy control and the one who suffers from mental disorder such as the patients from Schizophrenia [1, 2, 3 ]. Using this fMRI data and fMRI activation maps, brain researchers are capable of discriminating healthy control and mental disorder patients. Functional magnetic resonance imaging (fMRI) data have the capability to characterize and classify various brain disorders including schizophrenia with a higher degree of accuracy and have been used by Brain researchers to characterize abnormalities between mental disorder diseased patients and healthy control.Thus, by examining the difference between patient group and healthy control on neuroscientific fMRI data one can classify patient with mental disorder. Depending on the magnetic properties of hemoglobin carrying the amount of oxygen, fMRI measures brain activities. The brain is imaged at discrete time intervals while a subject is required to carry out a task or presented with a stimulus [4].
2.
SCHIZOPHRENIA
Schizophrenia is a mental disorder which causes impairment in person’s thought processes, impairments in insight and judgment. The individuals are not capable to evaluate his surroundings and to interact with other peoples in their surroundings [4].
fMRI data for the healthy control and for schizophrenic patients can be used to characterize and find abnormalities in mental illness disorder such as schizophrenia. Schizophrenic patients show hyper activations, hypo activations, or no differences compared with the healthy controls [5].
3.
DATA ACQUISITION, METHOD AND
TOOLS USED
3.1
Experimental fMRI Dataset
The fMRI data for 10 Healthy Control and 10 Schizophrenic patients while performing SIRP (The Sternberg Item Recognition Paradigm) Working Memory has been downloaded from fBIRN (functional Biomedical Informatics Research Network, http://fbirnbdr.nbirn.net:8080/BDR) collaboration. The multisite project consists of multiple research institution that has participated in the acquisition of fMRI data from patients with schizophrenia. Further details about the imaging methods and scanning protocol are available at the fBIRN website.
differences between the two groups and investigate how the brain function of patients differs from that of healthy controls.
3.2
Method for collecting SIRP fMRI data
In SIRP fMRI session, total 177 functional images are recorded. Out of these 177 images, some are taken when stimulation (subject is active in performing particular task) is applied and some images will be taken with the subject at rest. The first two images were discarded to avoid the T1 effects in the initial scans of an fMRI time series. In SIRP task, subjects is looking at the numbers appearing on the screen for some duration and then recall it and press the button with index finger if the number matches with the already seen number and if it does not matches then press button with middle finger.
The length of run is 360 seconds. Each run of the task composed of 6 blocks of memory set of digits. Each block consists of one memory set of digits including a prompt, an encode epoch, and a probe epoch. A prompt was the letter ‘Learn’ presented for 1.5 second followed by 0.5 second of black screen which prompts the subject to learn the subsequent memory set of digits. During an encode period, a memory set of 1, 3 or 5 digits was presented in red color for 6 seconds classifying these memory set as low load, medium load and high load conditions respectively. Each memory set consisting different digits appears exactly twice during the run. During the 1 and 3 digits memory set, asterisks (*) were presented in place of digits to control for the number of items presented on the screen across blocks. A probe epoch lasts longer for about 38 seconds containing total 14 probes in green. Following an initial 1second fixed delay before the first probe digit, probes were displayed for a duration of 1.1 s with a random interval between probes varying between 0.6 - 2.486 s. Thus, on average, a probe digit occurred approximately once every 2.7 seconds. Within each memory set of digits, half of the probes were positive trial and half probes were foil i.e. negative trials and each digit of the memory set was presented at least once. During each run, subject has to respond 42 positive trials and 42 foils. In between these two blocks, there is a fixation period during which flickering cross hair (+) appears on screen with an interval of 2s, which included a 1.85s on, and a 0.15s off periods and the subject is instructed to relax within this period. The first interval of each fixation block lasted 2.8s. Each fixation block lasted between 4 s and 20 s, for an average of 12 seconds. The length of last fixation block is 14 seconds. Figure 1, has been taken from the paper mentioned in [6].
3.3
Software Tools used for fMRI Data
Preprocessing and Analysis
The tools used are SPM, Talairach atlas and WFU Pick atlas. In this section, the authors provide you basic idea about these software tools.
3.3.1
SPM(Statistical Parametric Mapping)
SPM is a statistical technique created by Karl Friston for examining differences in brain activity recorded during functional neuroimaging experiments.
There different versions of SPM are available such as SPM 99, SPM2, SPM5, SPM8. The authors used SPM8 (http://www.fil.ion.ucl.ac.uk/spm/) for fMRI data preprocessing and analysis.
3.3.2
Talairach Software
The Talairach software, generally known as the Talairach Daemon, was created and developed by Jack Lancaster and PeterFox at the Research Imaging Institute of the University of Texas Health Science Center San Antonio (UTHSCSA). The software include three different components-
Talairach Client: a java application for finding individual and batch labels as well as command-line tools for accessing the daemon. The Talairach Client is used to assign Talairach Atlas labels for a given x, y, z coordinate. The assigned label is hierarchical, and is composed of five levels: hemisphere, lobe, gyrus, tissue type, and cell type.
For example: Left Cerebrum, Parietal Lobe, Postcentral Gyrus, Gray Matter, Brodmann area2.
2. Talairach Applet: a web application for the daemon which includes graphical overlays and nearest gray matter searches.
3. Talairach Daemon: A high speed database server for querying and retrieving data about human brain structure over the internet [7, 8].
3.3.3
WFU_Pick Atlas
WFU_Pick Atlas (available at www.ansir.wfubmc.edu) provides a method for generating ROI masks based on the Talairach daemon database. The toolbox was developed in the Functional MRI Laboratory at the Wake Forest University School of Medicine. This SPM toolbox allows you to create ROI masks using pre predefined atlases, or spheres or cubes of dimensions and center points that you specify.
For example, a mask of middle frontal gyrus.
4.
EXPERIMENTAL RESULTS
OBTAINED DURING PRE-PROCESSING
OF WORKING MEMORY FMRI DATA
As the fMRI data is noisy and high dimensionality of the fMRI data, it is necessary to carry out accurate preprocessing, analysis and interpretation [1]. The purpose of the preprocessing is to remove different artifacts in the data and to have highly accurate statistical analysis [9, 10, 11, 12].
All preprocessing is carried out within the MATLAB 7.12.0.635(R2011a) using the most popular tool SPM8 (statistical parametric mapping 8).
4.1
Slice timing Correction
All voxel slices within the volume are acquired at slightly different times. The slice timing correction of the fMRI data is required so that it seems to be appears that each slice in each volume is acquired at the same time [9, 10, 11, 12].
4.2
Realignment
Fig1: SIRP Working Memory Task Paradigm
This realignment can be carried out using two steps-
1. In first step total six parameters are determined. Total of these six parameters, three parameters required for rotation across x, y, z axes and three translation parameters across left-right, up-down and forward-backward needed for rigid body transformation of the images to the first functional image is being determined[9,10,11].
In SPM, a set of these realignment parameters are saved for each session, in a file rp_*.txt. These realignment parameters can be used as regressors in subsequent steps [10].
2. And in second step these six, three for rotation and three for translation; parameters are applied to the functional images. In SPM, the realigned images are prefixed with the letter ‘r’. SPM will also create a mean image ‘meanf*.img which will be used in next coregistration step [9, 10, 11].
Figure 2 shows estimated rotation and translation parameters used to correct the head motion.
4.3
Co-registration
The goal of this step is to superimpose all the brain activations onto the anatomical location of the image. To achieve this goal, all the functional images are realigned with the structural images. [9, 10]This can be achieved using one of the following two methods-
1. Segment the images and match subsequent separate segments.
2. Mutual information method, which is used if structural image is T1 weighted and or functional scans are T2* weighted. Using coregistration, the difference between these two images can be minimized. Thus, by overlaying both the structural and functional images, it maximizes mutual information between the two images.
In SPM, the source image is the structural image and the reference image is the mean functional image ‘meanf*.img’. The reference image is assumed to remain stationary and source image is moved to match it. This reference functional image is coregistered to the high resolution structural image and then all of the other functional images are resliced to align with these reference mean functional image [9, 10].
[image:4.595.326.528.299.546.2]Figure 3 shows the example of SPM output for mutual– information coregistration.
Fig 3: Mutual Information Coregistration of SIRP working memory for healthy control.
In fMRI session, a low resolution functional scans are acquired every few seconds. Thus, it is used when combining fMRI data from different sessions or subjects and to align low resolution functional fMRI images to a high resolution structural image to view high quality brain activation images.
4.4
Segmentation
The primary goal of segmentation is for bias correcting, spatially normalizing or segmenting fMRI data. In SPM, it will produce spatial normalization parameters and these
parameters can be written in ‘*-seg_sn.mat’ file and inverse spatial normalization parameters can be stored into ‘*-seg_inv_sn.mat. These can be used to normalize the functional data. It will output the Grey matter image ‘c1s*.img’, White matter image ‘c2s*.img’ , Cerebro-Spinal Fluid image c3s*.img, bias corrected structural image ‘ms*.img’[10].
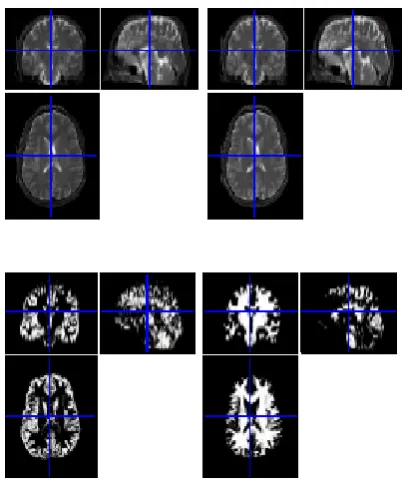
The figure 4 shows the segmentation result, top left original image, top right bias corrected image, bottom left segmented grey matter image, bottom right white matter image.
4.5
Normalization
This module spatially normalizes fMRI images into a standard space defined by the template images. The template images supplied with SPM must conform to the space described in the atlas of Talairach and Tournoux. It allows previously estimated spatial normalization parameters (stored in image name “_sn.mat’ files) to be applied to series of realigned functional images [10].
SPM will write spatially normalized images with ‘wrf*.img .
Fig 4: Segmentation result
4.6
Smoothing
Further, the data has been smoothed with Gaussian filter (FWHM 6 mm). This is for smoothing image volumes with a Gaussian kernel of a specified width [10].
1. It improves signal to noise characteristics of the images.
2. It minimizes noise and effects due to residual differences in functional and gyral anatomy during inter-subject averaging.
[image:4.595.60.275.348.640.2]5.
SPECIFICATION RESULTS OF SIRP
WORKING MEMORY FMRI DATA
ANALYSIS
After an fMRI experiment and data preprocessing has been carried out, a statistical analysis of fMRI data was performed. The goal of fMRI analysis is to detect those parts of the brain that were activated by the task stimulus and this can be shown with increased intensity of the pixels in the activation map of the brain when the specific task stimulation was applied.[1,9,10,11] After an fMRI experiment and data preprocessing has been carried out, the resulting data has to be passed out through various analysis steps in order to have an accurate answer to the activations in brain regions[1,9,10,11]. The accuracy of the results depends on the three aspects: the scanning sequence, the paradigm design and the data analysis methods that are used.
The fMRI data analysis has been carried out at two levels one at the single subject level called as 1st level analysis and the
second is at the multisubject level or at the group level analysis or 2nd level analysis [1, 9, 10, 11 ].
There are various methods to analyze the fMRI data. One of the common methods of analyzing fMRI dataset relies on GLM (General Linear Model),a mass–univariate approach which is an excellent tool for finding regions that are engaged and activated during a particular task assignment. GLM cannot identify the functional relationship among the brain regions.
To analyze the fMRI data, the author has used SPM8 (http://www.fil.ion.ucl.ac.uk/spm/).It consists of following steps-
1. Specify the GLM matrix
2. Estimate the GLM parameters using classical (ReML-Restricted Maximum Likelihood) approach
[image:5.595.136.447.297.748.2]3. Produce results in terms statistical parametric maps (SPMs) using contrast vector.
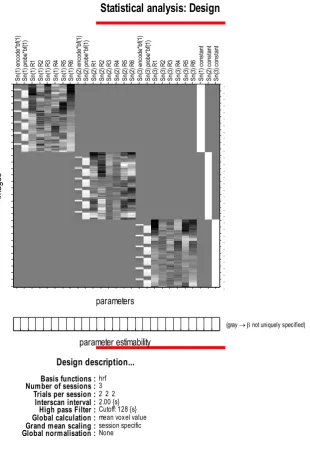
Fig. 5: Design Matrix for Healthy Control
Statistical analysis: Design
parameters im ag es S n( 1) e nc od e* bf (1 ) S n( 1) p ro be *b f(1 ) S n( 1) R 1 S n( 1) R 2 S n( 1) R 3 S n( 1) R 4 S n( 1) R 5 S n( 1) R 6 S n( 2) e nc od e* bf (1 ) S n( 2) p ro be *b f(1 ) S n( 2) R 1 S n( 2) R 2 S n( 2) R 3 S n( 2) R 4 S n( 2) R 5 S n( 2) R 6 S n( 3) e nc od e* bf (1 ) S n( 3) p ro be *b f(1 ) S n( 3) R 1 S n( 3) R 2 S n( 3) R 3 S n( 3) R 4 S n( 3) R 5 S n( 3) R 6 S n( 1) c on st an t S n( 2) c on st an t S n( 3) c on st an t . . . . . . . . . . . . . . . . . . . . . . . . . . . . . . . . parameter estimability
(gray not uniquely specified)
Design description...
Basis functions :hrf
Number of sessions :3
Trials per session :2 2 2
Interscan interval :2.00 {s}
High pass Filter :Cutoff: 128 {s}
Global calculation :mean voxel value
Grand mean scaling :session specific
5.1 Single Subject First Level Analysis
In this step, the authors specify the design and the contrast at the individual single subject level. At this stage, the authors enter all the information about different conditions, onset and duration related to task stimuli for all scans combined across a subject.
5.1.1
Specify the GLM matrix
‘Specify 1st level’ is used for model specification at single subject level. At this step, all the information about the stimulus in terms of condition, onset and its duration has to be mentioned. The output of this step, the design matrix defines the experimental design and the nature of hypothesis testing to be implemented. The design matrix has one row for each scan and there is one column representing each effect or explanatory variable [9].
From figure 5, it is observed that there are two experimental conditions for each session. The last three columns model the average activity in each session. There are 177 fMRI scans for each session. Therefore, the overall design matrix has 531 rows and 27 columns.
5.1.2
Estimating GLM Parameters
After the model has been specified, it must be estimated. Model parameters can be estimated using classical (ReML- Restricted Maximum Likelihood) or Bayesian algorithm. The
authors have used classical approach for model estimation [9].
5.1.3
Produce Results in terms of Statistical
Parametric Maps using contrast vector
After parameter estimation, Statistical Parametric Maps (SPMs) and table of statistics are produced along with by defining contrast.
If subject has different conditions across all sessions, contrasts are entered on an individual subject and session basis. As if the conditions remain same, they are replicated across sessions.
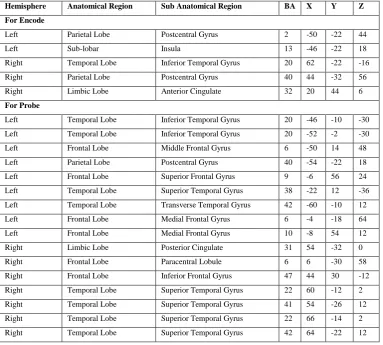
[image:6.595.108.492.392.737.2]In case of SIRP Working memory task there are three sessions containing two conditions encode and probe across all sessions. The two contrasts to be tested are defined using the contrast vector. There are two types of contrasts ‘T’ and ‘F’ contrast. After a T-map, SPM calculates T values for the whole brain. The activated regions while performing working memory task, for both healthy controls and schizophrenic patients can be obtained by passing the x, y, z coordinates to the Talairach client software and the Talairach Client will show Talairach labels for this activated region.Table1 and Table2 illustrates activated regions in healthy control and schizophrenic patients respectively.
Table 1. Activated regions in Healthy control
Hemisphere Anatomical Region Sub Anatomical Region BA X Y Z
For Encode
Left Parietal Lobe Postcentral Gyrus 2 -50 -22 44
Left Sub-lobar Insula 13 -46 -22 18
Right Temporal Lobe Inferior Temporal Gyrus 20 62 -22 -16
Right Parietal Lobe Postcentral Gyrus 40 44 -32 56
Right Limbic Lobe Anterior Cingulate 32 20 44 6
For Probe
Left Temporal Lobe Inferior Temporal Gyrus 20 -46 -10 -30
Left Temporal Lobe Inferior Temporal Gyrus 20 -52 -2 -30
Left Frontal Lobe Middle Frontal Gyrus 6 -50 14 48
Left Parietal Lobe Postcentral Gyrus 40 -54 -22 18
Left Frontal Lobe Superior Frontal Gyrus 9 -6 56 24
Left Temporal Lobe Superior Temporal Gyrus 38 -22 12 -36
Left Temporal Lobe Transverse Temporal Gyrus 42 -60 -10 12
Left Frontal Lobe Medial Frontal Gyrus 6 -4 -18 64
Left Frontal Lobe Medial Frontal Gyrus 10 -8 54 12
Right Limbic Lobe Posterior Cingulate 31 54 -32 0
Right Frontal Lobe Paracentral Lobule 6 6 -30 58
Right Frontal Lobe Inferior Frontal Gyrus 47 44 30 -12
Right Temporal Lobe Superior Temporal Gyrus 22 60 -12 2
Right Temporal Lobe Superior Temporal Gyrus 41 54 -26 12
Right Temporal Lobe Superior Temporal Gyrus 22 66 -14 2
Table2. Activated regions in Schizophrenia patient
Hemisphere Anatomical Region Sub Anatomical Region BA X Y Z For Encode
Left Parietal Lobe Postcentral Gyrus 3 -44 -18 54
Left Frontal Lobe Precentral Gyrus 6 -32 -10 62
Left Limbic Lobe Cingulate Gyrus 24 -6 6 44
Left Frontal Lobe Medial Frontal Gyrus 6 -2 -8 60
Left Parietal Lobe Superior Parietal Lobule 7 -28 -60 42
Right Limbic Lobe Cingulate Gyrus 24 4 2 46
For Probe
Left Frontal Lobe Medial Frontal Gyrus 6 -2 -10 60
Left Frontal Lobe Precentral Gyrus 6 -34 -8 58
Left Frontal Lobe Precentral Gyrus 4 -42 -12 50
Left Parietal Lobe Postcentral Gyrus 3 -42 -24 52
Left Temporal Lobe Transverse Temporal Gyrus 41 -54 -20 14
Right Limbic Lobe Cingulate Gyrus 24 6 0 46
Right Frontal Lobe Superior Frontal Gyrus 10 26 52 -2
Right Frontal Lobe Middle Frontal Gyrus 10 28 66 6
Right Parietal Lobe Inferior Parietal Lobule 40 48 -44 56
Right Frontal Lobe Superior Frontal Gyrus 6 22 -8 66
Right Frontal Lobe Precentral Gyrus 6 34 -8 62
Right Frontal Lobe Superior Frontal Gyrus 8 6 34 44
Right Frontal Lobe Middle Frontal Gyrus 9 44 24 30
Right Parietal Lobe Inferior Parietal Lobule 40 64 -36 22
Right Temporal Lobe Inferior Temporal Gyrus 37 64 -60 -4
Right Parietal Lobe Precuneus 7 16 -68 50
6.
CONCLUSION AND FUTURE SCOPE
The authors conclude that preprocessing is an essential step in fMRI study as it aims at removing movement related artifacts and prepares the fMRI data for next stages of analysis. The choice of event-related design is justified as it is used in situations where one wants to associate brain processes with discrete events as in SIRP working memory task. The authors observed the different regions activated while performing SIRP working memory task in healthy controls and in Schizophrenic patients. Further research could be carried out in comparing the results obtained by creating SPM maps with those obtained by generating PPM(posterior probability maps) as SPM maps is useful in classical inference and the chosen method of authors and PPM maps yields Bayesian inference.
7.
ACKNOWLEDGEMENT
The authors feel a deep sense of gratitude to Prof. V. P. Kshirsagar HOD of Computer Science and Engineering Department for his motivation and support during this work. The authors are also thankful to the Principal, Government College of Engineering, Aurangabad for being a constant source of inspiration.
8.
REFERENCES
[1] S. M. Smith. 2004. Overview of fMRI analysis. The British Journal of Radiology, 77(2004), 167-175.
[2] Viratsinh Vaghela, Chandrshekhar Kesavadas, Bejoy Thomas. 2010. Functional Magnetic Resonance Imaging of the Brain: A Quick Review. Neurology India, Neurological Society of India, 2010, Vol 58, 879-885.
[3] Scott H. Faro, Feroz B. Mohamed. 2010. BOLD fMRI A Guide to Functional Imaging for Neuroscientists. Vol 1, Springer, 2010, .273-279.
[4] Oguz Demircil , Vince D. Calhoun. 2009. Functional Magnetic Resonance Imaging – Implications for Detection of Schizophrenia. Eur Neurol Rev.4 (2)(Dec.2009),103-106.
[5] Lorenz Deserno, Philipp Sterzer, Torsten Wustenberg, Andreas Heinz, Florian Schlagenhauf.2012. Reduced Prefrontal-Parietal Effective Connectivity and Working Memory Deficits in Schizophrenia. The Journal of Neuroscience, (Jan 2012). 32(1), 12-20.
[6] S.G.Potkin, J.A.Turner, G.G.Brown, G. McCarthy, D.N. Greve, G.H.Glover, D.S. Manoach A. Belger,M.Diaz, C.G.Wible, J.M.Ford, D.H.Mathalon,R.Golube, J.Lauriello,D.O’Leary, T.G.M.van Erp A.W.Toga, A. Preda, K.O. Lim, and FBIRN. 2009. Working memory and DLPFC inefficiency in schizophrenia:The FBIRN study. Schizophrenia Bulletin vol.35 no.1, 19-31.
[7] Lancaster JL, Woldorff MG, Parsons LM, Liotti M, Freitas CS, Rainey L, Kochunov PV, Nickerson D, Mikiten SA, Fox PT, ” Automated Talairach Atlas Labels for functional brain mapping”. Human Brain Mapp 10,120-131, 2000.
[8] Lancaster JL , Rainey LH, Summerlin JL, Freitas CS, Fox PT, Evans AC, Toga AW,Mazziotta JC. 1997. Automated Labeling of the human brain: A preliminary report on the development and evaluation of a forward-transform method. Human Brain Mapp 5, 238-242.
[10] John Ashburner, Gareth Barnes, Chun-Chuan Chen, Jean Daunizeau, Guillaume Flandin, Karl Friston, Stefan Kiebel, James Kilner, Vladimir Litvak, Rosalyn Moran, Will Penny, Maria Rosa, Klaas Stephan, Darren Gitelman, Rik Henson, Chloe Hutton, Volkmar Glauche, J_er_emie Mattout,Christophe Phillips. 2013. SPM8 Manual. Functional Imaging Laboratory Welcome Trust
Centre for Neuroimaging Institute of Neurology, UK(Feb 2013).
[11] Mehdi Behroozi, Mohammad Reza Daliri, Huseyin Boyaci. 2011. Statistical Analysis Methods for the fMRI Data. In Basic and Clinical Neuroscience.
[12] Martin A. Lindquist. 2008 The Statistical Analysis of fMRI Data. Statistical Science. Vol. 23 No.4 439-464.