International Journal of Computer Applications (0975 – 8887) Volume 78 – No.9, September 2013
18
‘RGB’ Color Image Quantization using Pollination
based Optimization
Gaganpreet Kaur
Research Scholar1 & Asst.Professor2
1
I.K.Gujral P.T.U, Kapurthala, Punjab
2
SGGSWU, Fatehgarh Sahib, Punjab
Dheerendra Singh,
PhDProfessor & Head SUSCET Tangori Mohali, Punjab
Gurjeet Kaur
StudentDept. of CSE, SGGSWU Fatehgarh Sahib, Punjab
ABSTRACT
Color Image Quantization plays an important rolefor image analysis and visualization. In this paper, RGB color image quantization using pollination based optimization is implemented. The pollination based optimization is applied to RGB color model for image quantization. The Euclidean Distance metric is used for color difference between pixels. Color elimination and reproduction is done by evaluating the Euclidean Distance. Threshold value is taken as the fitness function to calculate the popular and unpopular colors. Color difference calculated using Euclidean Distance and correlate better with visual assessment than color differences calculated using other distance metrics.
In order to evaluate the performance of proposed algorithm, MSE (Mean Square Error), Euclidean Distance, Correlation coefficient, PSNR, Time Taken (in seconds) is used. Experimental results shows that MSE values are significantly reduced and we achieve better PSNR and Correlation coefficient values.
Keywords
Quantization, Segmentation, Optimization, Pollination Based Optimization, Euclidean Distance, RGB color Space
1.
INTRODUCTION
1.1 What is Quantization?
Color image quantization is the process of reducing the number of colors presented in a digital color image so that the new image visually looks same as original image.
Color image quantization is divided into four phases (1)Sampling the original image for color statistics; (2)Choosing a color map based on the color statistics; (3)Mapping original colors to their nearest neighbors in the color map; and
(4) Quantizing and rendering the original image. Color image quantization consists of two major steps:
Creating a color map (or palette) where a small set of colors (typically 8-256 [2]) is chosen from the possible combinations of red, green and blue (RGB).
Mapping each color pixel in the color image to one of the colors in the color map.
The main objective of color image quantization is to map the set of colors in the original color image to a much smaller set of colors in the quantized image [3].
1.2 Pollination Based Optimization
Pollination is a process of transfer of pollen from male parts of flower called anther to the female part called stigma of a flower. Some flowers will develop seeds as a result of self-pollination, when pollen and pistil are from the same plant, often (but not always) from the same flower. Other plants require cross-pollination: pollen and pistil must be from different plants. Plants benefit from pollinators because the movement of pollen allows them to reproduce by setting seeds. However, pollinators don’t know or care that the plant benefits. They pollinate to get nectar and/or pollen from flowers to meet their energy requirements and to produce offspring.
The floral display, fragrance and nectar lure pollinators and leads to pollination. Some species of plants optimize their nectar, display and fragrance producing resources. If pollination process is proceeding smoothly the plants spend average resources. If pollination process is above normal the plants reduce expenditure on resources for producing nectar, floral display and fragrance in the flowers. If the pollination success goes below normal, plants increase the resource expenditure such that more floral display, fragrance and nectar to attract pollinator. As more pollinators and their number of visits increase the pollination success rate increases [6]. The pollination in plants is 6 week programme.
The pollination model used was suggested by Thakar et al. [4] and later modified by Prajakta V. Belsare et. al.[5]. The model suggests that the reproductive success for every plant can be modeled by the following expression:
…. (1)
where
α = variable denoting average display at a given average nectar content. (α = optimum D = 1.2)
A = Average Investment in Nectar Content of a species (A= optimum N = 0.9. its range is 0.8 - 1.4) D = individual investment in display (0 - 1.2 typical 1.2)
N = individual investment in nectar (0.8 - 1.5 typical 1.2 at A = 0.9)
P = parameter related to pollinators learning efficiency P = m × α + c here m and c are constants. (Range 0.1 - 25 typical value 2)
C = proportionality constant relating investment to reproductive cost
The model suggested by Thakar et al. [4] and later modified by Kumar. S., et al. [6] is applied by modifying as in our problem.
1.3 RGB Color Space
19 generate any color within the RGB Color cube, all three RGB
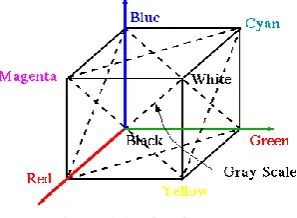
components need to be of equal pixel depth and display resolution. For any modification of the image requires modification of all three planes. Black color is the resultant of zero intensity for each component and full intensity for each component gives white. When the intensities for all the components are the same, the result is a shade of gray, darker or lighter depending on the intensity. When the intensities are different, the result is a colorized hue, more or less saturated depending on the difference of the strongest and weakest of the intensities of the primary colors employed.
In the RGB model, an image consists of three independent image planes, one for each of the primary colors: red, green and blue. Specifying particular colors is by specifying the amount of each of the primary components present. Geometry of the RGB color model for specifying colors can be shown using a Cartesian coordinate system. The gray scale spectrum, i.e. those colors made from equal amounts of each primary, lies on the line joining the black and white vertices.
[image:2.595.85.234.285.394.2]Figure 1.1 RGB Color Model
1.4 Euclidean Distance
The image metrics, Euclidean distance is the most commonly used due to its simplicity. The advantages of this metric are: 1. Relative insensitivity to small perturbation
(Deformation)
2. Simplicity of computation
3. It can be efficiently embedded in most of the powerful image recognition techniques. For two colors of respective RGB components (R1, G1, B1) and (R2, G2, B2),
∆E= (2)
2.
PROPOSED METHODOLOGY &
IMPLEMENTATION
Pollination Based Optimization is a population oriented algorithm used to search optimal solution. In this research each pixel of the image is considered as plant. The aim of the proposed algorithm is to minimize the food sources i.e. to reduce the number of colors in the image. All the pixels initially have some color and the purpose of this research is to optimize the number of colors in the image. All the colors in the image are evaluated as the number of pixels having that color. This evaluation defines the threshold value of all the colors present in the image. Depending upon the threshold value of the colors, all the colors in the image are divided into two categories popular colors and unpopular colors. If the threshold value of the color is high i.e. the color is present on too many pixels then that color is considered as popular color and all other colors whose threshold value is poor are considered unpopular colors.
All the pixels in the image are compared with every other pixel in the image to find the most similar color to be eliminated. Euclidean distance is used to find out the distance between two pixels. Based on the value of Euclidean distance between similar colors elimination of one of the colors is done. PBO has been implemented and validated on by applying the algorithm on images.
2.2 Algorithm Level Design
The RGB pixels to be calculated are placed in an array and unique rows that have the same color pixels are calculated. Each dataset item has different color values and depending upon different values chooses a threshold value. This value selects the popular colors. After this, pollination based algorithm is applied on the test images. By using this we calculate reproductive success R. Then for each pixel calculate the error by subtracting reproductive success from weekly goal. If the error lies between the desired ranges then calculate the popular colors and evaluate the color map of selected popular colors else we have to approximate the unpopular colors to the nearest color map.
The overall procedure of the proposed algorithm can be described as follows:
Step 1: Read an image from chosen images.
Step 2: Separate the Red, Green and Blue components of the image in order to find out the intensity values of each component from which a particular color originates
Step 3: For all pixel locations. Place the RGB pixel values in an array and calculate unique rows as they result in unique colors available in the image.
Step 4: Choose a threshold value in order to limit the choice of popular and unpopular colors.
Step 5: Apply pollination based optimization Initialize the parameters as:
P= number of plants (i.e. number of pixels) W= number of weeks=6
S= number of seasons (number of iterations (10)) A= average nectar content
D= individual displacement N= individual investment in nectar
α = variable denoting average display at a given average nectar content
P = parameter related to pollinators learning efficiency P = m × α + c here m and c are constants. (Range 0.1 - 25 typical value 2)
Evaluate R using equation (1), where R is reproductive success
Pollination weekly goal= [0.10, 0.25, 0.50, 0.75, 0.90, 1.00] For each pixel do
Evaluate error, E= goal-R If error>-0.25 && <0.25
Calculate popular colors End if
Step 6: Evaluate color map of selected popular colors in Step (5)
Step 7: Approximate the unpopular colors to nearest value available in color map which has been developed from threshold performance meter.
International Journal of Computer Applications (0975 – 8887) Volume 78 – No.9, September 2013
20
3.
RESULTS
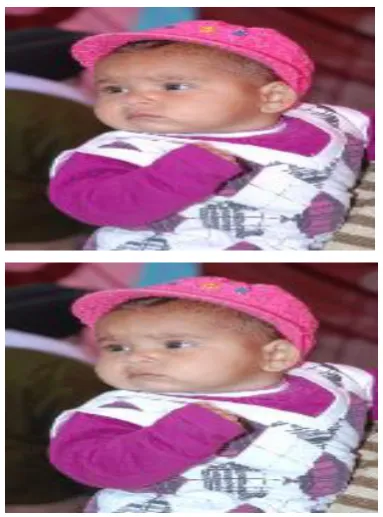
[image:3.595.328.531.70.268.2]RGB color image quantization using Pollination Based Optimization has been validated by applying the algorithm on images. The following figures (Fig 1 to 4) show original input image with original number of colors and resulting image with quantized colors. Fig 5 and Fig 6 show the histograms obtained for red, green and blue components.
Fig 1: Original Image “Fish.jpg’’ with 11883 Colors on top and Quantized Image “Fish.jpg” with 8574 Colors on bottom
Fig 2:Original Image “Baby.jpg’’ with 118199 Colors on top and Quantized Image “Baby.jpg” with 105344 Colors
on bottom
Fig 3:Original Image “Flower.jpg’’ with 72346 Colors on top and Quantized Image “Flower.jpg” with 56817 Colors
[image:3.595.64.270.188.383.2]on bottom
Fig 4: Original Image “Beetel.jpg’’ with 82901 Colors on top and Quantized Image “Beetel.jpg” with 74147 Colors
[image:3.595.329.529.309.739.2]on bottom
[image:3.595.335.525.314.540.2] [image:3.595.65.257.417.676.2]21
Fig 6: Show the histogram for, G, B components for
Baby.jpg
From the above results, it can be found that uniformity is there in the output image. There is no degradation in the image quality. The processed image is visually similar to the input image. The performance of proposed algorithm is evaluated based on MSE, PSNR, and Euclidean distance for images, Normalized Mean Square Error and Correlation coefficient.
In this paper, pollination based optimization technique has been successfully used and tested. Experimental results show the feasibility of the approach in quantization. With suitable values, the proposed algorithm was able to successfully quantize the images. The proposed algorithm works correctly upon the large size of images and quantizes them that look visually same as the original image. In order to verify results MSE is taken as measure.
Results show that the proposed algorithm reduces more color and hence gives better results in terms of PSNR, Euclidean distance, Correlation coefficient.
[image:4.595.58.545.409.536.2]In the proposed algorithm each pixel has to been taken and RGB color model is used. So, further research may focus on some modification of the proposed algorithm to enhance the speed. Further research work may focus on developing some new algorithms i.e. algorithm combination of two other swarm intelligence techniques to improve results and to decrease time during global optimization. Future research may also try to apply the proposed technique to other color spaces.
Table 1. Computational Results: Total no. of colors, Colors after Quantization, Euclidean Distance, Correlation coefficient, NMSE_Red, NMSE_Green, NMSE_Blue.
Image Taken Total no. of colors
Colors After Quantization
Euclidean Distance
Correlation coefficient
NMSE_Red NMSE_Green NMSE_Blue
Fish.jpg 11883 8574 336.70 0.99 0.0289 0.0203 0.0192
Baby. jpg 118199 105344 215.98 0.99 0.0243 0.0387 0.0224
Flower. jpg 72346 56817 361.93 0.99 0.0312 0.0437 0.0365
Beetel. jpg 82901 74147 246.50 0.99 0.0332 0.0478 0.0523
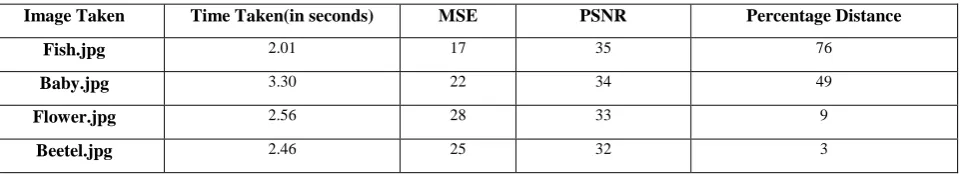
Table 2. Results show quality of measures with Total Time taken by the system.
Image Taken Time Taken(in seconds) MSE PSNR Percentage Distance
Fish.jpg 2.01 17 35 76
Baby.jpg 3.30 22 34 49
Flower.jpg 2.56 28 33 9
Beetel.jpg 2.46 25 32 3
5. REFERENCES
[1] P. Heckbert, “Color Image Quantization for Frame Buffer Display”, ACM Computer Graphics, Vol. 16, No. 3, pp. 297–307, 1982.
[2] Scheunders P,"A genetic C-means clustering algorithm applied to color image quantization”, Pattern Recognition30 (6), pp. 859-866, 1997.
[3] Xiang Z, Joy G, “Color image quantization by agglomerative clustering”, IEEE Computer Graphics and Applications 14(3), pp. 44-48, 1994.
[image:4.595.62.543.574.661.2]International Journal of Computer Applications (0975 – 8887) Volume 78 – No.9, September 2013
22 [5] Prajakta V., et al., “The co-optimization of floral
display and nectar reward”, Journal of Biosciences, Vol No. 34(6), pp 1-5, 2009.
[6] Kumar, S., Singh, A., “Pollination based optimization,” Presented at 6th
International Multi Conference on Intelligent Systems, Sustainable, New and Renewable Energy Technology and Nanotechnology IISN2012, pp. 269-273, 2012.
[7] Velho, L., Gomes J., Sobrerio, M., “Color image quantization using pairwise clustering”, Proceedings of the 10th Brazilian Symposium on Computer Graphics and Image Processing, pp.203-207.
[8] Kaur, G and Singh, D. “Pollination Based Optimization For Color Image Segmentation”, International Journal Of Computer Engineering & Technology, pp. 407-414, Volume 3, Issue 2, July- September, 2012.
[9] Rui X, Chang C, Srikanthan T., “On the initialization and training methods for Kohonen self-organising feature maps in color image quantization”, ,Proceedings of the 1st IEEE International Workshop On Electronic Design ,Test and Applications,2002.
[10] Dekker A., “Kohonen neural networks for optimal color quantization”, Network: Computation in Neural Systems 5, pp.351-367, 1994.
[11] Kaur, Rajinder et al., “Color Image Quantization based on Bacteria Foraging Optimization ", International Journal of Computer Applications, pp. 975 – 979, Volume 25, Issue 7, July 2011.
[12] Orchard, M. and Bouman, C., “Color Quantization of Images,” IEEE Trans. on Sig. Proc., pp. 2677-2690. Volume 39, Issue 12, Dec. 1997.
[13] Sadegi, Z., Teshnehlab, M. and Pedram, M., “K-Ants Clustering – A New Strategy Based On Ant Clustering,” proceedings of 2nd
York doctoral symposium on computing ,university of York, UK,2008.
[14] Velho, L. “Color Image Quantization by Pairwise Clustering”, IMPA–Instituto de Matematica Pura e Aplicada, Estrada Dona Castorina, 2010.
[15] Wang, Z., Wu, G. , Yang.E and Bovik, A.C., “Quality-aware images,” IEEE Transactions on Image Processing, vol. 15, pp. 1680-1689, 2006.
[16] Omran, M.G. ,Engelbrecht A.P. and Salman ,A. “A Color Image Quantization Algorithm Based on Particle Swarm Optimization,” Informatica 29(2005)261-269.
[17] Pujol, A. and Liming, Chen., “Color Quantization for image processing using self information”, 6th
IEEE International Conference on Information, Communication and signal processing, 2007.
[18] Bansal, S. Aggarwal, D., “Color Image Segmentation using CIELab Color Space using Ant Colony Optimization”, International Journal of Computer Applications, pp. 28-34, 2011.
[19] Chang, Y., Liang, D. “A Robust Color Image Quantization Algorithm Based on Knowledge Reuse of K-Means Clustering Ensemble”, Journal of Multimedia, 2000.
[20] Heena and Aggarwal, H., “Color Image Quantization Based on Euclidean Distance Using Bacteria Foraging Optimization,” International Journal of Electronics and Computer Science Engineering, ISSN 2277-1956/V1N4-2285-2290
[21] Jiang, Y., Wang, Y. and Jin, L., “Investigation on Color Quantization Algorithm of Color Image,” ECWAC 2011, Part II, CCIS 144, pp. 181–187, Springer-Verlag Berlin Heidelberg 2011.
[22] Jain, A.k, Murty, M.N and Flynn, P.J “Data Clustering: A Review”, ACM Computing Surveys, Vol.31 (3), pp. 264-323, 1999.
[23] Jaffer, Mohammad, A., O., and R. Shiva Kumar, “Ant Based Clustering Algorithm: A brief Survey”, International Journal of computer Theory and Engineering, Volume 2, No. 5, pp. 1793-8201.
[24] Jang et.al, “Neuro-Fuzzy and Soft Computing, A Computational Approach to Learning and Machine Intelligence”, Prentice Hall of India, 2004.
[25] Kumar, D. and Chopra, V., “Image Quantization Using HSI Based On Bacteria Foraging Optimization”, International Journal of Information Technology and Knowledge Management, pp. 335-343, Volume 5, Issue. 2, 2012.
[26] Xin, L. and Xaisoqi, L., “Multiple Digital Watermarking Algorithm to protect Digital images based on integer wavelet matrix norm quantization”, pp 569-571, IEEE, 2009.
[27]Yarde, P. and Gupta, N., “Survey of Color Image Quantization Algorithms Based on Swarm Intelligence” International Journal of Systems, Algorithms & Applications, Volume 2, Issue ICASE 2012, August 2012, ISSN Online: 2277-2677.
[28] Zhang, M. and Bermak, A., “Architecture of a Digital Pixel Sensor Array with Tile-based Vector Quantization Image Compression Algorithm”, Digital Image Computing Techniques and Applications, 9th Biennial Conference of the Australian Pattern Recognition Society, IEEE, pp. 541-546, 2007.