Network Anomaly Detection using PSO-ANN
ABSTRACT
In this work, the continue from the last research work done [20], thus it is proposed a data mining based anomaly detection system, aiming to detect volume anomalies, using Simple Network Management Protocol (SNMP) monitoring. The method is novel in terms of combining the use of Digital Signature of Network Segment (DSNS) with the evolutionary technique called Particle Swarm Optimization (PSO)[5] and neural network training, applied in a real data set. PSO is a high efficient heuristic technique with low computational complexity, developed in 1995 by Kennedy and Eberhart [1] inspired by social behavior of bird flocking. The DSNS is a baseline that consists of different normal behavior profiles to a specific network device or segment, generated by the GBA tool (Automatic Backbone Management), using data collected from SNMP objects. The proposed anomaly detection system uses the SVM in order to clusterize the traffic collected by SNMP agents and its respective DSNS. The PSO is combined with the SVM in order to improve performance and quality of the solution in the clusterization and calculation of clusters centroids. Tests were carried out using a real network environment in the Techno India University, Kolkata. Numerical results have been shown that the obtained detection and false alarm rates are promising. It is also implemented the deterministic method proposed in order to detect anomalies on the same dataset, so that both methods could be compared.
Keywords
Artificial Neural Network, Back Propagation, Intrusion Detection and Prevention, Network Attack.
1. INTRODUCTION
With the rapid proliferation of computer networks during the past decade, security has become a crucial issue for computer systems. Different soft computing based methods have been proposed in recent years for the development of intrusion detection systems. However due to the vulnerabilities of the networks towards attacks and to keep the sensitive data safe from attacks, detection is not enough, rather its have to prevent them. In this paper, present an artificial neural network based model of Intrusion Detection and Notification System (IDNS), which not only detects different network attacks but also notified to prevent them from being forwarded. These networks are vulnerable to security breach due to wireless communication and lack of infrastructure. In sinkhole attacks, an attacker attracts network traffic by forging or replaying routing messages through compromised nodes. Thus attracted traffic is used for selective forwarding, denial of service (DoS) and false report attacks. Adapting various sensor devices to communicate within sensor networks empowers us by providing range of possibilities. The sensors in sensor networks need to know their measurable belief of trust for efficient and safe communication. In this paper it is proposed the intrusion detection scheme using fuzzy logic for detecting and defending sinkhole and different attacks in sensor networks. Thus present an anomaly detection
method using Digital Signature of Network Segment (DSNS) and Particle Swarm Optimization-based clustering (PSO-Cl). The PSO algorithm is an evolutionary computation technique whose main characteristics include low computational complexity, ability to escape from local optima, and small number of input parameters dependence, when compared to other evolutionary algorithms, e.g. genetic algorithms (GA).
2. LITERATURE REVIEW
2.1. Artificial Intelligence
A precise definition of intelligence is unavailable. It is probably explained best by discussing some of the aspects. In general, intelligence has something to do with the process of knowledge and thinking, also called cognition. These mental processes are needed for, i.e., solving a mathematical problem or playing a game of chess. One needs to possess a certain intelligence to be able to do these tasks. Not only the deliberate thought processes are part of cognition, also the unconscious processes like perceiving and recognizing an object belong to it.
2.2. Particle swarm optimization (PSO)
Particle swarm optimization (PSO) [1] [2] [17] is a stochastically global optimization method that belongs to the family of Swarm Intelligence [14] and Artificial Life. Similar to artificial neural network (ANN) and Genetic Algorithms (GA) [7][8] which is the simplified models of the neural system & the natural selections of the evolutionary theory, PSO is based on the principles that flock of birds, school of fish, or swarm of bees searches for food sources where at the beginning the perfect location is not known. However, they eventually they reach the best location of food source by means of communicating with each other.
2.3. Artificial Neural Network (ANN)
An Artificial Neural Network, often just called a neural network, is a mathematical model inspired by biological neural networks. A neural network consists of an interconnected group of artificial neurons, and it processes information using a connectionist approach to computation. In most cases a neural network is an adaptive system that changes its structure during a learning phase. Neural networks are used to model complex relationships between inputs and outputs or to find patterns in data.
2.4. An Introduction to Z-Number
In the real world, uncertainty is a pervasive phenomenon. Much of the information on which decision are based is uncertain. Humans have a remarkable capability to make rational decisions based on information which is uncertain, imprecise and/or incomplete. Formalization of this capability, at least to some degree, is a challenge that is hard to meet. The notion Z-number introduced by Zadeh in 2011 has more capability to describe the uncertain information. Zadeh proposed a notion, namely Z number, which is an order pair
Diptam Dutta
Computer Science & Engineering Heritage Institute of Technology
Kaustav Choudhury
of fuzzy numbers (A, B). The first component, A, plays the role of a fuzzy restriction. And the second component B is a reliability of the first component.
2.4.1. Definition
A Z-number is an ordered pair of fuzzy numbers denoted as Z = (À; Ř). The first component À, a restriction on the values, is a real-valued uncertain variable X. The second component Ř is a measure of reliability for the first component.
2.5. Network Intrusion Detection
Intrusion Detection is a problem of identifying unauthorized [3][4]users in a computer system. It is also defined as the problem of protecting computer network systems from being compromised. The first published renowned literature on computer network security is where Denning discussed various security concerns, presented a definition of Intrusion Detection and discussed different types of Intrusion Detection.
2.6. Artificial Immune Systems (AISs)
Artificial Immune Systems (AISs) have been extensively researched in the last decade, mainly for anomaly detection. Much research has been conducted on using negative selection, as that model lends itself conveniently to anomaly detection. However, within a decade of the proposition of negative selection, several researchers came to the conclusion that the model has problems with scalability, limiting its application to real problems. Consequently, some researchers considered alternative models, whilst others have, in recent years, proposed enhancements to negative selection to address scalability. For a complimentary review of AISs applied to intrusion detection, and reviews by Dasgupta et al and Timmis [21] for a general treatment of AIS.
3. PROPOSED MODEL
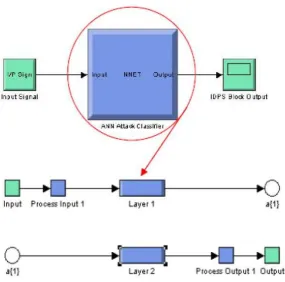
The designed a two layer feed forward Artificial Neural Network (ANN) with sigmoid hidden and output neurons. The hidden layer contains 12 neurons and output layer contains 6 neurons. Thus the test was conducted a machine learning using the Neural Network Pattern Recognition Tool of
MATLAB 7.11.0.584 (R2010b) to train the neural network by using back propagation scaled particle swarm optimization based conjugate gradient training algorithm obtained a mean squared error of about 10-2 and best validation performance of 0.021587 at epoch 33 for the dataset . After training the ANN generate the basic Simulink model of the neural network based attack classifier.
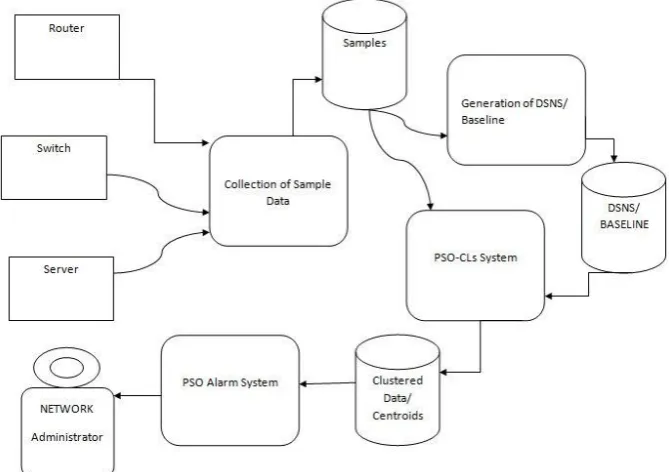
The elements of the proposed network anomaly detection system can be seen in Figure 1. The GBA tool is responsible for the collection of real traffic samples and generation of the DSNS. The PSO-Cls system calculates the cluster [6] centroids from real traffic and DSNS. Then, the PSO Alarm system can analyze the distance between cluster centroids and real traffic samples[9], aiming to find the existence of anomalies. The process for anomaly detection of the proposed system is divided into two stages, as follow:
The PSO-Cls system groups‟ traffic data is collected[15] from SNMP objects and their respective DSNS every 300 seconds, which are analyzed individually. Firstly, traffic data and DSNS from each 300-seconds interval are clustered simultaneously. Then, a centroid for each cluster found is calculated, which represents the expected behavior for the traffic samples of the cluster [10]. The pseudo code used for clustering data and calculate the centroids can be seen in Algorithm. The clustered data and clusters centroids generated in this stage are used in the next step.
[image:2.595.131.466.489.725.2]The PSO Alarm system is responsible for analyzing the results generated by the previous step, verifying if there were anomalies in the analyzed interval. The PSO Alarm system checks how close each sample of traffic movement is from their corresponding cluster centroid [13]. The distance measure adopted in this work is the Euclidean distance, which consists of the straight line distance between two points. A sample is considered anomalous if the Euclidian distance between it and their respective cluster centroid, exceeds a threshold value λ. Then, PSO Alarm system triggers an alarm to notify the network administrator.
3.1. Dataset Description
Tests were carried out using a real network environment using 4 laptop PC’s. Numerical results have been shown that the obtained detection and false alarm rates are promising. Thus implemented the deterministic method proposed in order to detect anomalies on the same dataset, so that both methods could be compared.
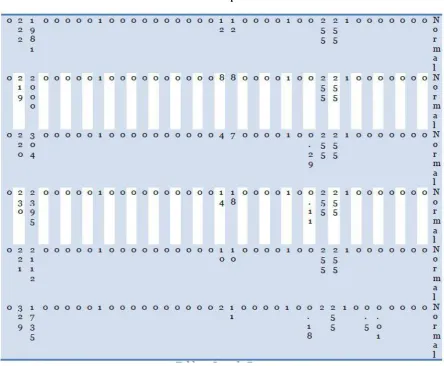
3.2. Sample Dataset
Sample Data from the Original Data Set is given below
3.3. Proposed Algorithm 3.3.1 Updating Functions
Input:
m: the swarm size.
c1 , c2 : positive acceleration constants. w: inertia weight. MaxGen: maximum generation.
MaxFit: _tness threshold.
Output: Global best position (best features of NSL-KDD dataset)
1: Initialize a population of particles with random positions and velocities on d=1,...,41 NSL-KDD features dimensions pbesti=0, Gbest=0, Iter=0.
2: while Iter < MaxGen or gbest < MaxFit do 3: for i = 1 to number of particles m do 4: Fitness (i)=Evaluate(i)
5: if Fitness(i) > Fitness (pbesti) then 6: Fitness (pbesti)= Fitness(i) 7: Update pid = xid
8: end if
9: if Fitness(i) > Gbest then
10: Gbest=Fitness(i) 11: Update gbest = i 12: end if
13: for each dimension d do 14: Update the velocity vector. 15: Update the particle position. 16: end for
17: end for 18: Iter= Iter+1 19: end while
20: Return the Global best position.
3.3.2. Functions PSO- CLs System
Input:real traffic, DSNS
Output:clustered traffic and DSNS, cluster centroids. 1. Input data are clustered randomly
2. Population is initialized uniformly distributed in U[Pmin; Pmax]
[image:3.595.66.511.164.530.2]3. For n = 1 to N 4. For i = 1 to M
5. //velocity calculation vi[n+ 1] = ω · vi[n] + φ1 ·Ui1 [n](pbest i − pi[n]) + φ2 · Ui2 [n](pbest g − pi[n])
6. //speed bounds vi[n] =min{Vm; max{−Vm; vi[n]}} 7. //update the position pi[n+ 1] = pi[n] + vi[n+ 1], i= 1, . . . , M
8. If pi ∈ [Pmin; Pmax] Calculate the fitness value of pi and Update pbest i and pbest g endIf endFor i
9. //K-means reclustering Input data is reassigned to clusters according to the nearest euclidean distance Stop if N has been reached endFor n
10. pbest g determines the cluster Centroids 11. End Function
3.3.3. PSO Alarm
FunctionPSO Alarm system
Input:clustered traffic and DSNS, cluster centroids. Output:detected anomalies
X = clustered traffic and DSNS Z = cluster centroids
For each sample x of X
If D(x, Z) < λ x is normal Else
x is an anomaly, triggers an alarm endIf
endFor End Function
D = Euclidean distance, λ = maximum distance threshold
3.4 Overview of Simulink Model
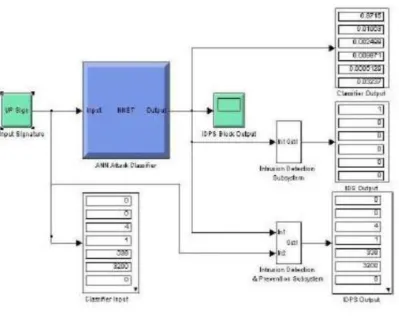
[image:4.595.168.437.302.400.2]Simulink is an environment for multi-domain simulation and Model-Based Design for dynamic and embedded systems. It provides an interactive graphical environment and a customizable set of block libraries that allows to design, simulate, implement, and test a variety of time varying systems, including communication, control, signal processing, video processing, image processing etc. . Here the input signature consists of the 100 attributes of the dataset and the IDPS block output is the classified attack or normal.
Figure 2: neural network Simulink model
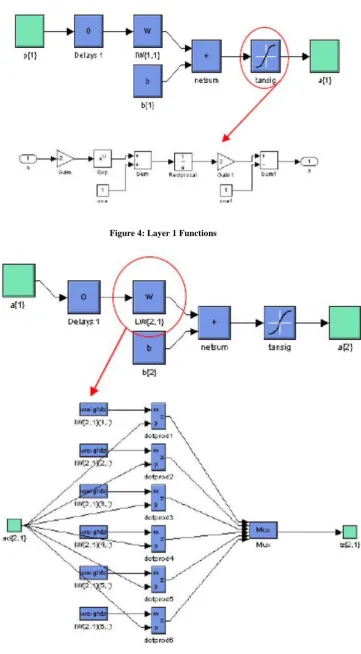
[image:4.595.158.444.445.727.2]Figure 4: Layer 1 Functions
Figure 6: Simulink Model for Showing IDPS System blocking DoS attack
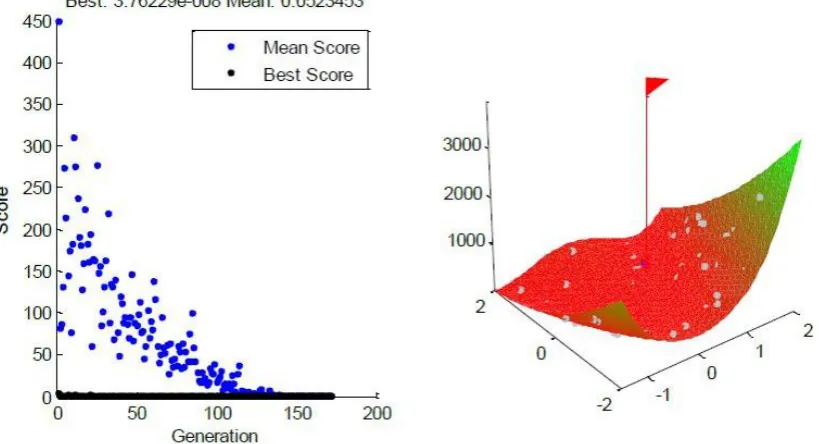
[image:6.595.105.505.408.724.2]4. PERFORMANCE ANALYSIS
Thus the performance found satisfactory, as the data had tested the system taking 25% of the data from the dataset.Figure 8: Region Detect of possible network anomalies
Figure 9: Detection of Neurons Infected
5. CONCLUSION
In this work designed an ANN based IDPS using MATLAB 7.11.0.584 (R2010b) and Simulink. The result of the tests is very encouraging. The further objective is to implement the designed model on FPGA (Spartan 3E). This implementation aims to contribute in hardware integration solutions in the areas of monitoring, diagnosis and management of network intrusions. Since the Simulink library provided by Xilinx, has all the blocks that are necessary for the design of
[image:7.595.91.501.395.617.2]6. REFERENCES
[1] A. Kind, M. P. Stoecklin, and X. Dimitropoulos, “Histogram-based traffic anomaly detection,” in IEEE Transactions on Network Service Management, vol. 6, no. 2, June 2009.
[2] B. B. Zarpel˜ao, L. S. Mendes, M. L. Proenc¸a Jr., and J. J. P. C. Rodrigues, “Parameterized anomaly detection system with automatic configuration,” in GC’09 CSS. 2009 IEEE Global Communications Conference (IEEE GLOBECOM 2009), Communications Software and Services Symposium, 2009.
[3] A. Patcha and J. M. Park, “An overview of anomaly detection techniques: Existing solutions and latest technological trends,” Computer Networks: The International Journal of Computer and Telecommunications Networking, 2007.
[4] M. L. Proenc¸a Jr., C. Coppelmans, M. Botolli, and L. S. Mendes, Security and reliability in information systems and networks: Baseline to help with network management. Springer, 2006, pp. 149–157.
[5] J. Kennedy and R. Eberhart, “Particle swarm optimization,” in IEEE International Conference on Neural Networks, 1995, pp. 1942–1948.
[6] J. B. MacQueen, “Some methods for classification and analysis of multivariate observations,” in Proceedings of the Fifth Berkeley Symposium on Mathematical Statistics and Probability, 1967, pp. 281–297.
[7] Y. ling Zhang, Z. guo Han, and J. xia Ren, “A network anomaly detection method based on relative entropy theory,” in Proceedings of the 2009 Second International Symposium on Electronic Commerce and Security, 2009, pp. 231 – 235.
[8] L. Kuang and M. Zulkernine, “An anomaly intrusion detection method using the csi-knn algorithm,” in Proceedings of the 2008 ACM symposium on Applied computing, 2008, pp. 921 – 926.
[9] L. He, S. Yu, and M. Li, “Anomaly detection based on available bandwidth estimation,” in Proceedings of the 2008 IFIP International Conference on Network and Parallel Computing, 2008, pp. 176 – 183
[10] R. Ensafi, S. Dehghanzadeh, R. Mohammad, and T. Akbarzadeh, “Optimizing fuzzy k-means for network anomaly detection using pso,” in AICCSA 2008.
IEEE/ACS International Conference on Computer Systems and Applications, Apr. 2008, pp. 686 – 693. [11] KDD Cup 1999 Data. Available at
http://kdd.ics.uci.edu/databases/kddcup99/kddcup99. html.
[12] R. Ma, Y. Liu, X. Lin, and Z.Wang, “Network anomaly detection using rbf neural network with hybrid qpso,” in IEEE International Conference on Networking, Sensing and Control, Apr. 2008, pp. 1284 – 1287.
[13] L. Xiao, Z. Shao, and G. Liu, “K-means algorithm based on particle swarm optimization algorithm for anomaly intrusion detection,” in WCICA 2006 . The Sixth World Congress on Intelligent Control and Automation, 2006, pp. 5854 – 5858.
[14] N. Nedjah and L. M. Mourelle, Swarm Intelligent Systems. Springer- Verlag Berlin Heidelberg: Springer, 2006.
[15] Y. Shi and R. C. Eberhart, “Parameter selection in particle swarm optimization,” in 1998 Annual Conference on Evolutionary Programming, San Diego, USA, March 1998.
[16] S. Axelsson, “The base-rate fallacy and the difficulty of intrusion detection,” in ACM Transactions on Information and Systems Security 3, vol. 1, May 2000, pp. 186 – 205.
[17] Kennedy, J.; Eberhart, R. (1995). "Particle Swarm Optimization". Proceedings of IEEE International Conference on Neural Networks.
[18] Kennedy, J.; Eberhart, R.C. (2001). Swarm Intelligence. Morgan Kaufmann.
[19] Poli, R. (2008). "Analysis of the publications on the applications of particle swarm optimisation". Journal of Artificial Evolution and Applications 2008.
[20] Argha Roy, Diptam Dutta, Kaustav Choudhury. “Training Artificial Neural Network using Particle Swarm Optimization Algorithm”, International Journal of Advanced Research in Computer Science and Software Engineering, Volume 3, Issue 3, March-2013.