http://dx.doi.org/10.4236/jmp.2015.611151
Scalable Cavity Quantum Electrodynamics
System for Quantum Computing
Mohammad Hasan Aram, Sina Khorasani
Department of Electrical Engineering, Sharif University of Technology, Tehran, Iran Email: [email protected]
Received 18 August 2015; accepted 12 September 2015; published 15 September 2015
Copyright © 2015 by authors and Scientific Research Publishing Inc.
This work is licensed under the Creative Commons Attribution International License (CC BY).
http://creativecommons.org/licenses/by/4.0/
Abstract
We introduce a new scalable cavity quantum electrodynamics platform which can be used for quantum computing. This system is composed of coupled photonic crystal (PC) cavities which their modes lie on a Dirac cone in the whole super crystal band structure. Quantum information is stored in quantum dots that are positioned inside the cavities. We show if there is just one quan-tum dot in the system, energy as photon is exchanged between the quanquan-tum dot and the Dirac modes sinusoidally. Meanwhile the quantum dot becomes entangled with Dirac modes. If we in-sert more quantum dots into the system, they also become entangled with each other.
Keywords
Cavity Quantum Electro Dynamics, Photonic Crystal, Dirac Cone, Quantum Computing
1. Introduction
After about seventy years from Purcell’s famous paper [1] which established cavity quantum electrodynamics (CQED), this field is still active and interesting for many researchers [2]. This is primarily due to a concept called coupling constant. It is a criterion to measure the strength of atom-cavity interaction. Atom interacts with cavity through exchange of energy quanta or photon. The stronger this interaction is, the faster the exchange of photon occurs. So we can say coupling constant measures the rate of photon exchange between atom and cavity.
we can create entangled state of them. To measure this rate we need a criterion, that is, we have to compare it with an amount to determine if it is high or not. There are three criteria as follows:
1) Presence duration of atom inside the cavity. In some cavity quantum electrodynamics systems atoms stay inside the cavity for a short period of time. In these systems atoms enter the cavity from an aperture and after interaction exit from the other side. If energy exchange occurs in a period of time longer than atom presence duration (Te), then the coupling constant is small and we say the coupling is weak.
2) Photon decay rate. We know there is no lossless cavity. This loss has many causes among them we can mention leakage through cavity walls and cavity walls absorption. If we show photon annihilation rate by ξ, photon exchange rate must be larger than ξ to have strong coupling.
3) Atom spontaneous emission rate. Another factor to be considered for measuring coupling strength is the time interval that atom can maintain photon before radiating it to vacuum modes outside the cavity via spontaneous emission. Spontaneous emission rate is shown by γ. So to have strong coupling we need photon exchange rate to be much larger than γ.
The photon exchange rate between atom and cavity (coupling constant) is measured by Rabi frequency (g). So the last paragraph can be summarized as: If g
(
ξ γ, ,1Te)
, then the atom-cavity system is in the strong coupling regime. Otherwise the coupling is weak. In many systems like the one analyzed here, quantum dots are used instead of real atoms or ions. Since quantum dots are always inside the cavity, we can assume Te ∞. Hence in these systems we just need to compare g with γ and ξ to determine the coupling strength. Usually photon decay rate is greater than atom spontaneous emission rate [3], so it is usually sufficient to compare gwith ξ.
In strong coupling regime different phenomena occur. Among them is vacuum Rabi splitting in which upper atomic energy level splits into two close levels which result in two peaks in spontaneous emission spectrum of the atom that had only one otherwise [4].
Many reports of strong coupling attainment have been presented till now [5]-[11]. But in recent years some groups are trying to go beyond strong coupling and reach ultra-strong coupling regime [12]-[14]. In this regime Rabi frequency is comparable with photon frequency. It is predicted atom behaves chaotically in this regime [15].
CQED has many applications, but its capability to be used as a platform for quantum computing is much more attractive. Up to now different systems have been proposed to be used for quantum computing [16]-[21]. All of these systems have some limitations and shortcomings. One of their serous limitations is their hard scalability. In most of these systems we can have only a few numbers of qubits. Here we propose a new system which does not have this limitation and can be used as an alternative for the old CQED systems in quantum computation. This system is composed of coupled photonic crystal resonators array (CPCRA) where each resonator is a cavity that can contain a quantum dot. The cavities are arranged such that a Dirac cone appears in the super crystal band structure.
In the remaining we first show how we can obtain Dirac cone by choosing appropriate position for the cavities, next we obtain Hamiltonian of the system that makes study of atom evolution due to interaction with Dirac cone modes possible.
2. Dirac Cone Modes
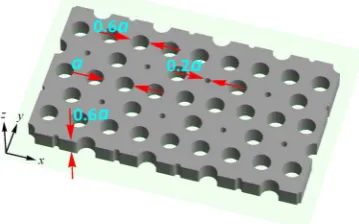
In one of our previous works we showed how we can design a photonic crystal that has Dirac point in its transverse electric (TE) band structure [22]. In this section we review it briefly. At first we designed a two dimensional (2D) crystal with Dirac point. We adopted the crystal lattice from graphene which has a honey comb lattice and Dirac point has already been observed in its band structure. So we chose a triangular lattice of air holes in a dielectric for the basis crystal and replaced Carbon atoms by cavities. Different patterns for cavities positions were tested to finally reach the pattern shown in Figure 1. We assumed the crystal to be made of Silicon with relative permittivity of ε =r 11.9. Next we generalized our design to a photonic crystal slab. We used different methods to show Dirac point in its band structure but here we just explain tight-binding because we need it in subsequent sections.
To utilize tight-binding method we should first obtain modes of a single cavity. Each of the designed cavities has two orthogonal degenerate modes that are shown in Figure 2. If we represent the electric fields of these modes at resonant frequency ν, by Eν,l,
(
l=1, 2)
, then according to Maxwell’s first and second equations weFigure 1. Photonic crystal slab with Dirac point in band structure. Crystal dielectric is Silicon
with εr= 11.9.
Figure 2. Field distribution of (a) ℑ
{ }
Hz of first mode; (b) R{ }
E of first mode; (c){ }
ℑ E of first mode; (d) ℑ
{ }
Hz of second mode; (e) ℜ{ }
E of second mode; (f) ℑ{ }
Eof second mode for a single cavity.
( )
( )
2( )
,l r 2 ,l .
c
ν ε ν ν
∇×∇×E r = r E r (1) In this equation εr
( )
r is the relative permittivity profile of a single cavity and c is the speed of light invacuum. Since eigen modes of the cavity are orthogonal we have
( ) ( )
, ,( )
d , , 1, 2,r νl νk lk l k
ε ∗ ⋅ =δ =
∫
r E r E r r (2)where we have normalized the modes. According to Bloch theorem, electric field in the super crystal can be written as
( )
( 1 2)(
)
2
, 1 2
, 1
ei n m l l ,
n m l
b ν n m
+∞
− ⋅ + ⋅
=−∞ =
− −
∑ ∑
κ a κ a
κ
E r E r a a (3)
where a1 and a2 are primitive vectors of the super crystal lattice, and b1 and b2 are constants to be
determined. Similar to Equation (1) we can write
( )
22= r ,
c
ω
[image:3.595.184.444.251.427.2]( )
(
)
( )
( )(
)
1 2
1 2 2
, 1 2
, 1
2 2
, 1 2
2
, 1
e
e .
i n m
l l n m l
i n m
r l l
n m l
b n m
b n m
c
ν
ν
ω ε
+∞
− ⋅ + ⋅ =−∞ =
+∞
− ⋅ + ⋅ =−∞ =
∇×∇× − −
= − −
∑ ∑
∑ ∑
κ a κ aκ a κ a
r a a
r r a a
E
E
(5)
Replacing ∇ ×∇ ×Eν,l
(
r−na1−ma2)
by its value from Equation (1) and inner producting both sides of Equation (5) by ν,k( )
∗ r
E and integrating over the entire x−y plane results in
( 1 2) ( 1 2)
2 2
2 , 2 ,
, ,
, = =1 , = =1
e i n m k l e i n m k l
l n m l n m
n m l n m l
b b
ν +∞ − ⋅ + ⋅ α ω +∞ − ⋅ + ⋅ β
−∞ −∞
=
∑ ∑
κ a κ a∑ ∑
κ a κ a ,(6)
where
( )
(
) (
)
( )
(
) ( )
,
, , , 1 2 1 2
,
, , , 1 2
d ,
d .
k l
n m k l r k l
n m k l r
n m n m
n m
ν ν
ν ν
α ε
β ε
∗ ∗
= ⋅ − − − −
= ⋅ − −
∫
∫
r r a a r a a r
r r a a r r
E E
E E
Using the approximations
, ,
, , 0, 2 , ,
k l k l
n m n m n m
α β ≤
which is valid for confined cavity fields and doing some simplification we finally obtain the following eigenvalue problem.
( )
1( )
12 2
2 2
.
b b
b b
ν =ω
κ κ (7)
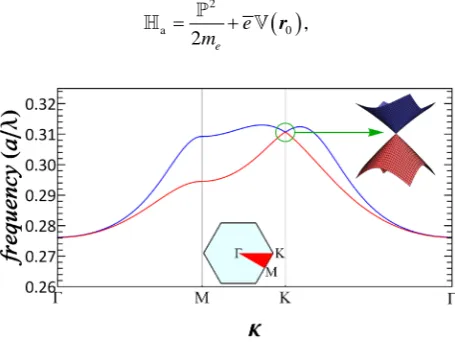
The two bands which are shown in Figure 3 construct the Dirac cone and are obtained by solving this problem.
3. System Hamiltonian
Now we position a quantum dot inside one of the super crystal cavities. To find its behavior due to interaction with Dirac modes we have to determine the system Hamiltonian. We assume the quantum dot is at position r0
and an electron is inside it. The electron Hamiltonian equals
(
)
2( )
2( )
(
)
2 20 0
1
,
2 e 2 e 2 e 2 e
e e
e e e
m m m m
′ = − + = + − ⋅ + ⋅ +
r r
where me, e and are the electron mass, charge and momentum respectively, is the magnetic vector potential,
( )
2
a 0 ,
2me e
= +
[image:4.595.199.427.523.694.2] r
Figure 3. The two bands of PC slab which construct the Dirac cone. They are calcu-
is the electron Hamiltonian in the absence of the field,
(
)
I ,
2 e
e m
= − ⋅ + ⋅
is the interaction of electron momentum with the field, and 2
2
ff ,
2 e e
m =
is the interaction of different field modes through coupling with electron. Because of 2
e term, ff is much
smaller than other Hamiltonians and can be ignored without significant error.
We can write a according to the quantum dot energy levels. If we show its energy states by
(
1, , s)
i , i= N we have
a i =E ii ,
where Ei is the energy of i’th state. Since energy eigen states create an orthonormal basis we can write
ˆ .
a a a i i ii
i i i
i i E i i ω σ
= =
∑
=∑
=∑
(8)
In this relation ω =i Ei is the frequency related to the i’th energy level and σˆij = i j is the atomic
ladder operator. This operator has the following properties,
†
ˆij k jk i , ˆij ˆji, ˆij, ˆkl jkˆil liˆjk,
σ =δ σ =σ σ σ =δ σ −δ σ
where δij is the Kronecker delta function.
To write I based on atomic and field operators, we have to write based on atomic ladder operators.
For this purpose we write
, ,
ˆ . ij ij
i j i j i j
i i j j i j i j pσ
= = = =
∑
∑
∑
∑
Using the commutator relation
[
a,]
, ei m
≡
between atom Hamiltonian and position operator, , we can write
[
]
(
)
ˆ ˆ
,
,
e e
ij a k kk k kk
k k
e e
e i j ij ij ij
m m
p i j i i j i i j
m m
im i j i i e j i
e e
ω σ ω σ
ω ω ω ω
= = = −
= − = =
∑
∑
d
(9)
where ωij =ω ωi− j is the transition frequency between i’th and j’th energy levels and dij = i e j is the
transition electric dipole between i and j states. Here we have replaced the value of a from Equation
(8).
Now we should write magnetic vector potential operator based on photon annihilation, ˆa, and creation, aˆ†, operators. If there is only one cavity in the basis PC, then can be written as [23]
( )
( ) ( )
*( )
ˆ ,
2
t = a t +
Ω
∑
r u r u r
( )
†
ˆ ,
a t
where the sum is over all the cavity modes, Ω is the frequency of the th mode, u
( )
r is the normalized th mode function, is the electric permittivity of space, and is the reduced Planck constant. We know mode functions are orthonormal, that is( ) ( )
*d δ .
′ = ′
In most of quantum optics texts,
( )
2max
u r is shown by 1 [23] [24], where is called the effective volume of th mode. So we can write vector potential operator as
( )
( ) ( )
*( )
ˆ ,
2
t = a t +
Ω
∑
r v r v r
( )
† ˆ ,a t (10) where v
( )
r is the mode function with its maximum limited to one. If there is more than one, say Nc, cavity in the basis PC, then becomes( ) ( )
*( )
ˆ 2 c a t N = + Ω∑
v r v r
( )
† ˆ .a t (11) Note that here we have obviously more modes than in the case of a single cavity which has only two modes. Therefore I becomes
(
)
I
2 e e
e e m m = − ⋅ + ⋅ = − ⋅
( )
*( )
0 0 , ˆ 2 i j e c e am N
= − +
Ω
∑∑
v r v r
†
ˆ e ˆ
ij ij ij
m
a i
e ω σ
⋅
d
(12)
( )
*( )
0 0
,
ˆ ˆ
ij ij ij i j
i g aσ g
= −
∑∑
r − r
ˆ ˆ† †
,
ij
aσ where
( )
( )
, 2 ij ij ij c g N ω = ⋅ Ω r v r d (13)
is the Rabi frequency. In Equation (12) we have used the fact that atomic and photonic operators commute with each other, that is
†
ˆ ,ˆij 0, ˆ ,ˆij 0 , , .
a σ a σ i j
= = ∀
In rotating wave approximation (RWA), I simplifies to
( )
*( )
I ij 0 ˆ ˆij ij 0
i j
i g aσ g
>
= −
∑∑
r − r
ˆ ˆ† †
,
ij
aσ (14) Finally Hamiltonian of the whole system becomes
f,
t = ′+
where
( )
( )
2 2 f 1 d , 2 2µ = + ∫
r r r
is the Hamiltonian of the electromagnetic field and and are the electric field and magnetic field opera- tors respectively. By writing and in terms of and using Equation (10), f can be written as
† f
1
ˆ ˆ .
2
a a
= Ω +
∑
Our system, in its simplest form, consists of a quantum dot with two energy eigen states inside one of the Nc coupled cavities which their modes construct a Dirac cone. Hamiltonian of this system, considering RWA, becomes
(
)
†( )
*( )
1 11 2 22 21 0 21 21 0
, ,
ˆ ˆ pˆ ˆp p p ˆpˆ p
p p
a a i g a g
ω σ ω σ σ
= + +
∑
Ωκ κ κ −∑
κ κ − κκ κ
r r
†
12 ˆpˆ ,
vacuum and have omitted it in this equation.
In the remaining, without losing the problem generality, we set r0 =0. As said, a single cavity has two orthogonal modes that are shown in Figure 2. The electric fields of these two modes are orthogonal at the center of the cavity too. We now assume the quantum dot transition dipole is parallel to the first and perpendicular to the second. Hence considering Equation (3), we conclude 1κp is approximately b1,p
( )
κ times of the casewith just a single cavity. Again p marks lower and upper bands constructing Dirac cone.
4. Atom Evolution
For simplicity we assume there is initially no photon in the system and the atom is in a superposition state of its ground and exited states. So we can write the initial state of the system as
(
t 0)
ψatom ψfield c1( ) { }
0 1, 0 c2( ) { }
0 2, 0 ,Ψ = = ⊗ = + (16)
where c1
( )
0 and c2( )
0 can be written in the most general case as [25]( )
( )
a1 0 cos a, 2 0 e sin a.
i
c = θ c = ϕ θ (17)
The state of the system in times t>0 can be written as
( )
( )
1{ }
( )
2{ }
( )
(1 ){ }
1 2
,
e i t 1, 0 e i t 2, 0 e i pt 1, 1 ,
p p
p
t c t ω c t ω cκ t ω κ κ
κ
− +Ω
− −
Ψ = + +
∑
(18)where the effect of
(
)
†0 1 11 2 22
,
ˆ ˆ pˆ pˆ p,
p
a a
κ κ κ κ
ω σ ω σ
= + +
∑
Ω
has been included in the state via exponential terms. By inserting the system ket state from Equation (18) and the system Hamiltonian from Equation (15) into Schrödinger equation
( )
( )
,i t t
t
∂ Ψ = Ψ
∂ we reach
( )
{ }
( )
{ }
( )
( ){
{ }
}
( )
( )
{ }
( )
( )( ) { }
1 1 2 1 2 1 2 , *2 21 0 21 0
, ,
e 1, 0 e 2, 0 e 1, 1
e 1, 1 e 2, 0 .
p
p
i t i t i t
p p
i t i t
p p p p
p p
i c t c t c t
i c t g r i c t g r
κ κ ω ω ω κ κ κ ω ω
κ κ κ κ
κ κ − +Ω − − − +Ω − + + = −
∑
∑
∑
By equating the coefficients of similar kets at both sides, we obtain the following system of equations.
( )
( )
( )
( )
( )
( )
( )
1
2 21 0
,
*
2 21 0
0, e , e . p p i t p p p i t p p c t
c t c t g
c t c t g
− ∆ ∆ = = − =
∑
κ κ κ κ κ κ κ r rThe first equation indicates c t1
( )
do not change with time. To solve the next two equations we use Laplace transform. In Laplace domain these equations become( )
( )
(
)
( )
2 2 21
,
0 p p p 0 ,
p
sC s −c = −
∑
Cκ s+ ∆i κ g κ κ(19)
( )
( )
(
)
*( )
2 21
0 0 .
p p p p
sCκ s −cκ =C s i− ∆κ g κ (20)
By replacing Cκp
(
s i+ ∆κp)
from Equation (20) into Equation (19) we have( )
( )
( )
(
)
2 2 2 21 , 0 . 0 p p p c C ss g s i
=
+
∑
κ + ∆κκ
To calculate C2
( )
s , we should first calculate( )
(
)
221
,p g p 0 s+ ∆i p
∑
κ κ κ . Since κ is a continuous varia- ble we replace the sum by an integral as( )
2
2
, 1
d ,
2π S
p p= ′
→
∑
∑∫
κ κ
where is the area of the super crystal unit cell and S′ is a region in reciprocal lattice which besides being in the first Brillouin zone, is on the Dirac cone and below the light cone. Since Dirac point is located on the high symmetry point K, at the corners of the Brillouin zone, S′ regions can be approximated by two circles centered at K point and with radius δκ. This radius is a function of Dirac point frequency and Dirac cone shape. For the lower part of Dirac cone (p=1), we have
( )
(
) ( )
( )
(
)
( )
( )
(
)
( )
( )
(
)
(
)
( )
( )
(
)
(
)
2 2
2 2
1,1
21 1 21 21
2
1 0 1 1
2 2 2
1,1 21 21
2
1 1 21
0
2 2 2
1,1 21 21
2
D 1 21
0
2 2 2
1,1 21 21
2
D D
0 0
d 2
2π
1
d 2 2π
d 2 2π
2 2π
S
c
S c
S c
S c
b
g d
s i N s i
b d
s i N
b d
s i N
b d
s i N
ω
ω
ω
ω
ακ ω
ω
ακ ακ
′
′
′
′
=
+ ∆ Ω + ∆
=
Ω + Ω −
=
Ω − + Ω −
=
Ω − + ∆ −
∑
∫
∫
∫
∫
κ
κ κ κ κ
κ κ
κ
κ
κ
κ
κ
κ
κ
κ
d .κ
(22)
In this equation ΩD is the frequency of Dirac point, ∆ = Ω −D D ω21, κ is the distance from K point and
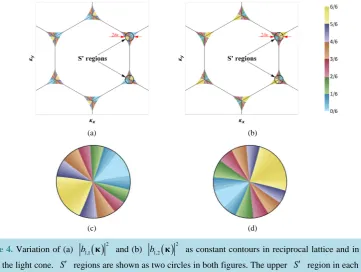
α is the gradient of Dirac cone. Figure 4 shows the variation of b1,1
( )
κ 2 and( )
21,2
b κ as constant con- tours in reciprocal lattice and in the regions below the light cone. Zooming in S′ regions, we can see b1,1
( )
κ 2(a) (b)
[image:8.595.129.491.439.711.2]
(c) (d)
Figure 4. Variation of (a) b1,1
( )
κ 2 and (b) b1,2( )
κ 2 as constant contours in reciprocal lattice and in regions below the light cone. S′ regions are shown as two circles in both figures. The upper S′ region in each of themand b1,2
( )
κ 2 depend mainly on azimuthal component (ϕ), and a little on radial component (r). ThereforeEquation (22) simplifies to
( )
(
)
( )
( )
(
)
(
)
( )
( )
(
)
[
]
( )
( )
(
)
[
]
(
)
[
]
2 2 22 2 2 2 2
1,1 1,1
21 1 21 21 21 21
2 2
1 0 D D 0 D
2 2 2
2 2
21 21 1,1
2 0 0
D 0
2 2 2
21 21
0
0 D
0 2 3
d d
2 2π 2π
2 3
| | d d
2π 3 d 4π 3 S S c c c c b b
g d a d
s i N s i N s i
a d
b
s i N
a d
N s i
a π δκ δκ ω ω ακ ακ ακ ακ
ω ϕ ϕ κ κ
ακ ακ
ω κ κ
ακ ακ
′ ′
= =
+ ∆ Ω − + ∆ − Ω − −
= ⋅
Ω − −
=
Ω − −
=
∑
∫
∫
∫
∫
∫
κ κ κ κ κ κ κ (
)
2 2 2 2
21 21 D
D
2 2 2 2
0 D D
1
2 ln 2 arctan ln ,
4π c 2
d s
s i
N s i s s
ω αδκ
αδκ
α α δκ
Ω
⋅ − Ω Ω Ω − + − + +
(23)
where we have used 2
2 3a
=
and
( )
( )
2π 2 2π 2
1,1 1,2
0 b ϕ dϕ 0 b ϕ dϕ π,
∫
∫
relations. We have also set ∆ =D 0 for simplicity. If we go through the same process for the upper part of Dirac cone (p=2), we obtain
( )
(
) ( )
( )
(
)
[
]
(
)
[
]
(
)
2
2 2 2
2π 2
21 2 21 21
1,2
2 0 0
2 0 D
2 2 2
21 21
0
0 D
2 2 2 2
21 21 D
D
2 2 2 2
0 D D
0 2 3
d d 2π 3 d 4π 3 1
2 ln 2 arctan ln
4π 2
c
c
c
g a d
b
s i N s i
a d
N s i
a d s
s i
N s i s s
δκ
δκ
ω ϕ ϕ κ κ
ακ ακ
ω κ κ
ακ ακ
ω αδκ
αδκ
α α δκ
= ⋅
+ ∆ Ω + +
=
Ω + +
Ω
= ⋅ − Ω Ω Ω + + + +
∑
∫
∫
∫
κκ κ
. (24) Using Equations (23) and (24) we get
( )
(
)
(
)
2 2
D
2 D
2 2 2 2 2 2
2 2 2
21 21 21 D
2
, 0 D
ln ln
0 3
, 4π
p
p p c
s is
g a d s
N s i
s i
α δκ α δκ
ω
α
Ω
Ω Ω − + +
=
− Ω + ∆
∑
κ κ κ
which results in
( )
( )
(
)
1
2 2
D
D 2 2 2 2 2 2
D
2 2 21 2
D ln ln 0 , s is s
C s c s
s i
α δκ α δκ
χ
α
−
Ω Ω +
Ω − +
= + − Ω with
2 2 2 21 21 21 0 3 . 4π c a d N ω χ =
If we want to obtain c t2
( )
, we have to calculate inverse Laplace transform of C2( )
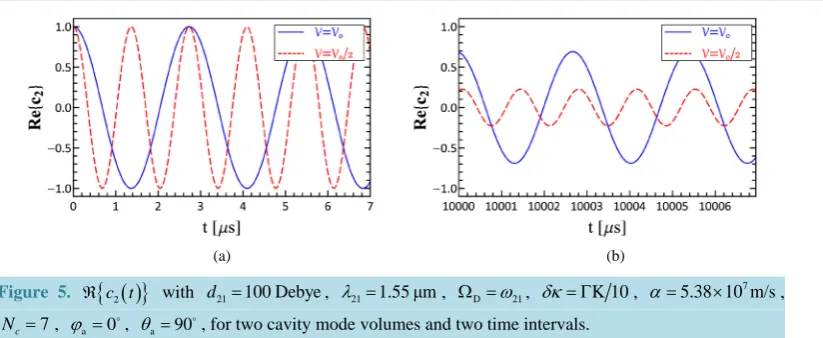
s . This is feasible only numerically. In Figure 5 variathions of the real part of c t2( )
is plotted with d21=100 Debye, λ =21 1.55μm,D ω21
Ω = , δκ = ΓK 10, α =5.38 10 m/s× 7 , Nc =7, ϕa =0 ,
a 90
(a) (b)
Figure 5. ℜ
{
c t2( )
}
with d21=100 Debye, λ21=1.55μm, Ω =D ω21, δκ= ΓK 10,7 5.38 10 m/s
α = × ,
7
c
N = , ϕa =0, θa=90, for two cavity mode volumes and two time intervals.
and two time intervals. It is seen c t2
( )
alternates sinusoidally with a frequency that is inversely proportional to the cavity mode volume and an amplitude which decays very slowly with time. This shows photon is exchanged between the quantum dot and the Dirac modes sinusoidally. By increasing the frequency of this alternation, we hope to enter strong coupling regime and perform some quantum computing algorithms.5. Conclusion
We proposed a new platform to be used for quantum computing. We first showed we could create Dirac cone in the band structure of a PC using coupled cavities inside a triangular lattice. Next we studied the evolution of a quantum dot positioned at the center of one of the cavities due to interaction with Dirac cone modes. We observed the quantum dot exchanged photon with Dirac modes sinusoidally and became entangled with them.
References
[1] Purcell, E.M., Torrey, H.C. and Pound, R.V. (1946) Physical Review, 69, 681.
http://dx.doi.org/10.1103/PhysRev.69.37
[2] Walther, H., Varcoe, B.T.H., Englert, B. and Becker, T. (2006) Reports on Progress in Physics, 69, 1325-1382.
http://dx.doi.org/10.1088/0034-4885/69/5/R02
[3] Mabuchi, H. and Doherty, A.C. (2002) Science, 298, 1372-1377. http://dx.doi.org/10.1126/science.1078446
[4] Raizen, M.G., Thompson, R.J., Brecha, R.J., Kimble, H.J. and Carmichael, H.J. (1989) Physical Review Letters, 63, 240. http://dx.doi.org/10.1103/PhysRevLett.63.240
[5] Ohta, R., Ota, Y., Nomura, M., Kumagai, N., Ishida, S., Iwamoto, S. and Arakawa, Y. (2011) Applied Physics Letters,
98, Article ID: 173104.
[6] Thon, S.M., Rakher, M.T., Kim, H., Gudat, J., Irvine, W.T.M., Petroff, P.M. and Bouwmeester, D. (2009) Applied Physics Letters, 94, Article ID: 111115. http://dx.doi.org/10.1063/1.3103885
[7] Reithmaier, J.P., Sek, G., Löffler, A., Hofmann, C., Kuhn, S., Reitzenstein, S., Keldysh, L.V., Kulakovskii, V.D., Rei-necke, T.L. and Forchel, A. (2004) Nature, 432, 197-200. http://dx.doi.org/10.1038/nature02969
[8] Lev, B., Srinivasan, K., Barclay, P., Painter, O. and Mabuchi, H. (2004) Nanotechnology, 15, S556.
http://dx.doi.org/10.1088/0957-4484/15/10/010
[9] Buck, J.R. and Kimble, H.J. (2003) Physical Review A, 67, Article ID: 033806.
http://dx.doi.org/10.1103/PhysRevA.67.033806
[10] Aoki, T., Dayan, B., Wilcut, E., Bowen, W.P., Parkins, A.S., Kippenberg, T.J., Vahala, K.J. and Kimble, H.J. (2006)
Nature, 443, 671-674. http://dx.doi.org/10.1038/nature05147
[11] Hennessy, K., Badolato, A., Winger, M., Gerace, D., Atature, M., Gulde, S., Falt, S., Hu, E.L. and Imamoglu, A. (2007)
Nature, 445, 896-899. http://dx.doi.org/10.1038/nature05586
[12] Casanova, J., Romero, G., Lizuain, I., García-Ripoll, J.J. and Solano, E. (2010) Physical Review Letters, 105, Article ID: 263603. http://dx.doi.org/10.1103/PhysRevLett.105.263603
[13] Liberato, S.D. (2014) Physical Review Letters, 112, Article ID: 016401.
[14] Günter, G., Anappara, A.A., Hees, J., Sell, A., Biasiol, G., Sorba, L., Liberato, S.D., Ciuti, C., Tredicucci, A., Leitens-torfer, A. and Huber, R. (2009) Nature, 458, 178-181. http://dx.doi.org/10.1038/nature07838
[15] Shahraki, M.A., Khorasani, S. and Aram, M.H. (2014) Applied Physics A, 115, 595-603.
http://dx.doi.org/10.1007/s00339-013-8025-4
[16] Ladd, T.D., Jelezko, F., Laflamme, R., Nakamura, Y., Monroe, C. and O’Brien, J.L. (2010) Nature, 464, 45-53.
http://dx.doi.org/10.1038/nature08812
[17] Vandersypen, L.M.K., Steffen, M., Sherwood, M.H., Yannoni, C.S., Breyta, G. and Chuang, I.L. (2000) Applied Phys-ics Letters, 76, 646-648. http://dx.doi.org/10.1063/1.125846
[18] Vandersypen, L.M.K., Steffen, M., Breyta, G., Yannoni, C.S., Sherwood, M.H. and Chuang, I.L. (2001) Nature, 414, 883-887. http://dx.doi.org/10.1063/1.125846
[19] Schoelkopf, R.J. and Girvin, S.M. (2008) Nature, 451, 664-669. http://dx.doi.org/10.1038/451664a
[20] Houck, A.A., Türeci, H.E. and Koch, J. (2012) Nature Physics, 8, 292-299. http://dx.doi.org/10.1038/nphys2251
[21] DiCarlo, L., Chow, J.M., Gambetta, J.M., Bishop, L.S., Johnson, B.R., Schuster, D.I., Majer, J., Blais, A., Frunzio, L., Girvin, S.M. and Schoelkopf, R.J. (2009) Nature, 460, 240-244. http://dx.doi.org/10.1038/nature08121
[22] Aram, M.H., Mohajeri, R. and Khorasani, S. (2013) Applied Physics A, 115, 581-587.
http://dx.doi.org/10.1007/s00339-013-8023-6
[23] Schleich, W.P. (2001) Quantum Optics in Phase Space. Wiley-VCH, Berlin. http://dx.doi.org/10.1002/3527602976
[24] Andreani, L.C., Panzarini, G. and Gérard, J.-M. (1999) Physical Review B, 60, Article ID: 13276.
http://dx.doi.org/10.1103/physrevb.60.13276