© Associated Asia Research Foundation (AARF)
A Monthly Double-Blind Peer Reviewed Refereed Open Access International e-Journal - Included in the International Serial Directories.
Page | 69
NONLINEAR OPTICAL PROPERTIES STUDY IN FLUORESCEIN WITH
DIFFERENT CONCENTRATIONS
Hussain A. Badran, Hussain F. Hussain,
Basrah University, Education College for pure science Physics Department, Basrah, Iraq Aqeel L. Mghames
Basrah University Physics Department , Science College, Basrah, Iraq ABSTRACT
The nonlinear optical properties of the Fluoresceinsolution were studied using single beam
Z-scan technique with a continuous-wave Diode laser radiation at 473 nm. The optical response was
characterized by measuring the intensity-dependent refractive index (n2) of the medium using the
Z-scan technique. The sample showed negative and large nonlinear refractive index values of the order
of 10-7cm2/W and reverse saturable absorption with high values of the nonlinear absorption coefficient
of the order of 10-4 cm/W. The results show that the solution of Fluorescein exhibits large nonlinear
refractive index and nonlinear absorption coefficient. These results show that the solution of
Fluorescein have potential application in nonlinear optics.
KEYWORDS: Fluorescein ; Z-scan; Diode laser; nonlinear refractive index.
INTRODUCTION
The search for optimum nonlinear material is active since forty years, through the combined efforts of physics, material science, and chemistry researchers by carrying out continuous nonlinear experiments on various possible materials and this field is very active in research and a promising tool for future photonics technology. Great effort has been made in order to explain the behavior of light beams propagating through in terraces separating optical media with different nonlinear refractive indexes. Development of high power laser sources has motivated an extensive research in the study of nonlinear optical properties and optical limiting behavior of materials [1]. Organic molecules with high nonlinear optical properties are required for photonic applications including optical switching, data storage and optical information processing [2-4]. The study of linear and nonlinear optical
International Research Journal of Natural and Applied Sciences ISSN: (2349-4077) Impact Factor- 5.46, Volume 5, Issue 12, December 2018 Website- www.aarf.asia, Email : [email protected] , [email protected]
© Associated Asia Research Foundation (AARF)
A Monthly Double-Blind Peer Reviewed Refereed Open Access International e-Journal - Included in the International Serial Directories.
Page | 70 coefficients is very important to tune the nonlinear optical (NLO) properties by the appropriate design of organic systems at the molecular level [5–7]. Nonlinear absorption can be classified in to two types: first, transmittance increases with increasing optical intensity, this nonlinear absorption corresponds to saturable absorption (SA). Second transmittance reduces with increasing optical intensity; this nonlinear absorption includes two photon absorption (TPA) and reverse saturable absorption (RSA) [8,9]. The physical origin of nonlinear refraction can be electronic, molecular, electro strictive or
thermal [10]. The first optical limiter was based on thermal mechanism with a CW laser; the thermal effects have been shown to be efficient even with nanosecond pulses [11–13]. The aim of this article is to present the characterization and investigation of the third-order NLO properties of the Fluorescein solution using Z-scan technique at 473 nm wavelength.
2. EXPERIMENT
2.1 Uv- Visible Spectroscopic
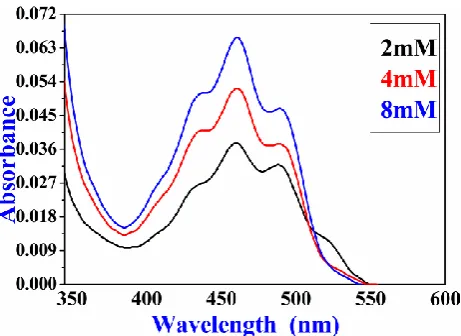
The linear measurement was carried out in a 1 mm thick cell. The linear absorption spectra of Fluorescein solution is shown in Fig. 1. The Ultraviolet-Visible (UV-Vis) absorption spectra of the sample was recorded at room temperature using UV- visible spectrophotometer (using Cecil Reflected- Scan CE 3055 reflectance spectrometer) in the spectral range 350 – 600 nm. The optical absorption for the Fluorescein in the solvent chloroform with different concentrations 2, 4 and 8 mM, respectively, shows absorption peak at 461 nm as can be seen in Fig. 1. Also it can be seen that the absorbance of the sample increases with increasing the concentration due to the increase in the number of molecules per unit volume, so the absorbance will be increased.
[image:2.595.190.421.500.668.2]© Associated Asia Research Foundation (AARF)
A Monthly Double-Blind Peer Reviewed Refereed Open Access International e-Journal - Included in the International Serial Directories.
Page | 71 2.1. Z-scan measurements
© Associated Asia Research Foundation (AARF)
A Monthly Double-Blind Peer Reviewed Refereed Open Access International e-Journal - Included in the International Serial Directories.
Page | 72 3. RESULTS AND DISCUSSION
3.1 The absorption coefficient (α)
The absorption coefficient (α) was obtained directly from the absorbance against wavelength curve using the relation [27-30]
L A
303 . 2
(1) where L is the sample thickness and A is the absorbance. The value of absorption coefficients (α) at 473 nm for Fluorescein solution has been calculated using Eq. 1 to be 0.713, 0.944, 1.174 cm-1. 3.2 Third nonlinear optics
In this work, we presented our studies of nonlinear optical properties of Fluorescein with various concentrations which were prepared by dissolved in chloroform solvent. The optical nonlinearity of the solutions is measured by Z-scan technique. The nonlinear refractive index and nonlinear absorption coefficient are investigated using a continuous wave laser beam with wavelength λ = 473 nm. Z-scan measurements are carried out in three different concentrations of the same thickness (1mm) of samples.
The nonlinear absorption is evaluated under an open aperture configuration [31 ] as:
eff
L I
T
2 2
(2)
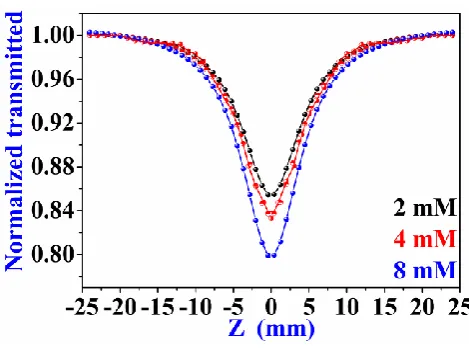
[image:4.595.187.422.492.669.2]where T is one-valley transmission for the open aperture. The nonlinear absorption coefficient (cm/W) for solution is calculated from the open aperture normalized transmittance in Fig. 2 and the values of are given in Table1.
Fig. 2 Open-aperture Z-scan.
© Associated Asia Research Foundation (AARF)
A Monthly Double-Blind Peer Reviewed Refereed Open Access International e-Journal - Included in the International Serial Directories.
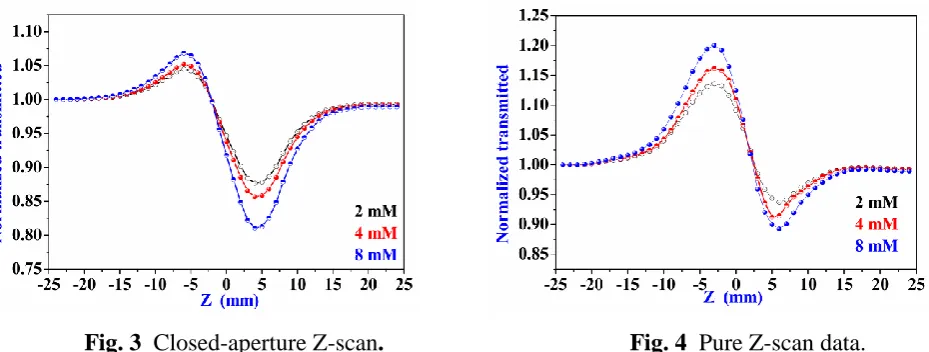
Page | 73 corresponding to negative nonlinear refraction index, i.e. self-defocusing occur. The defocusing effect is attributed to a thermal nonlinearity resulting from the absorption of a tightly focused beam traversing through the absorbing dye medium that produces spatial distribution of the temperature in the sample and, consequently, a spatial variation of the refractive index that acts as a thermal lens resulting in phase distortion of the propagating beam [32].
[image:5.595.67.532.156.332.2]
Fig. 3 Closed-aperture Z-scan. Fig. 4 Pure Z-scan data.
The measurable quantity TPV can be defined as the difference between the normalized peak and valley transmittances,TPTV. The variation of this quantity as a function of is given by [33,34]:
0.25
) 1 ( 406 .
0 S
TP V (3) where S 1exp(ra2 /a2) is the aperture linear transmittance (=0.32) with radenoting the aperture
radius and adenoting the beam radius at the aperture in the linear regime [35]. , the on-axis phase shift is related to the third-order nonlinear refractive index by [36]:
kn2LeffI
(4) where k=2π/λ, Leff (1exp(L))/ is the effective thickness of the sample [37], α the linear absorption coefficient, L the thickness of the sample, I the on-axis irradiance at focus and n2 is the third-order nonlinear refractive index. The difference in amplitude of the Z-scan curves for the solution can be due to the difference in absorption coefficient at the =473 nm wavelength. In Z-scan measurement, the transmittance of the sample measured without an aperture gives information on purely nonlinear absorption coefficient whereas the apertured scan contains the information of both the nonlinear absorption coefficient and nonlinear refractive index nonlinearities [38,39] .
© Associated Asia Research Foundation (AARF)
A Monthly Double-Blind Peer Reviewed Refereed Open Access International e-Journal - Included in the International Serial Directories.
Page | 74 n = no + Δn and Δn = n2I. (5)
The nonlinear refractive index n2 (cm2/W) for the samples are calculated from the closed aperture normalized transmittance in Fig.4and the values obtained are given in Table1.
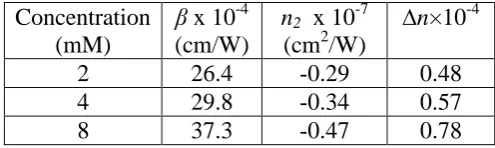
Table 1. The nonlinear optical parameters.
∆n×10-4 n2 x 10-7
(cm2/W) β x 10-4
(cm/W) Concentration
(mM)
0.48 0.29
-26.4
2
0.57 0.34
-29.8
4
0.78 0.47
-37.3
8 CONCLUSIONS
Prepared, UV-Vis characterization, and the Z-scan measurements of Fluorescein using a CW diode laser at 473 nm wavelength have been presented. The nonlinear refraction,n2, and the nonlinear absorption coefficient, β, for Fluorescein in solvent chloroform have been measured using the Z-scan technique. The measured absorption curves indicate that the nonlinear absorption is a saturation absorption process. The results of Z-scan indicate that the samples have a large optical nonlinearity .The studied sample exhibits self-defocusing property with a negative value of nonlinear refractive index.
REFERENCES
[1] F. A. Al-Saymari, H. A. Badran, A. Y. Al-Ahmad, C. A. Emshary, Indian J Phys. 1153–1156 (2013) 87.
[2] A. L. Mghames, H. A. Badran, H. F. Hussain, , International Journal of Engineering and Applied Sciences (IJEAS), 64-67 (2018) 5.
[3] H. A. Badran, A.Y.Taha, Q. M. Ali, C. A. Emshary, Pramana J. Phys. 135-145(2016) 86. [4] H. A. Badran, A.Y.AL-Ahmad, M.F.AL-Mudhaffer, C. A. Emshary, Opt Quant Electron, 1859–1867 (2015) 47.
[5] H. A. Badran, A. I. Musa, Q. M. Ali, Optik , 2659-2665 (2016)127.
[6] H. A. Badran, Alyaa A. Jari, International Research j of Natural and Applied Sciences, 29- 38 (2017) 4.
[image:6.595.180.428.209.283.2]© Associated Asia Research Foundation (AARF)
A Monthly Double-Blind Peer Reviewed Refereed Open Access International e-Journal - Included in the International Serial Directories.
Page | 75 [8] H. A. Badran, Result in Physics, 69-72 (2014) 4.
[9] K. Abd AL-Adel, H. A. Badran, European J. of Applied Engineering and Scientific Research, 66-72 (2012) 1.
[10] N. Al-Had S.Yakop, H.A.Badran, Journal of Engineering Research and Applications, 727-731 (2014) 4.
[11] H. A. Badran, R. Ch. Abul-Hail, H. S. Shaker, A. I. Musa, Q. M. A. Hassan, , Appl. Phys. B 31-40 (2017) 123.
[12] H. A. Badran , N. Al-huda S.Yakop, International Journal of Engineering Research and Management (IJERM), 67-97 (2014) 1.
[13] H. A. Badran, A. A. Al-Fregi, International Journal of Semiconductor Science & Technology (IJSST) 26-36 (2012) 2,
[14] Sheik-Bahae M, Said A A, Wei T H, Hagan D J, Stryland E W V. IEEE J Quantum Elect, 760-769 (1990) 26.
[15] H. A. Badran, Q. M. Ali, A. I. Musa, J Mater Sci: Mater Electron 5958-5963(2015) 26.
[16] H. A.Badran, A. Y. Al-Ahmad, M. Fadhil Al-Mudhaffer, Journal of Basrah Researches (Sciences) 57-63 (2011) 37.
[17] A. Imran, H. A. Badran, Q. M. Ali Hassan, IOSR Journal of Engineering(IOSRJEN), 27-33 (2014) 4.
[18] A. Imran, Q. M. Ali Hassan,H. A. Badran, European Scientific Journal, 382-390 (2014) 10. [19] H. A. Sultan, H. A. Badran, A. Y. Al-Ahmad, C. A. Emshary, J. of Basrah Researches
(Sciences)A 1-12(2013) 39.
[20] H. A. Badran, A. Al‑Maliki, R. K. Fakher Alfahed, B. A. Saeed, A. Y. Al‑ Ahmad, F.A. Al‑Saymari, R. S. Elias, Journal of Materials Science: Materials inElectronics10890–10903 (2018) 29.
[21] K.A. Al-Adel, H. A. Badran, Archives of Applied Science Research, 2499-2506 (2012) 4. [22] H. A. Badran, A. A. Al-Fregi, R. K. Fakher Alfahed, A. S. Al-Asadi, J Mater Sci: Mater Electron, 17288–17296 (2017) 28.
[23] H. A. Badran, Advances in Physics Theories and Applications, 36-44 (2013) 26.
[24] H. A. Badran, K. Abd. AL-Adil, H. G. Lazim, A.Y Al-Ahmad, J Mater Sci: Mater Electron, 2212–2220 (2016) 27.
© Associated Asia Research Foundation (AARF)
A Monthly Double-Blind Peer Reviewed Refereed Open Access International e-Journal - Included in the International Serial Directories.
Page | 76 [26] K. A. AL-Adel, H. A. Badran, Journal of Basrah Researches (Sciences), 73-79 ( 2012 ) 38.
[27] H. S. Shaaker, H. A. Badran, W. A. Hussain, Archives of Applied Science Research,1804-1810 (2012) 4.
[28] H. G. Lazim, K. I. Ajeel, H. A. Badran, Spectrochimica Acta Part A: Molecular and Biomolecular Spectroscopy 598-603 (2015) 145.
[29] H.A. Badran,M.F. AL-Mudhaffer,Q.M.A. Hassan, A.Y. ALAhmad, Chalcogenide Lett 483-493 (2012) 9.
[30] H. A. Badran, American J. of Applied Sciences 250-253 (2012) 9.
[31] H. A. Badran, A. A.Fregi, International J. Semicond Sci Technol. 26-36 (2012) 2. [32] Q. M. Ali, H. A. Badran, A.Y.Taha, C.A.Emshary, Chin. Phys. B, 114209-9 (2013) 22. [33] H.A. Badran, IOSR Journal of Applied Physics, 33-37 (2012) 1.
[34] H. A. Badran, K.A. Al-Adel, Misan Journal for Academic Studies, 1-9 (2012) 11. [35] H. A. Badran, A.Y.Taha, A.F. Abdulkader, J. of Ovonic Research, 161-170 (2012) 8. [36] H. A. Badran, H. F. Hussain, K. I. Ajeel, Optik, 5301-5309 (2016) 127.
[37] H. A. Badran, A. A. Jari, International Journal of Engineering and Applied Sciences (IJEAS), 29-38 (2018)5.
[38] H. A.Badran, K.I.Ajeel and H.G.Lazim, Materials Research Bulletin, 422- 430 (2016) 76. [39] H. S. Shaaker, W. A. Hussain, H. A. Badran, Advances in Applied Science Research, 2940-2946 (2012) 3.
[40] Q. M. Ali Hassan, A. Y. Al-Ahmad, M. F. Al-Mudhaffer, Hussain A. Badran, Rom. Journ. Phys. 962–969 (2013) 58.
[41] C. A. Emshary, Hussain A. Badran, A. Y. AL-Ahmad, Q. M. Ali Hassan, J. Mater. Environ. Sci. 319-325 (2013) 4.