2018 International Conference on Applied Mechanics, Mathematics, Modeling and Simulation (AMMMS 2018) ISBN: 978-1-60595-589-6
Prediction of District Heating Load Based on Grey Neural Network Model
Peng-fei LIU, Rui LI
*and Bo FU
Environment and Energy Engineering Institute, Beijing University of Civil Engineering and Architecture, Beijing 100044, China
*Corresponding author
Keywords: Load forecasting, Grey incidence, Grey prediction, Neural network.
Abstract. In this paper, the gray correlation analysis method is used to evaluate the factors affecting the district heating load, and the gray prediction is combined with the BP neural network algorithm to establish a gray neural network structure, which can screen the factors affecting the heating load and predict the heating load. The heating load forecasting and verification of a district heating load is carried out. By comparing the prediction results and errors of the gray correlation GM(1, N) model, it is shown that the gray neural network model can select the appropriate influencing factors and exclude impact factors with low relevance in the heat load forecasting, improve the accuracy of heat load forecasting, and provide a theoretical basis for regional heat load forecasting.
Introduction
With the rapid development of central heating, the proportion of heating energy consumption in the whole society is increasing. The energy demand of the society is increasing, and the energy per capita is very limited. Therefore, heating and energy saving is one of the most potential and effective ways of building energy conservation in China. In China, winter heating not only consumes more energy, but also uses energy inefficiently. In the face of severe energy consumption, heating and energy saving work cannot be delayed. Correct prediction and evaluation of energy consumption of thermal stations can provide basis and basis for heating and energy saving. The heat station is the key to meeting the heating needs of users. In order to comprehensively and systematically evaluate the energy consumption level of a thermal station, it is necessary to comprehensively consider many influencing factors, that is, indicators, and the multiple indicators also increase the complexity of the analysis problem to some extent. Although regression analysis is a more general method, it is often difficult to process data under conditions where there are too many influencing factors and no obvious linear relationship. The BP neural network algorithm is used alone to predict the heating load. It is found that the training accuracy is not high and the prediction accuracy is poor. In this paper, the grey system correlation analysis method is combined with BP neural network for regional heating load prediction to solve the problem of optimal selection of BP neural network input variables, and a grey neural network optimization model is established. This new model can deal with a large number of influencing factors in the original data through the calculation of the gray correlation degree, thereby enhancing the adaptability of the BP network and more effectively and accurately predicting the district heating load.
Grey Correlation Analysis Method
Basic Concept of Grey Correlation Analysis Method
Grey System Theory is a systematic science theory initiated by famous scholar Professor Deng Julong The gray correlation analysis is a method for judging the degree of correlation between factors
according to the degree of similarity of the geometrical curves of various factors.1-4 This method
comparison sequence.4 The greater the degree of correlation between the comparison series and the reference series, the closer the development direction and rate are to the reference series, and the
closer the relationship is to the reference series.5 The gray correlation analysis method is still
applicable under the condition that the sample size is small or the correlation between the samples is not strong, and the calculation amount is small, which is very convenient, and the quantitative result is basically consistent with the qualitative analysis result. Therefore, gray correlation analysis is a simple and reliable analysis method in system analysis.
In the correlation analysis, this multi-factor problem is divided into different levels, the degree of correlation between them is calculated step by step, and the obtained degree of correlation is analyzed step by step.
Computational Steps of Grey Correlation Analysis Method
The specific calculation steps of grey correlation analysis method are as follows:
First, determine the reference series that reflects the behavioral characteristics of the system and the comparison series that affect the behavior of the system.
Suppose that the n reference sequence is X0={X0(k)|k=1,2,…,n}, and the m comparison sequence is
Xi={Xi(k)|k=1,2,…,n; i=1,2,…,m}. The gray correlation analysis of the reference series and the
comparison series generally includes the following calculation steps:
1) Dimensionless processing of raw data. Because the dimensions of different comparison series data are different, it is not easy to compare between different influence factors or it is difficult to get correct conclusions. Therefore, the dimensionless processing of the data is first performed, and then the gray correlation analysis is performed.
2) Calculate correlation coefficient. For the reference sequence X0 and the comparison sequence
X1,X2,X3, the correlation coefficient L0i(k) of each point can be calculated by the following formula:
0 0
0
0 0
min min ( ) ( ) max max ( ) ( )
( )
( ) ( ) max max ( ) ( )
i i
i k i k
i
i i
i k
x k x k x k x k
L k
x k x k x k x k
(1)
ρ is called the resolution coefficient, usually ρ=0.5.
3) Calculate relevance. As the quantity representation of the degree of association between the comparison series and the reference series, the correlation degree formula is as follows:
0 0 1 1 ( ) n i i k
r L k
n
(2) 4) Relevance ranking. The values of the obtained degrees of relevance are arranged in order of size. The effect of each comparison sequence on the reference sequence is reflected.
Grey Relational GM(1, N) Model Principle
The GM(1, N) model is a multivariate first-order linear dynamic model, which is mainly used for
dynamic analysis of systems and can analyze multivariable complex systems .7 The principle of
establishing a GM (1, N) model is as follows:
For the original data matrix X(0) N , there are N series, and the length of the sequence is M. First, the
data matrix generated by the accumulation to obtain X(1) N , Then calculate a subtraction data sequence
of X(1)
N to get {α
(1) (x(1)
i , i)}, then construct matrix X(A,B)=B, The gray parameter is solved by the least
squares method α=(BT,B-1), and then the obtained gray parameter is substituted into the time function:
1
0
1 1
1 1
12 2
1 1 1 1
N N a i i i i i i b b
x k x x k e x k
a a
(3)BP Neural Network
The BP neural network can realize highly nonlinear mapping.8 The input information is processed
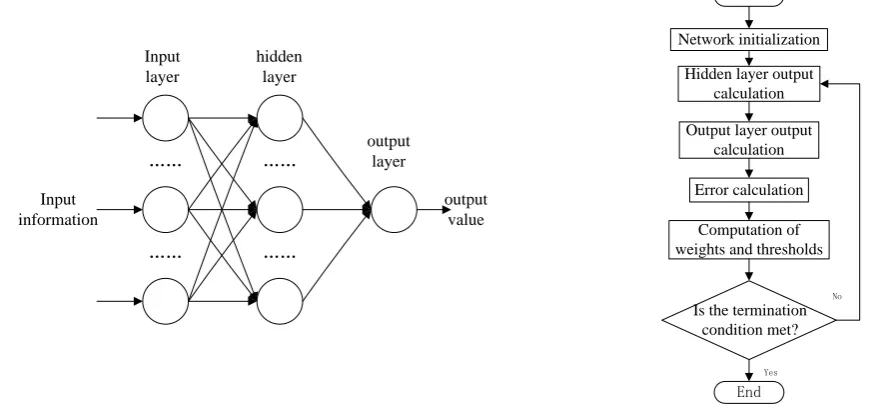
layer by layer from the input layer through the hidden layer and the actual output value of each unit is calculated. The block diagram of the structure is shown in Figure 1.
Figure 2 is a flow chart of the BP neural network algorithm. When the BP neural network is transmitting forward, the function signal enters from the input layer of the network to the inside of the network and finally reaches the end of the output layer. In the process of transmission, the error signal produced by the output signal and its expected output propagates backward, and the weights and thresholds are modified constantly in the process of propagation, so that the structural parameters of
the network are constantly revised until the error signal is minimized.9, the relationship weights
between the various levels are corrected from the back to the front, and the process of learning and correction is repeated. When the learning error of the network reaches the requirements of the people, the learning process of the network ends.
Input layer
hidden layer
output layer
…… ……
…… ……
Input information
output value
Start
Network initialization
Hidden layer output calculation
Output layer output calculation
Error calculation
Computation of weights and thresholds
End
Is the termination condition met?
[image:3.595.69.511.280.482.2] [image:3.595.77.312.302.448.2]Yes No
Figure 1. BP neural network structure. Figure 2. BP neural network algorithm flow.
Gray Neural Networ
In the actual prediction, when the uncertain factors account for a relatively high proportion of the prediction objects, it is difficult to obtain better prediction results through a single prediction model. The commonly used method is to use the qualitative analysis method to select the independent variables that have a greater influence on the dependent variables, and then proceed to establish the system model. When there are many influencing factors, if they are used as the input information of the neural network model, the complexity of the network will increase, which will lead to the degradation of network performance and affect the calculation accuracy and efficiency. Grey correlation analysis provides a better way to solve this problem. Through the calculation of the gray correlation degree, the appropriate influencing factors can be selected from a large amount of input
data, and then it is used as the input node to learn by BP algorithm. 9 According to the above gray
prediction model and BP neural network prediction model The basic principle, combined with the advantages of the two in prediction, proposes a gray neural combination forecasting model, and its structural block diagram is shown in Figure 3.
Simulation Experiment
lowest temperature (x2) on the day, the daily average load factor (x3), and the date are selected. Seven
factors including the average instantaneous flow rate (x4), the cumulative heating time (x5), the daily
average water supply temperature (x6), and the daily average return water temperature (x7) are used as
input factors to construct a model, and gray correlation analysis and gray prediction are performed. Using the matlab software to perform gray analysis on the heat load data of the heating station from December 1 to January 31, 2017, the results are as follows:
Influencing factors of district heating load
Grey relational analysis
Grey prediction model
BP neural network prediction model
[image:4.595.248.346.158.302.2]Prediction results
Figure 3. Grey neural network algorithm for district heating load.
G(1,1)= 0.7951,G(1,2)= 0.7818,G(1,3)= 0.8674,G(1,4)= 0.8651,G(1,5)= 0.3264,G(1,6)= 0.9596,G(1,7)= 0.8676.
The correlation order is x6> x7> x3> x4> x1> x2> x5 The correlation degree analysis obtains the five
influencing factors with the highest thermal load correlation, and these five factors are selected as the construction of the gray neural network.
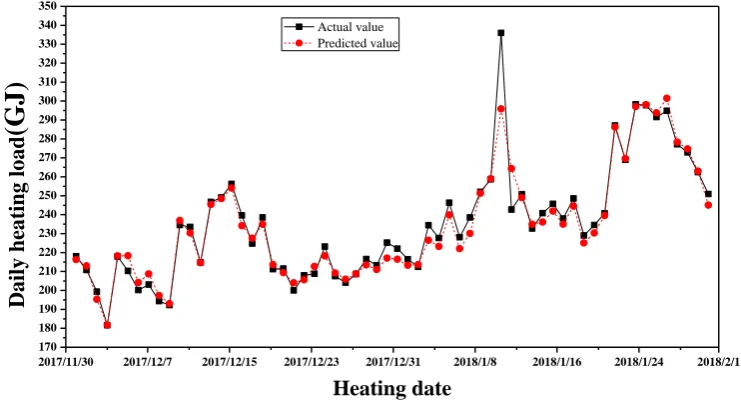
The daily heating load data is trained, and the 62 factors of the five influencing factors selected by the gray correlation analysis are input items, and the comparison curves and relative error results of the actual value and the predicted value are obtained. Fig. 4 is a graph comparing the predicted value of the daily heating load predicted by the neural network after gray correlation analysis with the true value. The relative error curve of the predicted sample is shown in Fig. 6. The GM (1, N) model simulation was also used as a comparison for 62 sets of data that were not screened by gray correlation analysis. The true values and predicted results are shown in Fig. 5.
2017/11/30 2017/12/7 2017/12/15 2017/12/23 2017/12/31 2018/1/8 2018/1/16 2018/1/24 2018/2/1
170 180 190 200 210 220 230 240 250 260 270 280 290 300 310 320 330 340 350
Actual value Predicted value
Dai
ly
hea
ting
lo
a
d
(GJ
)
Heating date
[image:4.595.111.482.522.725.2]2017/11/30 2017/12/7 2017/12/15 2017/12/23 2017/12/31 2018/1/8 2018/1/16 2018/1/24 2018/2/1
170 180 190 200 210 220 230 240 250 260 270 280 290 300 310 320 330 340 350
Actual value Predicted value
Dai
ly
hea
ting
lo
a
d
(GJ
)
[image:5.595.139.456.91.273.2]Heating date
Figure 5. Grey correlation GM (1, N) prediction result.
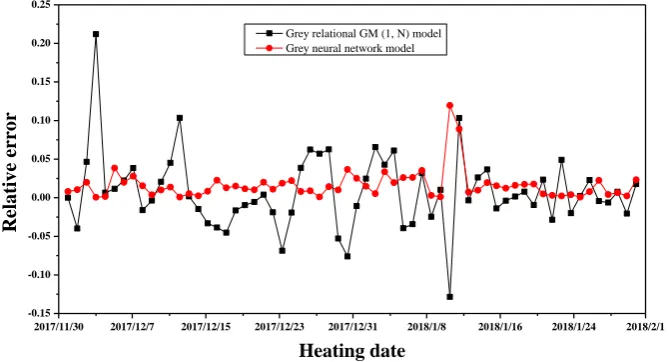
As can be seen from Fig. 4 and Fig. 5, when the daily heat load is forecasted by the grey relational GM (1, N) model, there is a great difference between the forecasted value and the test value, while the daily heat load forecasted value obtained by the grey neural network model is closer to the real value. From the error comparison graph obtained by the two methods in Fig. 6, it can be seen that the error is large when the GM(1,N) model is used and the prediction result is unstable, and the maximum relative error is 21%. The predicted value obtained by the gray neural network model is closer to the true value, and the maximum relative error is 12%. On the day of 2018/01/11, the gray prediction GM(1,N) has an error of 13% on this day. On the other hand, the thermal load on this day and the actual heat load in the first two days are greatly increased and then decreased greatly, indicating that the prediction error will increase when predicting the value of repeated and sharp changes.
The average relative error of the predicted value is 1.6%, that is, the accuracy of the predicted result is 98.4%, which is higher than 96.7% of the GM (1, N) model. It is shown that the grey neural network model can be used to predict the load of thermal power stations.
2017/11/30 2017/12/7 2017/12/15 2017/12/23 2017/12/31 2018/1/8 2018/1/16 2018/1/24 2018/2/1 -0.15
-0.10 -0.05 0.00 0.05 0.10 0.15 0.20 0.25
Rela
tiv
e
er
ro
r
Heating date
Grey relational GM (1, N) model Grey neural network model
Figure 6. Relative error between grey incidence GM (1, N) model and grey neural network model prediction value and true value.
[image:5.595.130.465.509.690.2]residential area are analyzed. The influencing factors of district heating load are analyzed by grey correlation analysis method, and the gray neural network structure is established. The heating load of a residential area is carried out. Forecasting and verifying the heating load in days, comparing the gray correlation GM(1,N) model with the gray neural network model for the heating load prediction error, the conclusions are as follows:
1) Grey correlation analysis can be used to evaluate the district heating load, the main influencing factors of the district heating load, the water supply temperature and the daily heating load value of the return water temperature, and the outdoor temperature, etc., and can rank the multiple influencing factors. The strength of the impact on the district heating load is obtained, and it is confirmed that the gray correlation analysis can be used for the district heating load evaluation.
2) As an important part of the gray system, the gray-associated GM(1,N) model has the good characteristics of being able to use the "less data" modeling to seek realistic laws, and can perform the district heating load in case of insufficient data or short system cycle. The prediction, but when the data is sufficient and the influencing factors are numerous and complex, the prediction results are not ideal for the gray neural network model.
3) The accuracy of the prediction result of the combined model of gray correlation analysis and neural network can reach 98.4%, but the prediction error will increase when predicting the value of repeated and sharp changes.
The gray neural network analyzes the gray neural correlation of the input data and selects the influencing factors as input data, which greatly improves the accuracy of the prediction results and provides a theoretical basis for the prediction of the district heating load.
References
[1] Deng Julong. Grey System Theory Course [M]. Huazhong University of Science and Technology Press, 1990.
[2] Deng Julong. Foundation of Grey Theory [M]. Huazhong University of Science and Technology Press, 2002.
[3] Wang Qingyin. Gray Mathematics Foundation [M]. Huazhong University of Science and Technology Press, 1996.
[4] Deng Julong. Basic Methods of Grey System [M]. Huazhong University of Science and Technology Press, 2005.
[5] Liu Sifeng, Guo Tianbang, Dang Yaoguo. Grey System Theory and Its Application, 2nd Edition [M]. Science Press, 1999.
[6] Sun Xiaodong. Several decision methods based on grey relational analysis and its application [D]. Qingdao University, 2006.
[7] Huang Jun, Pu Te, Zhao Xining.Soil infiltration based on neural network and grey relational analysis[J].Acta Pedologica Sinica, 2011, 48(6):1282-1286.
[8] Tian Xuguang, Song Wei, Liu Yuxin. Combining genetic algorithm to optimize the structure and parameters of BP neural network [J]. Computer Engineering and Software, 2004, 21(6): 69-71.