© 2016, IRJET | Impact Factor value: 4.45 | ISO 9001:2008 Certified Journal | Page 1458
Studies on removal of Bromo Phenol Blue dye using Sargassum
Muticum powder and Optimization using Central Composite Design
Dr Ch A I Raju
1, K Satyanandam
21
[email protected]
Senior Assistant Professor, Department of Chemical Engineering, Andhra University
2
[email protected]
Research scholar, Department of Chemical Engineering, Andhra University
Visakhapatnam Andhra Pradesh INDIA 530003
---***---Abstract -
The never ending demand for the processindustry like textile, paints and pigments have been of major concern now a days, due to the increased fraction of dyes pollution. The extraction of the above pollution can only be solved using biosorption. Hence an attempt is made using sargarrsum muticum (brown algae) powder for the removal of bromo phenol blue dye. The variables incorporated are time of agitation, biosorbent size, pH, initial concentration, dosage of biosorbent and temperature. The entire experiment process have followed lagengren first order kinetics and langmuir isotherm. The option pH was obtained at 4. The variation of temperature has been found to be increasing up to a certain limit and then after attainable equilibrium, it remained constant. The total experimentation was carried out in a batch process
Key Words: biosorption, kinetics, isotherms,
thermodynamics, brown algae
1. INTRODUCTION
Life on earth without water is impossible, inevitable and inexorable. Water is a prominent and promising barrier for ecological balance. Water is crucial to life for humans or mankind, organisms etc on earth. Worldwide water distribution scenario shows that only 2 % belongs to fresh water and the remaining comprises salt water only [1, 2]. As the human race is being acquainted with the advantages of technology, the growth of industrial sector has also enhanced, which inturn increased the pollution. Textile industries have grown hastily due to the increased population and their basic needs like clothing. The final waste from these textile industries is more tough to cleanse completely and the left over is released on to the surface of earth. These pollutants were being settled slowly and polluting the earth’s surface and depleting the ground water quality [3]. Drinking or potable water is being associated with these kind of dyes from underground water and humans consuming this contaminated water are being acquainted to new diseases. This can be stopped and eradicated using different techniques [4, 5]. After surveillance of different methods which are expensive and leaves harmful chemicals, Biosorption has been very
promising now a days to treat and solve the above problem [6, 7]. With less expensive and naturally available biosorbents the above method is very promising and propitious to solve the textile effluent problems.
2. MATERIALS AND METHODS
The materials and methods consists of the following steps: Reagents and materials, Preparation of the biosorbents and Studies on equilibrium biosorption process.
2.1 Reagents and materials:
All the chemicals used in this investigation were of analytical grade and used without further purification. BPB was used as the source of dye and all the solutions were made with distilled water. The solution of BPB dye was made from a stock solution containing 1000 mg of BPB dye in 1litre. The pH of dye solution was adjusted to the desired value by addition of 0.1M HCL and 0.1M NaOH solutions.
2.2 Preparation of the Biosorbent:
sargarrsum muticum algae was collected from Tenneti Park,
Jodugullapalem beach in Visakhapatnam and was washed with water to remove dust and soluble impurities and dried in sun light till the algae became crispy and colorless. The dried algae were finely powdered and sized by passing it through a set of sieves ranging from 300 to 75 mesh sizes. The powder of 53, 75, 105, 125 and 152 micron meters were separated and stored in dry bottles with double cap and used as biosorbent.
2.3 Studies on equilibrium biosorption process:
© 2016, IRJET | Impact Factor value: 4.45 | ISO 9001:2008 Certified Journal | Page 1459
3. RESULTS AND DISCUSSION
3.1 Characterization:
3.1.1 FTIR spectrum of untreated Bromo Phenol Blue dye:
FTIR spectrum of untreated Sargassum muticum powder is presented in fig. 1 (a). The sharp peak at 895.01 cm-1 denotes the involvement and participation of S=O and C–S–O from ester sulphonate in biosorption. The bands at 1039.68 and 1056.07 cm-1 indicates the involvement of C–H bending bonds. The bands at 1153.48 cm-1 assigns the C–O stretching bond. 450 600 750 900 1050 1350 1650 1950 2400 3000 3600 1/cm 0 15 30 45 60 75 90 105 120 135 %T 34 84 .5 6 33 84 .2 5 33 70 .7 5 33 55 .3 2 33 45 .6 7 33 34 .1 0 33 22 .5 3 33 10 .9 5 32 99 .3 8 32 82 .0 2 32 66 .5 9 32 53 .0 9 32 44 .4 1 32 29 .9 4 31 49 .8 9 31 06 .4 9 30 64 .0 6 30 48 .6 2 30 31 .2 6 29 38 .6 8 29 27 .1 0 29 11 .6 7 28 94 .3 1 28 71 .1 7 16 52 .1 0 16 45 .3 5 16 34 .7 4 16 23 .1 7 16 16 .4 2 15 16 .1 1 14 18 .7 1 13 73 .3 8 13 62 .7 7 13 18 .4 0 12 44 .1 4 12 36 .4 2 12 01 .7 0 11 53 .4 8 10 99 .4 7 10 70 .5 4 10 56 .0 7 10 39 .6 8 89 5. 01 78 1. 20 61 2. 43 55 8. 42 53 8. 16 51 3. 09 50 0. 55 47 7. 40 47 2. 58 46 1. 01 44 6. 54 43 2. 07 42 5. 32 41 8. 57 40 7. 00 M UNTREATED
Fig. 1 (a) FTIR spectrum of Bromo Phenol Blue untreated Sargassum muticum powder
The peak at 1201.70 and 1236.42 cm−1 in native biomass designates the presence of C-O stretching, –SO3 stretching bonds and is not observed after loading Bromo Phenol Blue. It indicates the direct involvement of C-O stretching in the ion-exchange process. The bands from 1318.40 to 1373.38 cm-1 denotes the presence of –CH2 bending vibrations. The peaks at 1616.42 and 1623.17 represents the stretching of C=C aromatic rings. The peaks at 1634.74 depict the oleifinic C = C and carbonyl C= O stretching bonds. The peak at 2938.68 cm-1 assigned for CH2 stretching vibrations in is shown in untreated powder. The sharp peak at 3253.09 cm-1 denots the presence of C–H stretching vibrations. Further, the band peaks at 3322.53, 3334.10, 3345.67 and 3355.32 cm-1 are assigned for the bounded –OH and –NH groups and –OH stretching or NH2 stretching bonds.
3.1.2 FTIR spectrum of Bromo Phenol Blue treated with Sargassum muticum powder:
FTIR measurements for Bromo Phenol Blue loaded algal biomass are shown in fig. 1 (b). The sharp peak at 1234.50 cm-1 is shifted to 1236.42 cm-1 denoting the involvement and participation of SO3 streching in biosorption. The shifting of band from 1602.91 cm-1 to 1616.42 cm-1 indicates the involvement of streching of C=C aromatic rings. The bands at 3177.86, 3198.11 and 3209.69 cm-1 (assigned for the presence of C–H stretching vibrations respectively) are not shown in untreated biomass. The characteristic of stretching modes of O–H (indicated by the band at 3312.88 cm-1) is also not seen in untreated biomass.
450 600 750 900 1050 1350 1650 1950 2400 3000 3600 1/cm 15 22.5 30 37.5 45 52.5 60 67.5 75 82.5 90 %T 33 12 .8 8 32 65 .6 3 32 09 .6 9 31 98 .1 1 31 77 .8 6 31 48 .9 3 30 48 .6 2 30 31 .2 6 29 69 .5 4 28 93 .3 5 28 71 .1 7 23 60 .0 1 16 53 .0 7 16 35 .7 1 16 16 .4 2 16 02 .9 1 13 62 .7 7 13 39 .6 2 13 19 .3 7 12 34 .5 0 12 01 .7 0 11 55 .4 1 11 04 .2 9 10 68 .6 1 10 57 .0 4 10 36 .7 8 95 7. 70 89 5. 01 87 5. 72 78 1. 20 64 9. 07 61 7. 25 51 6. 94 42 5. 32 MBPB
[image:2.595.322.550.102.231.2]Fig. 1 (b) FTIR spectrum of Bromo Phenol Blue treated Sargassum muticum powder
Table-1
Shift of FTIR peaks for untreated and Sargassum
muticum powder treated Bromo Phenol Blue dye
S.
No. untreated Peaks in powder, cm-1 Peaks in treated powder, cm-1 Description
1 --- 425.32 Furan 1,4
cyclooctateraene ring breathing in phase 2 472.58 --- 1,4 swinging in-plane 3 477.40 --- Weak benzene ring
deformation
4 500.55 --- 1,3 and 2,4 symmetric deformation out of phase cyclooctateraene ring deformation 5 513.09 --- 2,4 benzene
asymmetric deformation
6 --- 516.94 2,4 benzene asymmetric deformation
7 528.16 --- 2,4 benzene asymmetric deformation
8 558.42 --- 2,4 benzene asymmetric deformation
9 612.43 --- 2,4 benzene deformation out of phase
10 --- 617.25 2,4 benzene deformation out of phase
11 --- 649.07 Weak benzene ring deformation
12 781.20 781.20 Weak benzene ring deformation
[image:2.595.55.275.257.410.2]© 2016, IRJET | Impact Factor value: 4.45 | ISO 9001:2008 Certified Journal | Page 1460 from ester sulphonate
15 --- 957.70 S = O and S–O stretching bond
16 --- 1036.78 C–H bending vibrations 17 1039.68 --- C–H bending vibrations 18 1056.07 --- C–H bending vibrations 19 --- 1057.04 C–H bending vibrations 20 --- 1068.61 C–H bending vibrations 21 1070.54 --- –C–O benzene ring
stretching
22 1099.47 --- –C–O benzene ring stretching
23 --- 1104.29 C–O stretching 24 1153.48 --- C–O stretching 25 --- 1155.41 C–O stretching 26 1201.70 1201.70 C–O stretching 27 --- 1234.50 -SO3 stretching
28 1236.42 --- -SO3 stretching
29 1244.14 --- -SO3 stretching
30 1318.40 --- –CH2 bending vibrations
31 --- 1319.37 –CH2 bending vibrations
32 --- 1339.62 –CH2 bending vibrations
33 --- 1362.71 –CH2 bending vibrations
34 1362.77 --- –CH2 bending vibrations
35 1373.38 --- –CH2 bending vibrations
36 1418.71 --- C–N stretching
37 1516.11 --- Amide N–H bending vibrations
38 --- 1602.91 Stretching of C = C aromatic rings
39 1616.42 1616.42 Stretching of C = C aromatic rings
40 1623.17 --- Stretching of C = C aromatic rings
41 1634.74 --- Oleifinic C = C and Carbonyl C = O stretching
42 --- 1635.71 Oleifinic C = C and Carbonyl C = O stretching
43 1645.35 --- Oleifinic C = C and Carbonyl C = O stretching
44 1652.10 --- Oleifinic C = C and Carbonyl C = O stretching
45 --- 1653.07 Assymetric stretching vibration of C = O 46 --- 2360.01 C N in the
polyacrylnitrile 47 2871.17 2871.17 C–H-stretching
48 --- 2893.35 CH2 stretching
vibrations
49 2894.31 --- CH2 stretching
vibrations
50 2911.67 --- CH2 stretching
vibrations
51 2927.10 --- CH2 stretching
vibrations
52 2938.68 --- CH2 stretching
vibrations
53 --- 2969.54 CH2 stretching
vibrations 54 3031.26 3031.26 C-H-stretching
vibrations 55 3048.62 3048.62 C-H-stretching
vibrations 56 3064.06 --- C-H-stretching
vibrations 57 3106.49 --- C-H-stretching
vibrations 58 --- 3148.93 C-H-stretching
vibrations 59 3149.89 --- C-H-stretching
vibrations 60 --- 3177.86 C-H-stretching
vibrations 61 --- 3198.11 C-H-stretching
vibrations 62 --- 3209.69 C-H-stretching
vibrations 63 3229.94 --- C-H-stretching
vibrations 64 3244.41 --- C-H-stretching
vibrations 65 3253.09 --- C-H-stretching
vibrations 66 --- 3265.63 C-H-stretching
vibrations 67 3266.59 --- C-H-stretching
vibrations 68 3282.02 --- C-H-stretching
vibrations 69 3299.38 --- C-H-stretching
vibrations
70 3310.95 --- O-H-stretching modes 71 --- 3312.88 O-H-stretching modes 72 3322.53 --- Bounded –OH and –NH
groups
73 3334.10 --- Bounded –OH and –NH groups
74 3345.67 --- –OH stretching or –NH2
stretching
75 3355.32 --- –OH stretching or –NH2
stretching
© 2016, IRJET | Impact Factor value: 4.45 | ISO 9001:2008 Certified Journal | Page 1461 The sharp peaks of 1010.70 and 1070.49 cm-1 arose
suddenly after loading of Bromo Phenol Blue due to the involvement of C–O stretching of alcohols and carboxylic acids and –C–O benzene ring stretching respectively. Further, three additional peaks at 1471.69, 1506.41 and 1521.84 cm-1 denoting stretching of C=C aromatic rings and
1568.13 cm-1 for amide N-H bending vibrations have
suddenly appeared in Bromo Phenol Blue treated biomass. The peak appearing at 2343.51 cm-1 in Bromo Phenol Blue
treated powder is denoting phosphate ester group and is not seen in native biomass. The peaks at 3523.95 and 3566.38 cm-1 are obtained in treated biomass due to the involvement
of the stretching vibration bands of hydroxyl group. This may be due to the adjustment of pH and physical disruption of cell walls upon the vigorous shaking.
3.1.3 X-Ray Diffraction:
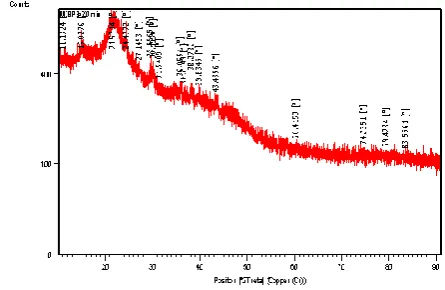
The X-Ray Diffractograms (XRD) of the powder samples are taken using a Rigaku Ultima model IV. The diffracted X-ray intensities are recorded as a function of 2 by using copper target (Cu-K radiation with wave length, = 1.5492 A0) at a
scan speed of 20/min. XRD patterns are recorded from 3 to
900. Different phases of the samples in figs. 2 (a) & 2(b) are
identified by comparing a set of‘d’ values and the corresponding intensities with the standards from the ICDD (International Center for Diffraction Data) files. XRD pattern does not show very sharp and distinct peaks and exhibits more or less amorphous nature [8-12]. The peaks at 2θ values of 0.8491, 0.8403, 0.7679, 0.9931 and 0.9782 corroborate the presence of Fe2H474K44Na10,
Ce2H124K0.5N13.5O157P4W34, C162Cl20N8O80Pd4Si2W20,
Li53.33N32Ti10.67 and CaCrO4. Their corresponding d-values
are 5.8231, 3.3583, 4.6898, 4.0057 and 3.6550 respectively
.
Fig. 2 (a) XRD pattern of Bromo Phenol Blue untreated Sargassum muticum powder
Fig. 2 (b) XRD pattern of Bromo Phenol Blue untreated Sargassum muticum powder with matching
compounds
XRD patterns of untreated powder are shown in figs. 2 (c) & (d). XRD patterns shown in figs. 2(c) & (d) do not indicate sharp peaks, less crystallinity and exhibit little amorphous nature. The peaks at 2θ values of 0.840, 0.8314, 0.7973, 0.7523 and 0.7090 corroborate the presence of F39Sb9Sn4,
Ba8Si5Sn4, C36I6N12S3Zn3, C60S16 and AgF11Sb2 (ICDD files).
Their corresponding d-values are 1.1840, 2.3731, 2.2871, 2.3437 and 1.8213.
3.1.4 XRD for Bromo Phenol Blue dye treated with
Sargassum muticumpowder
XRD patterns for treated powder [Figs. 2(c) & 2(d)] exhibit good crystallinity, more amorphous nature and increase in surface area and porosity. The peaks at 2θ values of 25.597, 11.30, 20.374, 13.421, 12.02, 12.14, 10.029 and 10.963 corroborate the presence of Sn(HPO4)2H20,
Cd3(P3O9)2(H2O)10, Co5(O9.48H8.52)NO3, C14H8O2, C6H15CrO3,
C15H21CoO6 and Mg2(Al4Si5O18). Their corresponding
d-values are 3.4800, 7.8300, 4.3553, 7.6600, 7.3630, 7.29, 8.82 and 8.07.
[image:4.595.52.268.501.648.2] [image:4.595.319.542.527.672.2]© 2016, IRJET | Impact Factor value: 4.45 | ISO 9001:2008 Certified Journal | Page 1462
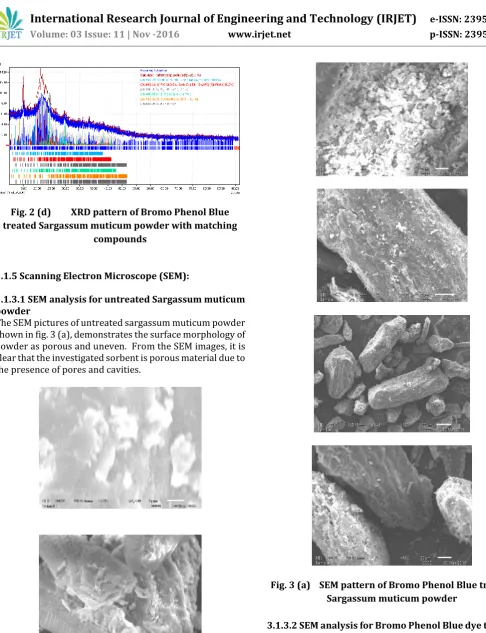
Fig. 2 (d) XRD pattern of Bromo Phenol Blue treated Sargassum muticum powder with matching
compounds
3.1.5 Scanning Electron Microscope (SEM):
3.1.3.1 SEM analysis for untreated Sargassum muticum powder
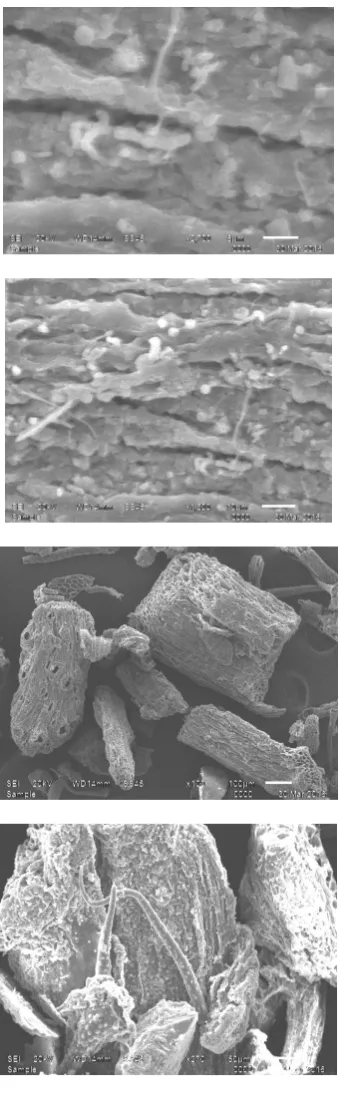
The SEM pictures of untreated sargassum muticum powder shown in fig. 3 (a), demonstrates the surface morphology of powder as porous and uneven. From the SEM images, it is clear that the investigated sorbent is porous material due to the presence of pores and cavities.
Fig. 3 (a) SEM pattern of Bromo Phenol Blue treated Sargassum muticum powder
3.1.3.2 SEM analysis for Bromo Phenol Blue dye treated with Sargassum muticum powder
[image:5.595.41.528.37.671.2] [image:5.595.78.245.423.701.2]© 2016, IRJET | Impact Factor value: 4.45 | ISO 9001:2008 Certified Journal | Page 1463 surface area. The similar results were reported on lead with
plant biosorbent, areca catechu powder.
Fig. 3 (b) SEM pattern of Bromo Pheno Blue treated Sargassum muticum powder
3.2 Equilibrium studies on biosorption of Bromo Phenol Blue
3.2.1 Effect of agitation time:
[image:6.595.77.247.131.687.2]© 2016, IRJET | Impact Factor value: 4.45 | ISO 9001:2008 Certified Journal | Page 1464
Agitation time, t, min
0 20 40 60 80 100 120 140 160 180 200
% r e m o v a l o f B P B d y e 0 10 20 30 40 50 60 70 80 % removal
dP = 52 m T = 308 K Co = 20 mg/L
w = 10 g/L pH = 7 Biosorbent = Sargassum muticum powder
Fig. 4. Effect of agitation time on % biosorption of BPB dye
3.2.2 Effect of biosorbent size:
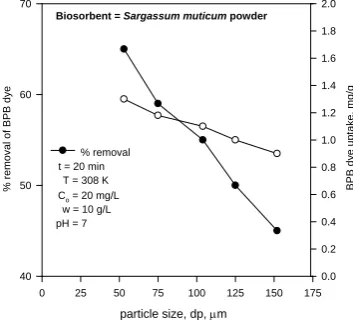
The variations in % biosorption of Bromo Phenol Blue with biosorbent size are drawn in fig. 5. The percentage biosorption is increased from 45 to 65 % as the biosorbent size decreases from 152 to 53μm. The surface area of the biosorbent increases as the size of the particle decreases and the number of active sites on the biosorbent are better exposed to the biosorbate [17-21].
particle size, dp, m
0 25 50 75 100 125 150 175
% r e m o v a l o f B P B d y e 40 50 60 70 B P B d y e u p ta k e , m g /g 0.0 0.2 0.4 0.6 0.8 1.0 1.2 1.4 1.6 1.8 2.0 % removal t = 20 min
T = 308 K Co = 20 mg/L
w = 10 g/L pH = 7
[image:7.595.80.258.87.263.2]Biosorbent = Sargassum muticum powder
Fig. 5. Effect of biosorbent size on % biosorption 3.2.3 Effect of pH in aqueous solution:
A plot is drawn in fig. 6 between % biosorption of Bromo Phenol Blue and pH of aqueous solution. A significant increase in percentage biosorption of Mn is observed as pH is increased from 2 to 4 and downward trend of the % biosorption is noted with an increase in pH above 4. For a typical experiment with 50 mL of aqueous solution, adding a biosorbent dosage of 10 g/L of 53 μm size, the extent of biosorption is increased from 65 to 86 % in the pH range from 2 to 4. The results indicate that the chemical interactions may have been exchanged between the ions. The carbony, hydroxyl, carbonyl and amide groups of the biomass are mainly involved in the biosorption of Bromo Phenol Blue. Further, presence of -SO3 stretching, S = O and C–S–O bands, from ester sulfonate groups are very rich due
to their ion-exchange involvement in biosorption. Similar results were reported for biosorption [22-26] of different heavy dyes on various algae species.
pH of aqueous solution
1 2 3 4 5 6 7 8 9 10
% r e m o v a l o f B P B d y e 60 65 70 75 80 85 90 95 B P B d y e u p ta k e , m g /g 1.0 1.2 1.4 1.6 1.8 2.0
% removal of BPB dye BPB dye uptake
dP = 52 m Co = 20 mg/L
w = 10 g/L t = 20 min T = 308 K Biosorbent = Sargassum muticum powder
Fig. 6 Effect of pH on % biosorption 3.2.4 Effect of initial concentration of Bromo Phenol
Blue:
The effect of initial concentration of Bromo Phenol Blue in the aqueous solution on the percentage biosorption at equilibrium agitation time is shown in fig. 7. The % biosorption is gradually decreased from 86 to 50 % (10 to 1.72 mg/g) by increasing Bromo Phenol Blue Co from 20 to 200 mg/L. Lesser percentage of BPB is removed for higher concentration of BPB in the aqueous solution [27-31]. This behavior is due to the increase in the amount of biosorbate to the unchanging number of available active sites on the biosorbent.
Initial concentration of aqueous BPB dye solution, mg/L
0 20 40 60 80 100 120 140 160 180 200 220
% r e m o v a l o f B P B d y e 40 45 50 55 60 65 70 75 80 85 90 B P B d y e u p ta k e , m g /g 0 3 6 9 12 15
% removal of BPB dye BPB dye uptake, mg/g
pH = 4 w = 10 g/L T = 308 K
t = 20 min dP = 52 m
[image:7.595.342.521.136.298.2]Biosorbent = Sargassum muticum powder
Fig. 7 Effect of initial concentration for the biosorption 3.2.5 Effect of biosorbent dosage:
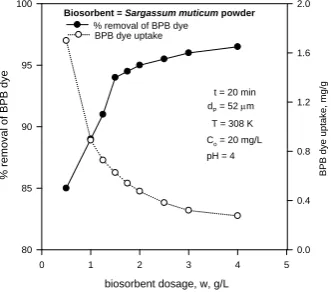
[image:7.595.71.248.402.562.2] [image:7.595.341.522.492.654.2]© 2016, IRJET | Impact Factor value: 4.45 | ISO 9001:2008 Certified Journal | Page 1465 because the number of active sites available for dye uptake
would be more as the amount of the biosorbent is increased. The increase in % biosorption is not appreciable (94 to 96.5 %) as w is increased from 1.5 to 4 g/L. All other experiments are conducted at w = 1.5 g/L.
biosorbent dosage, w, g/L
0 1 2 3 4 5
% r e m o v a l o f B P B d y e 80 85 90 95 100 B P B d y e u p ta k e , m g /g 0.0 0.4 0.8 1.2 1.6 2.0
% removal of BPB dye BPB dye uptake
t = 20 min dP = 52 m
T = 308 K Co = 20 mg/L pH = 4 Biosorbent = Sargassum muticum powder
Fig. 8 Effect of biosorbent dosage on % biosorption 3.2.6 Effect of Temperature:
The effect of temperature on the equilibrium dye uptake was significant. The effect of changes in the temperature on the BPB dye uptake is shown in Fig. 9. Results indicate that the adsorption capacity of Saragassum muticum for the BPB red increased with temperature. This may be a result of increase in the mobility of the large dye ion with temperature [36-40]. An increasing number of molecules may also acquire sufficient energy to undergo an interaction with active sites at the surface. Furthermore, increasing temperature may produce a swelling effect within the internal structure of the saragassum muticum enabling large dyes to penetrate further.
Temperature, T, K
280 290 300 310 320 330
% r e m o v a l o f B P B d y e 85 90 95 100 B P B d y e u p ta k e , m g /g 0.55 0.56 0.57 0.58 0.59 0.60 0.61 0.62 0.63 0.64 0.65
% removal of BPB dye BPB dye uptake
pH = 4 Co = 20 mg/L
w = 30 g/L t = 20 min dP = 52 m Biosorbent = Sargassum muticum powder
Fig. 9 Effect of temperature for the biosorption
3.2.7 Isotherms:
3.2.7.1 Langmuir Isotherm
Langmuir isotherm is the most widely used simple two- parameter equation. This simple isotherm is based on following assumptions:
Adsorbate is chemically adsorbed at a fixed number of well- defined sites
Each site can hold only one adsorbate species
All sites are energetically equivalent
There are no interactions between the adsorbate species
The Langmuir relationship is hyperbolic and the equation is:
q
e/q
m= K
LC
e/ (1+K
LC
e)
The above equation can be rearranged as
(C
e/q
e) = 1/(K
Lq
m) + C
e/q
mFrom the plots between (Ce/qe) and Ce, the slope {1/ (KLqm)}
and the intercept (1/qm) can be calculated. Further analysis
of Langmuir equation can be made on the basis of separation factor [RL =1/ (1+KLCe)].
Langmuir isotherm is drawn between Ce/qe and Ce in fig. 10 for the present data. The resulting equation is
(Ce/qe) = 0.0854 Ce + 1.5926
The (correlation coefficient of 0.9977) confirms strong binding of Bromo Phenol Blue ions to the surface of
Sargassum muticum powder.
Ce, mg/L
0 10 20 30 40 50 60 70 80 90 100 110 120
Ce / qt , g /L 1 2 3 4 5 6 7 8 9 10 11 12
pH = 4 w = 10 g/L T = 303 K t = 20 min
Ce/q e
= 0 .085
4 Ce + 1
.592 6;
R
2 = 0 .997
7
[image:8.595.79.245.162.308.2]dP = 53 m Biosorbent = Sargassum muticum powder
Fig. 10 Langmuir isotherm for biosorption
3.2.7.2 Freundlich isotherm:
[image:8.595.352.514.481.645.2] [image:8.595.71.251.502.659.2]© 2016, IRJET | Impact Factor value: 4.45 | ISO 9001:2008 Certified Journal | Page 1466
q
e= K
fC
enwhere Kf, mg/g represents the adsorption
capacity at dye equilibrium concentration and n represents
the degree of dependence of adsorption. Taking ln on both sides, we get
ln q
e= ln K
f+ n ln C
e
Freundlich isotherm, drawn between ln Ce and ln qe in fig. 11 has resulted in the following equation
ln qe = 0.4937 ln Ce + 0.1431
The equation has a correlation coefficient of 0.9752. The ‘n’ value of 0.600508 indicates favorable biosorption satisfying the condition of 0<n<1.
b[0] = -0.2714745447 b[1] = 0.4129126739 r ² = 0.9335831928
pH = 4 w = 40 g/L T = 303 K t = 50 min
ln Ce
1 2 3 4 5 6
ln
qe
0.0 0.5 1.0 1.5 2.0 2.5 3.0
pH = 4 w = 10 g/L T = 308 K t = 20 min
ln q
e
= 0 .493
7 ln Ce +
0.14 31;
R
2 = 0 .975
2
dP = 53 m Biosorbent = Sargassum muticum powder
Fig. 11 Freundlich isotherm for biosorption
3.2.7.3 Temkin isotherm:
Temkin and Pyzhev isotherm equation describes the behavior of many adsorption systems on heterogeneous surface and is based on the equation:
qe=RT ln(ATCe)/bT
The linear form of Temkin isotherm is qe = (RT/ bT ) ln(AT) + (RT/bT) ln(Ce)
Where AT= exp [b (0) x b (1) / RT] Slope, b (1) = RT/ bT
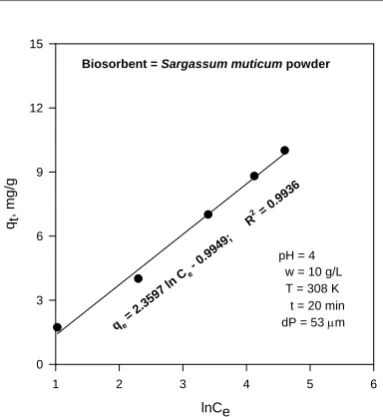
Intercept, b (0) = (RT/ bT ) ln (AT) Plot between qe and ln Ce is shown in fig. 12. The equation for Bromo Phenol Blue biosorption is
qe = 2.3597 ln Ce – 0.9949
lnCe
1 2 3 4 5 6
qt,
m
g
/g
0 3 6 9 12 15
pH = 4 w = 10 g/L T = 308 K t = 20 min
qe =
2.3 597
ln Ce - 0.
9949 ;
R
2 = 0 .993
6
dP = 53 m Biosorbent = Sargassum muticum powder
Fig. 12 Temkin isotherm for biosorption
[image:9.595.337.529.83.292.2]The isotherm constants are compiled in table-5.2. It is found that biosorption data are well represented by Langmuir isotherm (R2=0.9977), Temkin (R2=0.9936) and Freundlich isotherms (R2=0.9752) [41-46].
Table - 2
Isotherm constants (linear method)
Langmuir
isotherm Freundlich isotherm isotherm Temkin qm = 11.7096
mg/g Kf = 1.153845 mg/g AT = 0.655982 L/mg KL = 0.053623 n = 0.600508 bT = 1085.185 R2 = 0.9977 R2 = 0.9752 R2 = 0.9936
3.2.8 Kinetics
[image:9.595.83.241.255.414.2]© 2016, IRJET | Impact Factor value: 4.45 | ISO 9001:2008 Certified Journal | Page 1467
Agitation time, t, min
0 5 10 15 20 25
lo
g
(qe -qt)
-1.2 -1.0 -0.8 -0.6 -0.4 -0.2 0.0 0.2 0.4
dP = 53 m T = 308 K Co = 20 mg/L
w = 10 g/L pH = 7
log (q
e-q t) =
-0 .0470
4 t + 0 .0317
7 R2
[image:10.595.70.252.92.280.2]=0 .9901 Biosorbent = Sargassum muticum powder
Fig.13 First order kinetics for biosorption
Agitation time, t, min
0 5 10 15 20 25
t
/
qt
0 4 8 12 16 20
dP = 53 m
T = 308 K Co = 20 mg/L
w = 10 g/L pH = 7
t/qt = 0
.766 5 t +
2.2 7789
5; R
2 = 0 .970
26
Biosorbent = Sargassum muticum powder
Fig.14 Second order Kinetics for biosorption
Table – 3
Equations and rate constants
Order Equation Rate
constant R
2
Lagergren
first order log (q
e-qt) = –
0.04704 t – 0.03177
0.108333 min-1
0.9901
Pseudo
second order t/qt = 0.7665 t + 2.77895 0.211419 g/ (mg-min) 0.97026
3.2.9 Thermodynamics:
Van’t Hoff’s plot is drawn in fig. 15. From the data, Gibbs free energy change (∆G) is calculated to be –15875 J/mol for biosorption of Bromo Phenol Blue. The negative ∆G value indicates thermodynamically feasible and spontaneous nature of biosorption. The ∆H parameter is 17.92575 kJ/mol.K. The negative ∆H indicates the exothermic nature of biosorption. ∆S parameter is found to be 52.45206 J/mol K for Bromo Phenol Blue biosorption [52-55]. The positive ∆S value suggests an increase in the randomness at the solid /solution interface during biosorption.
1/ T x 103, K
3.0 3.2 3.4 3.6 3.8
lo
g
(qe
/C
e
)
-0.70 -0.65 -0.60 -0.55 -0.50 -0.45 -0.40 -0.35 -0.30 -0.25 -0.20 -0.15 -0.10
pH = 4 Co = 20 mg/L
w = 30 g/L t = 20 min dP = 53 m
log q
e/C
e = -0
.9 36
21 / T +
2.7 39
42 ;
R2 = 0
.9 369
Biosorbent = Sargassum muticum powder
Fig.15 Vant Hoff’s plot for biosorption
3.2.10 Optimization using Response Surface Methodology (RSM):
3.2.10.1 Optimization using CCD
The parameters that have greater influence over the response are to be identified so as to find the optimum condition for the biosorption of Bromo Phenol Blue ions. The quadratic model is used in the present study, to relate four independent variables and percentage biosorption of Bromo Phenol Blue. The regression equation for is % biosorption of Bromo Phenol Blue (Y) is function of pH (X1), Co (X3), w (X2) and T (X4)[223-246].
The variations in the corresponding coded values of four parameters and response are presented in table-4
Table-4
Levels of different process variables in coded and un-coded form for % biosorption of Bromo Phenol Blue
[image:10.595.334.530.244.432.2] [image:10.595.67.256.323.508.2]© 2016, IRJET | Impact Factor value: 4.45 | ISO 9001:2008 Certified Journal | Page 1468 The following equation represents multiple regression
analysis of the experimental data for the biosorption of Bromo Phenol Blue:
Y = –1364.39 + 37.32 X1 + 2.39 X2 + 4.23 X3 + 8.49 X4 –
4.53 X12 – 0.06 X22 – 0.07 X32 – 0.01 X42 + 0.00 X1X2 –
0.01 X1X3 – 0.00 X1X4 + 0.00 X2X3 – 0.00 X2X4 + 0.00 X3X4
Table-5
Results from CCD for Bromo Phenol Blue biosorption by Sargassum muticum powder
Run
no. X1 X2 X3 X4
% biosorption of Bromo Phenol Blue Experimental Predicted 1 3 15 25 293 85.98 86.01 2 3 15 25 313 87.50 87.48 3 3 15 35 293 88.08 88.07 4 3 15 35 313 89.58 89.56 5 3 25 25 293 84.08 84.09 6 3 25 25 313 85.52 85.50 7 3 25 35 293 86.52 86.50 8 3 25 35 313 87.90 87.93 9 5 15 25 293 86.40 86.38 10 5 15 25 313 87.78 87.79 11 5 15 35 293 88.18 88.19 12 5 15 35 313 89.62 89.61 13 5 25 25 293 84.48 84.49 14 5 25 25 313 85.80 85.82 15 5 25 35 293 86.62 86.64 16 5 25 35 313 88.02 87.99 17 2 20 30 303 77.86 77.85 18 6 20 30 303 78.32 78.30 19 4 10 30 303 91.58 91.58 20 4 30 30 303 88.08 88.05 21 4 20 20 303 87.36 87.34 22 4 20 40 303 91.58 91.57 23 4 20 30 283 89.28 89.25 24 4 20 30 323 92.08 92.08 25 4 20 30 303 96.22 96.22 26 4 20 30 303 96.22 96.22 27 4 20 30 303 96.22 96.22 28 4 20 30 303 96.22 96.22 29 4 20 30 303 96.22 96.22 30 4 20 30 303 96.22 96.22
Experimental conditions [Coded Values] and observed response values of central composite design with 24 factorial
runs, 6- central points and 8- axial points. Agitation time fixed at 60 min and biosorbent size at 53 μm
Table- 6 represents the results obtained in CCD. Response obtained from regression in eq. in the form of ANOVA is presented. From the Fisher’s F-test (Fmodel = 285.1025) and a very low probability value (Pmodel > F=0.000000), it is known from table–7 that the model is highly significant. At 5% level, the computed F-value (F0.05 (14.15) = MSmodel/MSerror = 285.1025) is greater than that of the tabular F-value (F0.05 (14.15) tabulars = 2.42), indicating that the treatment differences are significant
Table-6
ANOVA of Bromo Phenol Blue biosorption for entire quadratic model
Source of variatio
n
SS Df
Mean square(
MS)
F-value P > F
Model 120.701 14 8.6215 285.102 0.0000
Error 0.4536 15 0.03024
Total 121.155
df- degree of freedom; SS- sum of squares; F- factor F; P- probability
R2=0.99999; R2 (adj):0.99998:
The larger the value of t and smaller the value of P, the more significant is the corresponding coefficient term. The‘t’ and ‘P’ values are analyzed from table-6.8. It is found that the X1, X2, X3, X4, X12 , X22 , X32 , X42 X1X2, X1X3, X2X3 and X2X4 have high significance to explain the
Table-7 Estimated regression coefficients for the Bromo Phenol Blue biosorption onto Sargassum
muticum powder
Terms
Regressio n coefficien
t
Standard error of
the coefficie
nt
t-value value P
-Mean -1364.39 4.151 -328.6 0.000 Dosage (L) 37.32 0.175 213.15 0.000 Var Name Range and levels
-2 -1 0 1 2 X1 pH 2 3 4 5 6 X2 Initial
© 2016, IRJET | Impact Factor value: 4.45 | ISO 9001:2008 Certified Journal | Page 1469 Dosage (Q) -4.53 0.004 -1076 0.000
Conc, (L) 2.39 0.035 68.25 0.000 Conc, (Q) -0.06 0.000 -379 0.000 pH (L) 4.23 0.035 119.1 0.000 pH (Q) -0.07 0.000 -401 0.000 Temp (L) 8.49 0.025 327.4 0.000 Temp (Q) -0.01 0.000 -329 0.000 1L by 2L 0.00 0.001 0.68 0.506 1L by 3L -0.01 0.001 -11.5 0.000 1L by 4L -0.00 0.000 -3.40 0.003 2L by 3L 0.00 0.000 15.64 0.000 2L by 4L -0.00 0.000 -3.40 0.003 3L by 4L 0.00 0.000 0.68 0.506 ainsignificant (P ≥ 0.05)
individual and interaction effect of independent variables on Bromo Phenol Blue biosorption. The other terms (X1X2, X1X4, X2X3, X2X4 and X3X4) are insignificant and are not required to explain biosorption. The model is reduced to the following form by removing insignificant terms.
Y = –1364.39 + 37.32 X1 + 2.39 X2 + 4.23 X3 + 8.49 X4 –
4.53 X12 – 0.06 X22 – 0.07 X32
– 0.01 X42 – 0.01 X1X3
[image:12.595.321.548.91.267.2]A synergistic effect is indicated by positive sign of the coefficient which means response increases with an increase in effect, while an antagonistic effect is indicated by a negative sign which means response decreases with an increase in effect. In the observed response values, a measure of the models variability is provided by the correlation coefficient (R2). In the present study, the value of the regression coefficient (R2 = 0.9999) for eq. indicates that 0.001 % of the total variations are not satisfactorily explained by the model. It is proved from that table that Fstatistics value for entire model is higher. This large value means that % biosorption can be adequately explained by the model equation. Generally P values lower than 0.05 indicates that the model is considered to be statistically significant at 95% confidence level. The % biosorption prediction from the model is shown in table-6.6. It is implied from table-6.8 that all the squared terms of all the variables and the linear terms are significant (P < 0.05). Among the interaction terms, all the terms (P < 0.05) are insignificant on the biosorption capacity. Fig.5.16 shows normal probability plot (NPP) of residual values. It could be seen that the experimental points are reasonably aligned suggesting normal distribution.
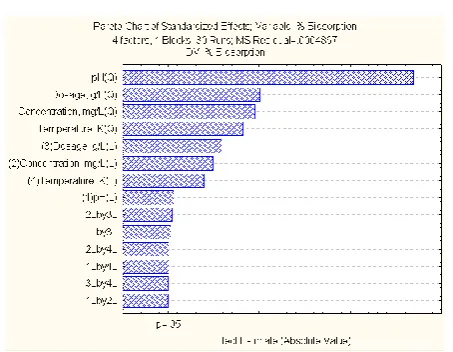
Fig. 16 Pareto Chart
5.6.2 Interaction effects of biosorption variables:
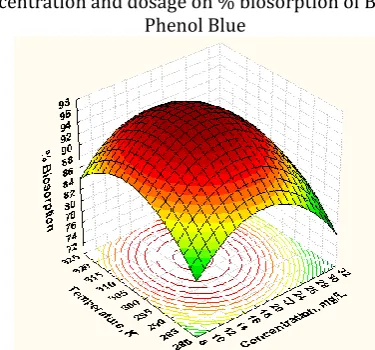
[image:12.595.316.550.403.577.2]The three-dimensional view of response surface contour plots [Fig. 18 (a) to (f)] show % biosorption as a function of for various combinations of independent variables. The plots are represented as a function of two factors at a time keeping other factors fixed at zero level,.
Fig. 17 Normal probability plot for % biosorption of Bromo Phenol Blue
© 2016, IRJET | Impact Factor value: 4.45 | ISO 9001:2008 Certified Journal | Page 1470 The predicted optimal set of conditions for percentage
biosorption of Bromo Phenol Blue is
pH of aqueous solution = 4.0094
Initial Bromo Phenol Blue dye conc = 18.6548 mg/L Biosorbent dosage = 31.5332 g/L
Temperature = 305.5716 K
% biosorption of Bromo Phenol Blue = 96.5926
The optimal set of conditions obtained with CCD are shown in table-8 along with experimental values.
Fig. 18 (a) Surface contour plot for the effects of pH and initial Bromo Phenol Blue concentration on % biosorption
Fig. 18 (b) Surface contour plot for the effects of dosage and pH on % biosorption of Bromo Phenol Blue
Fig. 18 (c) Surface contour plot for the effects of pH and Temperature on % biosorption of Bromo Phenol Blue
Fig. 18 (d) Surface contour plot for the effects of initial concentration and dosage on % biosorption of Bromo
Phenol Blue
Fig. 18 (e) Surface contour plot for the effects of initial concentration and Temperature on % biosorption of
[image:13.595.334.534.88.280.2] [image:13.595.46.278.243.429.2] [image:13.595.329.537.313.491.2] [image:13.595.61.262.468.630.2] [image:13.595.336.524.515.690.2]© 2016, IRJET | Impact Factor value: 4.45 | ISO 9001:2008 Certified Journal | Page 1471 Fig. 18 (f) Surface contour plot for the effects of dosage
and Temperature on % biosorption of Bromo Phenol Blue
Table – 8
Comparison between optimum values from CCD and experimentation
Variable CCD Exp value
pH of aqueous solution 4.0094 4
Initial BPB dye
concentration, mg/L 18.6548 20 Biosorption dosage, w,
g/L 31.5332 30
Temperature, K 305.5716 303
[image:14.595.254.553.51.227.2]% biosorption 96.5926 95.0
Table – 9
Dyes uptake capacities for different biosorbents
Authors Biosorbent
q
t, mg/g
A. Bennani Karim et
al [56] Moroccan clay
50.25
Barka Noureddineet al [57] crystalline Hydroxy apatite
243.9
Dong Yanan et al[58] Activated Carbon
133
Fatih Deniz et al[59] Paulownia tomentosa Steud. leaf powder
0.57
George Z. Kyzas et al
[60] carbon prepared from rice husk
690
Gonul Akkaya et al[61] Dicranella varia
2000
GurusamyAnnadurai [62] Strongly Chelating Polymer chitosan
40
Hema M et al [63] acid activated low cost carbon
9.5693
Jung-Hyun Kim et al
[64] Polymer Particles
67
M. Santoshkumar et al [65]
native biomass of a new isolate of Penicillium sp
5.88
Present
investigation Sargassum muticum powder
11.7096
CONCLUSIONS
The equilibrium agitation time for BPB dye biosorption is 20 minutes. Percentage biosorption of BPB dye from the aqueous solution increases significantly with increase in pH from 2 (65 %) to 4 (86 %). The optimum dosage for biosorption is 30 g/L (0.6266 mg/g). The maximum uptake capacity of 11.7096 mg/g is obtained at 303 K. The maximum biosorption of BPB dye (96.5926 %) onto Sargassum Muticum powder is observed when the processing parameters are set as: pH = 4.0094, w = 31.5332 g/L, Co = 18.6548 mg/L and T = 305.5716 K using CCD. The thermodynamic data show that % biosorption of BPB dye is increased with increase in temperature. The investigation also reveals the endothermic nature of biosorption as ∆H is positive (17.92575), irreversible nature of biosorption as ∆S is positive (52.45206) and spontaneity of biosorption as indicated by negative ∆G (G = –15875 J/mole). With the above conclusions the authors confirm that sargassum muticum is capable of removing BPB dye.
ACKNOWLEDGEMENT
The authors express their sincere thanks and gratitude to department of chemical engineering, Andhra University for supporting financially (TEQIP) and providing space and experimental facilities. The authors also express their sincere regards to Advanced Analytical Laboratory, Andhra University for helping in studying characterization techniques like FTIR, XRD and SEM.
REFERENCES
[1] Ramachandra T.V., Ahalya N. and Rajasekara Murthy C.,
(2005) “Aquatic ecosystems: conservation, restoration and management”, Capital Publishers, New Delhi.
[2] Ramachandra T.V., Kiran R and Ahalya N (2002) Status,
Conservation and Management of Wetlands–– Allied Publishers (P) Ltd, India.
[3] R Sai Ram Seshu and Dipti Kumari, “Water Pollution: A
Major Threat to Living Forms”, Research and Reviews: Journal of Ecology and Environmental Sciences, RRJEES Volume 3 Issue 1 January - March, 2015
[4] V. Karthik , K. Saravanan , P.Bharathi , V.Dharanya ,
[image:14.595.65.271.85.282.2]© 2016, IRJET | Impact Factor value: 4.45 | ISO 9001:2008 Certified Journal | Page 1472 textile dyes”, Journal of Chemical and Pharmaceutical
Sciences, JCPS Volume 7 Issue 4, October-December 2014, 301–307.
[5] A. El-Maghraby and H.A. El Deeb, “Removal of a Basic
Dye From Aqueous Solution by Adsorption Using Rice Hulls”, Global NEST Journal, Vol 13, No 1, 2011, pp 90-98.
[6] Mustafa T. Yagub, Tushar Kanti Sen,Sharmeen Afroze
and H.M. Ang, “Dye and its removal from aqueous solution by adsorption: A review”, Advances in Colloid and Interface Science Volume 209, July 2014, Pages 172–184.
[7] E. Voudrias, K. Fytianos and E. Bozani, “Sorption -
Desorption Isotherms of Dyes from Aqueous Solutions and Wastewaters with Different Sorbent Materials”, Global Nest: the Int. J. Vol 4, No 1, 2002, pp 75-83.
[8] Allen, P. G., et al. "Investigation of aquo and chloro
complexes of UO22+, NpO2+, Np4+, and Pu3+ by X-ray absorption fine structure spectroscopy."Inorganic chemistry 36.21 (1997): 4676-4683.
[9] Bradder, Philip, et al. "Dye adsorption on layered
graphite oxide." Journal of Chemical & Engineering Data 56.1 (2010): 138-141.
[10] Burnside, Shelly D., et al. "Self-organization of TiO2
nanoparticles in thin films." Chemistry of materials 10.9 (1998): 2419-2425.
[11] Chen, C. L., X. K. Wang, and M. Nagatsu. "Europium
adsorption on multiwall carbon nanotube/iron oxide magnetic composite in the presence of polyacrylic acid." Environmental science & technology 43.7 (2009): 2362-2367.
[12] Chen, Changlun, et al. "Adsorption behavior of multiwall
carbon nanotube/iron oxide magnetic composites for Ni (II) and Sr (II)." Journal of hazardous materials 164.2 (2009): 923-928.
[13] Namasivayam C, Kavitha D. Removal of Congo Red from
water by adsorption onto activated carbon prepared from coir pith, an agricultural solid waste. Dyes and pigments. 2002 Jul 31; 54(1):47-58.
[14] Garg VK, Gupta R, Yadav AB, Kumar R. Dye removal from
aqueous solution by adsorption on treated sawdust. Bioresource Technology. 2003 Sep 30; 89(2):121-4.
[15] Sivaraj R, Namasivayam C, Kadirvelu K. Orange peel as
an adsorbent in the removal of acid violet 17 (acid dye) from aqueous solutions. Waste management. 2001 Dec 31; 21(1):105-10.
[16] Kavitha D, Namasivayam C. Experimental and kinetic
studies on methylene blue adsorption by coir pith carbon. Bioresource Technology. 2007 Jan 31; 98(1):14-21.
[17] Ho YS, Chiang TH, Hsueh YM. Removal of basic dye from
aqueous solution using tree fern as a biosorbent. Process Biochemistry. 2005 Jan 31;40(1):119-24.
[18] Gong R, Ding Y, Li M, Yang C, Liu H, Sun Y. Utilization of
powdered peanut hull as biosorbent for removal of anionic dyes from aqueous solution. Dyes and Pigments. 2005 Mar 31;64(3):187-92.
[19] Ho YS, McKay G. A kinetic study of dye sorption by
biosorbent waste product pith. Resources, conservation and recycling. 1999 Mar 1;25(3):171-93.
[20] Robinson T, Chandran B, Nigam P. Removal of dyes from
a synthetic textile dye effluent by biosorption on apple
pomace and wheat straw. Water research. 2002 Jun 30;36(11):2824-30.
[21] Arami M, Limaee NY, Mahmoodi NM. Evaluation of the
adsorption kinetics and equilibrium for the potential removal of acid dyes using a biosorbent. Chemical Engineering Journal. 2008 May 15;139(1):2-10.
[22] Janoš P, Buchtová H, Rýznarová M. Sorption of dyes from
aqueous solutions onto fly ash. Water research. 2003 Dec 31; 37(20):4938-44.
[23] Annadurai G, Juang RS, Lee DJ. Use of cellulose-based
wastes for adsorption of dyes from aqueous solutions. Journal of hazardous materials. 2002 Jun 10; 92(3):263-74.
[24] Malik PK. Use of activated carbons prepared from
sawdust and rice-husk for adsorption of acid dyes: a case study of Acid Yellow 36. Dyes and pigments. 2003 Mar 31; 56(3):239-49.
[25] Thangamani KS, Sathishkumar M, Sameena Y,
Vennilamani N, Kadirvelu K, Pattabhi S, Yun SE. Utilization of modified silk cotton hull waste as an adsorbent for the removal of textile dye (reactive blue MR) from aqueous solution. Bioresource technology. 2007 Apr 30; 98(6):1265-9.
[26] Chiou MS, Li HY. Adsorption behavior of reactive dye in
aqueous solution on chemical cross-linked chitosan beads. Chemosphere. 2003 Mar 31; 50(8):1095-105.
[27] Ho YS, McKay G. Pseudo-second order model for
sorption processes. Process biochemistry. 1999 Jul 31; 34(5):451-65.
[28] Lee PC, Meisel D. Adsorption and surface-enhanced
Raman of dyes on silver and gold sols. The Journal of Physical Chemistry. 1982 Aug; 86(17):3391-5.
[29] Garg VK, Amita M, Kumar R, Gupta R. Basic dye
(methylene blue) removal from simulated wastewater by adsorption using Indian Rosewood sawdust: a timber industry waste. Dyes and pigments. 2004 Dec 31; 63(3):243-50.
[30] Wang S, Li H. Dye adsorption on unburned carbon:
kinetics and equilibrium. Journal of hazardous materials. 2005 Nov 11; 126(1):71-7.
[31] Tan IA, Ahmad AL, Hameed BH. Adsorption of basic dye
on high-surface-area activated carbon prepared from coconut husk: Equilibrium, kinetic and thermodynamic studies. Journal of Hazardous Materials. 2008 Jun 15; 154(1):337-46.
[32] Akar ST, Gorgulu A, Akar T, Celik S. Decolorization of
Reactive Blue 49 contaminated solutions by Capsicum annuum seeds: Batch and continuous mode biosorption applications. Chemical engineering journal. 2011 Mar 15; 168(1):125-33.
[33] Srinivasan A, Viraraghavan T. Decolorization of dye
wastewaters by biosorbents: a review. Journal of environmental management. 2010 Oct 31; 91(10):1915-29.
[34] Ncibi MC, Mahjoub B, Seffen M. Kinetic and equilibrium
studies of methylene blue biosorption by Posidonia oceanica (L.) fibres. Journal of Hazardous Materials. 2007 Jan 10; 139(2):280-5.
[35] Pavan FA, Lima EC, Dias SL, Mazzocato AC. Methylene
© 2016, IRJET | Impact Factor value: 4.45 | ISO 9001:2008 Certified Journal | Page 1473
[36] Ghosh D, Bhattacharyya KG. Adsorption of methylene
blue on kaolinite. Applied Clay Science. 2002 Feb 28;20(6):295-300.
[37] Mittal A. Adsorption kinetics of removal of a toxic dye,
Malachite Green, from wastewater by using hen feathers. Journal of hazardous materials. 2006 May 20;133(1):196-202.
[38] Ofomaja AE, Ho YS. Equilibrium sorption of anionic dye
from aqueous solution by palm kernel fibre as sorbent. Dyes and Pigments. 2007 Dec 31;74(1):60-6.
[39] Mahmoodi NM, Hayati B, Arami M, Lan C. Adsorption of
textile dyes on pine cone from colored wastewater: kinetic, equilibrium and thermodynamic studies. Desalination. 2011 Mar 1;268(1):117-25.
[40] Lee CK, Lin KS, Wu CF, Lyu MD, Lo CC. Effects of
synthesis temperature on the microstructures and basic dyes adsorption of titanate nanotubes. Journal of hazardous materials. 2008 Feb 11;150(3):494-503.
[41] Foo 55, Hameed BH. Insights into the modeling of
adsorption isotherm systems. Chemical Engineering Journal. 2010 Jan 1;156(1):2-10.
[42] Allen SJ, Mckay G, Porter JF. Adsorption isotherm models
for basic dye adsorption by peat in single and binary component systems. Journal of colloid and interface science. 2004 Dec 15;280(2):322-33.
[43] Wong YC, Szeto YS, Cheung W, McKay G. Adsorption of
acid dyes on chitosan—equilibrium isotherm analyses. Process Biochemistry. 2004 Feb 25;39(6):695-704.
[44] Vimonses V, Lei S, Jin B, Chow CW, Saint C. Kinetic study
and equilibrium isotherm analysis of Congo Red adsorption by clay materials. Chemical Engineering Journal. 2009 May 15;148(2):354-64.
[45] Khaled A, El Nemr A, El-Sikaily A, Abdelwahab O.
Removal of Direct N Blue-106 from artificial textile dye effluent using activated carbon from orange peel: Adsorption isotherm and kinetic studies. Journal of Hazardous Materials. 2009 Jun 15;165(1):100-10.
[46] Özcan A, Öncü EM, Özcan AS. Kinetics, isotherm and
thermodynamic studies of adsorption of Acid Blue 193 from aqueous solutions onto natural sepiolite. Colloids and Surfaces A: Physicochemical and Engineering Aspects. 2006 Apr 5;277(1):90-7.
[47] Wang L, Zhang J, Zhao R, Li C, Li Y, Zhang C. Adsorption
of basic dyes on activated carbon prepared from Polygonum orientale Linn: equilibrium, kinetic and thermodynamic studies. Desalination. 2010 May 15; 254(1):68-74.
[48] Uddin MT, Islam MA, Mahmud S, Rukanuzzaman M.
Adsorptive removal of methylene blue by tea waste. Journal of Hazardous Materials. 2009 May 15; 164(1):53-60.
[49] Wang S, Li H. Structure directed reversible adsorption of
organic dye on mesoporous silica in aqueous solution. Microporous and mesoporous materials. 2006 Dec 29; 97(1):21-6.
[50] Özcan AS, Erdem B, Özcan A. Adsorption of Acid Blue
193 from aqueous solutions onto BTMA-bentonite. Colloids and Surfaces A: Physicochemical and Engineering Aspects. 2005 Sep 15; 266(1):73-81.
[51] Sureshkumar MV, Namasivayam C. Adsorption behavior
of Direct Red 12B and Rhodamine B from water onto surfactant-modified coconut coir pith. Colloids and
Surfaces A: Physicochemical and Engineering Aspects. 2008 Mar 20; 317(1):277-83.
[52] Eren, E., and B. Afsin. "Investigation of a basic dye
adsorption from aqueous solution onto raw and pre-treated bentonite surfaces." Dyes and Pigments 76.1 (2008): 220-225.
[53] Hameed, B. H., A. A. Ahmad, and N. Aziz. "Isotherms,
kinetics and thermodynamics of acid dye adsorption on activated palm ash." Chemical Engineering Journal 133.1 (2007): 195-203.
[54] Wu, Zhijian, Hyeonwoo Joo, and Kangtaek Lee. "Kinetics
and thermodynamics of the organic dye adsorption on the mesoporous hybrid xerogel." Chemical Engineering Journal 112.1 (2005): 227-236.
[55] Eren, E., and B. Afsin. "Investigation of a basic dye
adsorption from aqueous solution onto raw and pre-treated sepiolite surfaces." Dyes and Pigments 73.2 (2007): 162-167.
[56] Bennani Karim , B. Mounir, M. Hachkar, M. Bakasse and
A.Yaacoubi, “Adsorption of Malachite Green dye onto raw Moroccan clay in batch and dynamic system”, Canadian Journal on Environmental, Construction and Civil Engineering Vol. 2, No. 2, February 2011
[57] Barka Noureddine, Qourzal Samir, Assabbane Ali,
Nounah Abederrahman and Ait-ichou Yhya, “Adsorption of Disperse Blue SBL dye by synthesized poorly crystalline Hydroxyapatite”, Journal of Environmental Sciences 20(2008) 1268–1272
[58] Dong Yanan , Su Yanle, Chen Wenjuan , Peng Jinming ,
Zhang Yan and Jiang Zhongyi, “Ultrafiltration Enhanced with Activated Carbon Adsorption for Efficient Dye Removal from Aqueous Solution”, Chinese Journal of Chemical Engineering, 19(5) 863—869 (2011)
[59] Fatih Deniz and Saadet D. Saygideger, “Equilibrium,
kinetic and thermodynamic studies of Acid Orange 52 dye biosorption by Paulownia tomentosa Steud. leaf powder as a low-cost natural biosorbent”, Bioresource Technology 101 (2010) 5137–5143
[60] George Z. Kyzas , Jie Fu and Kostas A. Matis, “The
Change from Past to Future for Adsorbent Materials in Treatment of Dyeing Wastewaters”, Materials 2013, 6, 5131-5158
[61] Gonul Akkaya and Ayla Ozer, “Biosorption of Acid Red
274 (AR 274) on Dicranella varia:Determination of equilibrium and kinetic model parameters”, Process Biochemistry 40 (2005) 3559–3568
[62] Gurusamy Annadurai , “Adsorption of Basic Dye on
Strongly Chelating Polymer: Batch Kinetics Studies”, Iranian PolynterJourual / Volume II Number 4 (2002)
[63] Hema M and Arivoli S., “Adsorption kinetics and
thermodynamics of malachite green dye unto acid activated low cost carbon”, J. Appl. Sci. Environ. Manage. March, 2008 ,Vol. 12(1) 43 – 51
[64] Jung-Hyun Kim and Jeong-Yeol Yoon, “Protein
Adsorption on Polymer Particles”,
[65] M. Santoshkumar, O. Anjaneya, S. Nayak Anand and T.B.