doi:10.4236/jsea.2010.31001 Published Online January 2010 (http://www.SciRP.org/journal/jsea)
Models for Improving Software System Size Estimates
during Development
William W. AGRESTI1, William M. EVANCO2, William M. THOMAS3
1Carey Business School, Johns Hopkins University, Baltimore, USA; 2Statistical Solutions, Philadelphia, USA; 3The MITRE
Corpo-ration, McLean, VA, USA.
Email: [email protected], [email protected], [email protected]
Received August 28th, 2009; revised September 16th, 2009; accepted September 29th, 2009.
ABSTRACT
This paper addresses the challenge of estimating eventual software system size during a development project. The ap-proach is to build a family of estimation models that use information about architectural design characteristics of the evolving software product as leading indicators of system size. Four models were developed to provide an increasingly accurate size estimate throughout the design process. Multivariate regression analyses were conducted using 21 Ada subsystems, totaling 183,000 lines of code. The models explain from 47% of the variation in delivered software size early in the design phase, to 89% late in the design phase.
Keywords: Software Size, Estimation, Ada, Regression, Re-Estimation, Metrics
1. Introduction
Before software development projects start, customers and managers want to know the eventual project cost with as much accuracy as possible. Cost estimation is extremely important to provide an early indicator of what lies ahead: will the budget be sufficient for this job? This need has motivated the development of software cost estimation models, and the growth of a commercial market for such models, associated automated tools, and consulting sup-port services.
When someone who is new to the use of cost estima-tion models looks at the estimaestima-tion equaestima-tion, it can be quite disconcerting. The only recognizable variable on the right-hand side is size, surrounded by a few modify-ing factors and shape parameters. So, if the project is just beginning, how do you know the size of the system? More experienced staff members explain that you must first estimate the size so that you can supply that value in the equation, thus enabling you to estimate cost. How good can the cost estimate be if it depends so strongly on a quantity that won’t be known until the end of the pro-ject? The underlying logic prompting this question is irrefutable. This situation is well known and recognized (e.g., [1, 2]). Users of such cost estimation models are dependent, first and foremost, on accurate size estimates. Of course, there are other ways to estimate costs (e.g., by analogy and experience), but the more analytically satis-fying models estimate cost as a function of size. Thus,
the need for an accurate cost estimate often translates into a need for an accurate size estimate.
This paper addresses size estimation, but distinguishes between estimation before development and during de-velopment. Size estimation prior to the start of a software project typically draws on analogy and professional judgment, with comparisons of the proposed system to previously developed systems of related functionality. Function point counts may also be used to provide an estimate of size, but, of course, the accuracy of the size estimate depends on accurate knowledge of the entities being counted.
Once the project begins, managers would like to keep improving their size estimate. However, we are moti-vated by our observations of current practice in which managers, during development, revert to predevelopment estimates of size (and effort and cost) because of a lack of effective ways to incorporate current development information to refine their initial estimates [3]. Ideally there would be straightforward methods to improve the predevelopment estimates based on early project experi-ences and the evolving product. In this paper we focus on the evolving product as a source of information for up-dating the size estimate.
the development process. The notion of a family of mod-els is intended to address the challenge of successively refining the initial estimate as the project unfolds. The research has three motivations: the widely known poor record of large software projects to be delivered on time and on budget (due in part to poor estimation capability), the persistent illogic of needing to know size to estimate cost, and the challenge of successive size reestimation during a project.
The remainder of the paper discusses related work, the design and implementation process, the estimation mod-els, the empirical study, statistical results, limitations of the analyses, and future directions.
2. Related Work
Reasonably accurate size estimates may be achievable when an organization has experience building systems in the domain of the new project. The new system may be analogous to previous ones or related to a product line that is familiar. There may even be significant reuse of class libraries, designs, interfaces, or code to make the estimation easier. But accurately estimating eventual system size grows more difficult when the new system ranks higher in novelty or, using the nomenclature of systems engineering, is unprecedented. Even when the application domains are similar, new projects may re-quire significantly more code to account for enhanced requirements for security and robustness that were not associated with previous systems.
An especially appealing category of estimation models is one that consists of models that use early constructs from the evolving system. The analyses that are closest to the research reported here were done as part of the evolution of COCOMO models over the years. CO-COMO II has the characteristic of the models being built in this paper by recognizing the need for a family of models. For COCOMO II, the models take advantage of increased learning during the project: the early prototyp-ing stage, early design stage, and postarchitecture stage [4].
As development gets underway in a project, the repre-sentations used in specification and design provide op-portunities for the measurement of key constructs used in those representations. Then models can be built to relate values from those constructs to measures of system size. This practice has been in place for decades. One of the earliest and most influential of such models was Tom DeMarco’s Bang metric that related values from data flow diagrams and other notations to eventual code size. [5]. Similar models have been built, based on capturing measures of entity-relationship and state-transition dia-grams from early system specifications [6]. Bourque and Cote [7] performed an experiment to develop and vali-date such a predictive model based on specification measures that were obtained from data flow and
entity-relationship diagrams. It was found that a model using the number of data elements crossing an elementary pro- cess in the data flow diagram as the sole explanatory variable performed fairly well as a predictive model.
Much of the research using early system artifacts for estimation is directed at estimating effort and cost. Pau- lish, et al., discussed the use of the software architecture document as the primary input to project planning [8]. Mohagheghi et al., described an effort estimation model based on the actual use cases of the system being built [9]. Pfleeger used a count of objects and methods as a size measure in a model of software effort [10]. Jensen and Bartley investigated the use of object information obtained from specifications in models of programmer effort [11]. They proposed that development effort is a function of the number of objects, operations, and inter-faces in the system, and that counts of these entities can be obtained from a textual specification.
More closely related to the current paper is reported research that is focused on estimating size. Laranjeira [12] provided a method for sizing object-oriented systems based on successive estimations of refinements of the system objects. As the system becomes more refined, a greater confidence in the size estimates is obtained. He proposed the use of statistical techniques to determine a rate of convergence to the actual estimate. The estimation is still subjective, but the method gives an indication of progress toward the convergence of the estimates, and as such provides an objective, statistically based confidence interval for the estimates.
Minkiewicz [13] offers a useful overview of the evolu-tion and value of various measures of size, including the most widely used, lines of code and function points. The model in [14] estimated size, as measured by function points [15] directly from a conceptual model of the sys-tem being built. Tan et al. built a model to estimate lines of code based on the counts of entities, relationships, and attributes from the conceptual data model [16]. A model by Diev [17] related early information on use cases into a size estimate, measured in function points. The models in [18] produce lines-of-code estimated from a VHDL-based design description. Antoniol et al. investi-gated the adapting of function points to object-oriented systems by defining object-oriented function points (OO FPs) [1]. They first identified constructs in object- ori-ented systems (e.g., classes and methods) to use as pa-rameters for OOFPs, then built a flexible model to esti-mate system size. Their pilot study showed that the model was promising as a way to estimate lines of code from OOFPs.
other data that can be used in empirical studies to de-velop size estimation models. Most similar to the re-search here are studies that developed families of models that provided a succession of estimates as more design information is known. For example, Zivkovic et al. [19] developed automated approaches to estimating function point size using UML design information, including data types and transactional types. Hericko and Zivkovic’s analysis [20] was most similar to the research reported here because it involved basing the size estimate on more detailed information about a UML design. The first esti-mate used use case diagrams, the second estiesti-mate added information from activity diagrams, and the final mate added information from class diagrams. The esti-mates, which did improve as new information was in-corporated into the models, produced an estimate meas-ured in function points, as opposed to the lines of code used in the research in this paper.
3. The Design and Implementation Process
Our analysis and model building relies on assumptions concerning the progress of design and implementation. This section discusses these assumptions.We are investigating systems that were built in Ada, which proceeds from specifying relationships among larger units (packages) to a specification of the interior details of these units. Ada was used as a design notation, which means that a machine-readable design artifact is available for observation and analysis. Royce [21] was one of the first to discuss this use of a single language in the Ada process model: “Regardless of level, the activity being performed is Ada coding. Top-level design means
coding the top-level components (Ada main programs, task executives, global types, global objects, top-level library units, etc.). Lower-level design means coding the lower-level program unit specifications and bodies.”
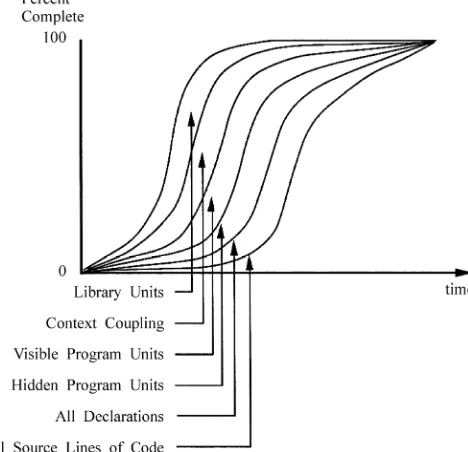
The development teams used a generic object-oriented design process with steps to identify the objects, identify the operations, establish the visibility of the operations, specify the interface, and implement the objects. Fol-lowing such a method implies that certain information about the design will be available at earlier times in the development process than other information. For exam-ple, a count of the number of operations will be available prior to a count of the number of parameters that will be needed. While there is iteration involved in the method, and the process must be repeated at various levels of ab-straction, following such a process should result in a steady release of successively more detailed information about the evolving system. Figure 1 attempts to capture this unfolding of information by showing notional growth curves for several entities in an Ada development process. The number of library units stabilizes first, fol-lowed by the context coupling, number of visible pro-gram units, and so on until finally all the source lines of code are defined when the objects are fully implemented.
[image:3.595.183.417.477.703.2]Our approach in size estimation is to take advantage of this evolving machine-readable product, using character-istics of the design artifact to refine our size estimates at successive stages in the development process, where each stage corresponds to a time when a particular aspect of the design has stabilized (e.g., a count of the number of library units).
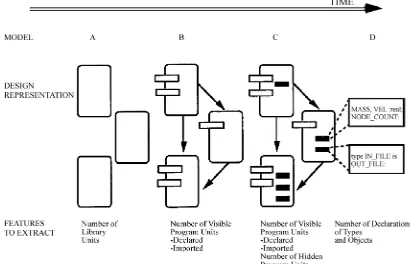
Figure 2. Four size models: design representations and features
Figure 2 depicts one view of the successive design and implementation of an Ada system. In Figure 2, we iden-tify four intermediate stages (A, B, C, and D) as the sys-tem is built.
More detailed information is available at each stage and this information can be used to obtain more accurate size estimates.
We acknowledge that the approach and, therefore, the applicability of the results, depend on the assumptions concerning how the design evolves. In the process model described here, the needed behavior and functionality of the system are first organized into loci of capabilities that are captured in the design artifact as library units. This view is consistent with Royce's identification of top-level design activities in the quote above, and with the first process step of identifying the objects. Thus, Stage A in Figure 2 corresponds to a stage where all library units have been identified.
As the design becomes more detailed, designers iden-tify the visible program units in each library unit (Stage B). The visible program units are the operations accessi-ble by other units; at this stage, designers are also identi-fying relationships among library units. For a particular library unit to fulfill its role in the design, it needs re-sources of other units and these rere-sources are provided through context coupling. This corresponds to the second and third process steps, in which the operations are iden-tified and the visibility established.
More is known about the design at Stage C. To im-plement the visible program units, the developer defines hidden program units to perform necessary, but local, functions in support of the visible operations. This stage corresponds to the process step of implementing the ob-jects.
Stage D is well into the detailed coding of the system. At this stage all declarations have been made. Admittedly, at this stage, the source lines of code are building and the actual system size (in terms of lines of code) is becoming known. However, having an explicit Stage D recognizes cases in which the declarations may be relatively com-plete, but the procedural code is not.
4. Estimation Models
The stages shown in Figure 2 provide a logical progres-sion for system development. The information available at each of these stages has the potential to be used to de-termine size estimates with greater accuracy than those estimates derived at the inception of the project. What is needed, of course, are models that show how to use the information to estimate size.
The models for estimated size (Size) are of the form: Size = alx1 + a2x2 + ...+
where Size is measured in source lines of code; x1, x2...
to be estimated; and is an error term.
Four different models were built, corresponding to the four different stages in the design phase as shown in Fig-ure 2. These models show source lines of code estimated from ----
• Model A: the number of library units.
• Model B: the number of visible and imported pro-gram units declared.
• Model C: the number of visible, imported, and hid- den program units declared.
• Model D: the number of types and objects declared. At Stage A in Figure 2, the number of library units de-fined serves as an early indicator of system size. The size model at this stage is a coefficient multiplied by the num- ber of user defined library units in the system. Thus, the model for estimating source lines of code is:
SizeA = al * (#of library units) +
Stage B is further into the design process and more is known about the details of the library units that were the basis for the estimation at Stage A. So, at Stage B, the number of visible program units declared and program units imported from other subsystems by library units through the context coupling mechanism are the parame-ters of the size model. The rationale is that the number of visible program units is a proxy for the functionality of a package. Statistically we expect that more program units will translate into a need for more lines of Ada code. The rationale for the number of imported program units is that they are being imported because they are needed, so they must enter into the code of the receiving library unit. So, if there are more imports, statistically we expect that there will be more lines of code required in the library unit. Thus, the model appears as:
SizeB = al * (# of visible program units)
+ a2 * (# of imported program units) +
At Stage C, the size estimation model depends on the same information as Stage B, but with the inclusion of the number of hidden program units. Again, hidden pro-gram units perform local processing needed to support the visible program units. The model is of the form:
SizeC = al * (# of visible program units)
+ a2 * (# of imported program units)
+ a3 * (# of hidden program units) +
As the design progresses, more detailed declarations become available. The size estimation model at stage D uses the number of declarations of types and objects as the basis for its estimate of system size. This model ap-pears as:
SizeD = al * (# of type/subtype declarations
+ #object declarations) +
5. Empirical Study
To estimate the parameters of the models, we analyzed a collection of 21 Ada subsystems, from four projects de-veloped at the Software Engineering Laboratory of the National Aeronautics and Space Administration/Goddard Space Flight Center [22]. The analysis was restricted to subsystems containing more than one Ada library unit, and consisting of at least 1,000 source lines of code. The subsystems in our data set ranged in size from 2,000 to 27,000 source lines of code, excluding comment and blank lines.
A locally developed Ada source analyzer program was used [23], although other static analysis tools could yield the same data. We extracted counts of source lines of code; library units; visible, imported, and hidden pro-gram units; and type and object declarations from the delivered product. These counts were used in regression analyses to develop models of delivered product source lines of code.
Because the explanatory variables were taken from completed project code data, we cannot make claims as to whether all of the entities (library units, visible pro-gram units declared and imported, hidden propro-gram units, and declarations) were defined at stages A, B, C, and D in strict adherence to the process model. For example, while the model for Stage B depends on the number of visible program units, and the process model calls for defining the visible program units at that stage in the process, it may be that some number of additional visible program units were added very late in the process (e.g., due to a requirements change). However, the process model does provide for successive elaboration of the design and code in a seamless way with Ada as both a design and implementation language. For example, one of the authors (WA) was technical manager of one pro-ject using this process model and had over 35,000 lines of compiled Ada at the time of Critical Design Review. That is, the compiled Ada was essentially the design structure of the system, and, because it was in Ada, it was amenable to automated analysis. If a size reestima-tion model like this is used in practice, the model could be calibrated and validated on an ongoing basis during projects, so that the model is based on the actual number of visible program units defined at Stage B.
6. Statistical Results
measured by the coefficient of determination of a regres-sion analysis) would be explained as the design phase progresses. In this section we present the results of re-gression analyses of size estimation models.
As discussed previously, these models progress through greater levels of information availability as the design progresses, and they can be used to update the size esti-mates for the purposes of project management. Regres-sion analysis was used to build the models, with the ex-pected outcome that the size estimates will become more accurate as more design information becomes available.
The regressions for all four models were linear in both the source lines of code and the explanatory variables. A zero intercept term was assumed since zero values for the explanatory variables used to explain the source lines of code would necessarily imply that no lines of code would be generated. Unpublished results of regression analyses for models with the intercept terms resulted in intercept estimates that were not significantly different from zero, a conclusion also reached by Antoniol [1].
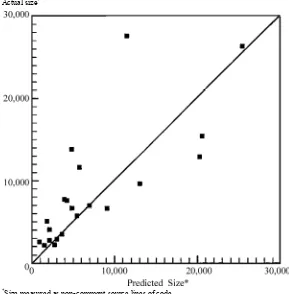
The first column of Table 1 shows the regression re-sults for Model A. These rere-sults can be translated into the equation, SizeA = 303.8 * (# of library units). The
corre-sponding predicted vs. actual plot is given in Figure 3. The adjusted R2 is 0.47 (Note 1) and the coefficient for
the number of library units is highly significant as
[image:6.595.311.535.206.364.2]meas-ured by the standard error associated with the coefficient estimate. Note that the coefficient estimate indicates that about 304 source lines of code will be generated for each library unit that is defined early in the design phase. However, the plot of Figure 3 shows a few observations for which the predicted vs. actual values are strongly discrepant.
Table 1. Linear regression results for source lines of code
Variable Model
A
Model B
Model C
Model D
Library Units 303.8
(33.6)a
Visible Program Units 48.0 36.8
(6.9) (6.6)
Imported Program Units 3.0 2.8
(0.4) (0.4)
Hidden Program Units 71.7
(21.9)
Types and Objects 22.2
(1.0)
R2 .47 .77 .87 .89
aStandard error of associated coefficient. All coefficient estimates are
significant to within the 1% level of significance.
Actual size*
*Size measured as non-comment source lines of code
[image:6.595.151.440.409.703.2]Actual size*
[image:7.595.154.439.88.379.2]*Size measured as non-comment source lines of code
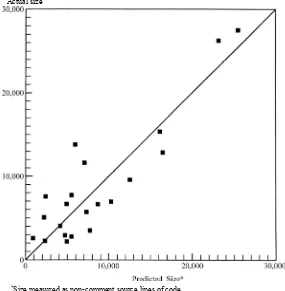
Figure 4. Model B for system size: predicted vs. actual
Actual size*
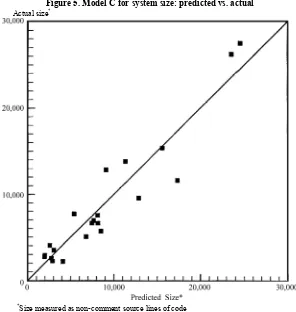
Figure 5. Model C for system size: predicted vs. actual
Actual size*
*Size measured as non-comment source lines of code
Figure 6. Model D for system size: predicted vs. actual
Model B focuses on the program units contained in the library units. More specifically, only those program units are considered that are visible, and hence can be exported or imported. The identification of such program units is expected to be the next step after the library units have been declared. Table 1 shows the regression results and Figure 4 shows the plot for Model B. This model is a substantial improvement over Model A.
The regression explains 77% of the variation in lines of code. Each visible program unit declaration contrib-utes about 48 source lines of code, while an imported program unit declaration accounts for about 3 source lines of code. The coefficient estimates are again highly significant. From Figure 4, we see that Model B leads to a significantly better fit between actual and predicted values. The outliers apparent in Figure 3 are pulled closer to the 45-degree line along which predicted values would exactly equal the actual values.
Model C is an enhancement to Model B whereby the number of hidden program units is added to the analysis. This model represents the next logical step in the devel-opment of the design. Program units, declared and hence hidden in the bodies of packages and subprograms, are identified after the overall architecture of the system is
established through the identification of visible and im-ported program units.
Table 1 shows the regression results and Figure 5 shows the plot for Model C, which explains approxi-mately 87% of the variation in source lines of code. Each visible program unit declared contributes about 37 source lines of code, each hidden program unit contributes about 72 source lines of code, and each imported program unit contributes about 3 lines of code. These coefficient esti-mates are all highly significant.
The fact that hidden program units contribute more source lines of code than the visible program units indi-cates that many of the implementation details of the visi-ble units are postponed until the implementation of the hidden units. The visible program units essentially make calls to the hidden program units for needed functionality. The points plotted in Figure 5 hug the 45-degree line a bit tighter than in Model B.
Finally, Model D utilizes information about all types and objects in the system, whether visible or hidden. This information might be available only after the design process was substantially complete, and in some cases after implementation had been partly accomplished.
accounts for about 22 source lines of code, and the coef-ficient estimate is highly significant. Figure 6 shows that the predicted values of source lines of code are close to the actuals.
7. Limitations of Analyses
The analyses discussed above would be expected to have high levels of predictability for projects in an environ-ment similar to the one for which the empirical analyses were conducted. However, in a different environment, the use of alternative development methodologies (e.g., web-based applications, prototyping and Commercial- off-the-Shelf (COTS) integration), the application of dif-ferent quality assurance criteria, and variations in the application domain might have an impact on these esti-mates. For example, a quality assurance criterion limiting the number of lines of code in a library unit would affect the results of any empirical analysis using library units as an explanatory variable. Similarly, two different design methodologies could lead to different decompositions of the design into library units and program units.
It is therefore recommended that a software develop-ment organization use these results as evidence that it is possible to build a family of models for the successive re-estimation of software size. The key to building useful models is to assess the development process being used, and then identify entities that are defined at successive stages in the process. Collect data on ongoing projects, recording the counts of these entities. With data from multiple projects that use the same process, an organiza-tion can then perform its own empirical analyses to de-termine the values of the coefficients for the models, guided by the approach used here. Once the family of models is then validated by use on additional projects, the models will become more valuable in estimating software size at various stages during a development project.
8. Summary and Future Directions
We have built a family of models for estimating software size based on successively available design information. The models demonstrate that the estimates can improve as more design information becomes available. The analyses were conducted at the subsystem level. Another possibility is to develop modules using library units as the unit of observation. The larger number of empirical observations at the library unit level would permit the exploration of a greater variety of explanatory variables. If desired, the library unit estimates could then be rolled up to get size estimates for subsystem or project levels.
As we have stressed, rather than using the model coef-ficients established here, a software development orga- nization may use the modeling approach here but
con-duct its own empirical analyses to assure applicability to its unique environment. The resulting coefficient esti-mates could be included in handbooks for managers to use in refining their size estimates. With increasingly more accurate size estimates during a project, there is improved manageability, thus reducing the chances of cost and schedule variances.
9. Acknowledgements
We acknowledge the U. S. Air Force Research Laborato-ries and the MITRE Corporation for their support of the original analysis.
Note 1. The measure of adjusted R2 used here is
de-fined as recommended by Kvalseth for models without an intercept term [24]. That is, for a sample of n observa-tions and a model with k parameters, if pi denotes the
fitted value of yi, and m the sample arithmetic mean of
the yi, then R2 = 1 - a * (pi - yi)2/ (yi - m)2, where a =
n/(n-k).
REFERENCES
[1] G. Antoniol, C. Lokan, G. Caldiera, and R. Fiutem, “A function-point-like measure for object-oriented software,” Empirical Software Engineering, Vol. 4, 263–287, 1999. [2] M. Ruhe, R. Jeffrey, and I. Wieczorek, “Cost estimation for
web applications,” Proceedings of the 25th International Conference on Software Engineering, Portland, Oregon, USA, ACM Press, New York, pp. 285–294, 2003.
[3] W. W. Agresti, “A feedforward capability to improve software reestimation,” in: N. H. Madhavji, J. Fernan-dez-Ramil, D. E. Perry (Eds.), Software Evolution and Feedback, John Wiley & Sons Ltd., West Sussex, Eng-land, pp. 443–458, 2006.
[4] B. W. Boehm, C. Abts, A. W. Brown, C. Chulani, B. K. Clark, E. Horowitz, R. Madachy, D. Reifer, and B. Steece, Software Cost Estimation with COCOMO II, Prentice Hall, Upper Saddle River, NJ, USA, 2000.
[5] T. DeMarco, “Controlling software projects,” Yourdon Press, Englewood Cliffs, NJ, USA, 1982.
[6] W. W. Agresti, “An approach to developing specification measures,” Proceedings of the 9th NASA Software
Engi-neering Workshop, NASA Goddard Space Flight Center, Greenbelt, MD, USA, pp. 14–41, 1984.
[7] P. Bourque and V. Cote, “An experiment in software sizing with structured analysis metrics,” Journal of Sys-tems and Software Vol. 15, 159–172, 1991.
[8] D. J. Paulish, R. L. Nord, and D. Soni, “Experience with architecture-centered software project planning,” Proceed-ings of the ACM SIGSOFT ’96 Workshops, San Francisco, CA, USA, ACM Press, New York, pp. 126–129, 1996. [9] P. Mohagheghi, B. Anda, and R. Conradi, “Effort
estima-tion of use cases for incremental large-scale software de-velopment,” Proceedings of the 27th International
[10] S. L. Pfleeger, “Model of software effort and productiv-ity,” Information and Software Technology, Vol. 33, 224–231, 1991.
[11] R. L. Jensen and J. W. Bartley, “Parametric estimation of programming effort: An object–oriented approach,” Jour-nal of Systems and Software, Vol. 15, pp. 107–114. 1991. [12] L. Laranjeira, “Software size estimation of object–oriented systems,” IEEE Transactions on Software Engineering, Vol. 16, 510–522, 1990.
[13] A. Minkiewicz, “The evolution of software size: A search for value,” CROSSTALK, Vol. 22, No. 3, pp. 23–26, 2009.
[14] P. Fraternali, M. Tisi, and A. Bongio, “Automating func-tion point analysis with model driven development,” Pro-ceedings of the Conference of the Center for Advanced Studies on Collaborative Research, Toronto, Canada, ACM Press, New York, pp. 1–12, 2006.
[15] A. Albrecht and J. Gaffney, “Software function, source lines of code and development effort prediction,” IEEE Transactions on Software Engineering, Vol. 9, 639–648, 1983.
[16] H. B. K. Tan, Y. Zhao, and H. Zhang, “Estimating LOC for information systems from their conceptual data mod-els,” Proceedings of the 28th International Conference on Software Engineering, Shanghai, China, ACM Press, New York, pp. 321–330, 2006.
[17] S. Diev, “Software estimation in the maintenance con-text,” ACM Software Engineering Notes, Vol. 31, No. 2
pp. 1–8, 2006.
[18] W. Fornaciari, F. Salice, U. Bondi, and E. Magini, “De-velopment cost and size estimation from high-level speci-fications,” Proceedings of the Ninth International Sympo-sium on Hardware/Software Codesign, Copenhagen, Denmark, ACM Press, New York, NY, pp. 86–91, 2001. [19] A. Zivkovic, I. Rozman, and M. Hericko, “Automated
software size estimation based on function points using UML models,” Information and Software Technology, Vol. 47, pp. 881–890, 2005
[20] M. Hericko and A. Zivkovic, “The size and effort esti-mates in iterative development,” Information and Soft-ware Technology, Vol. 50, pp. 772–781, 2008.
[21] W. Royce, “TRW's Ada process model for incremental development of large software systems,” Proceedings of the 12th International Conference on Software Engineer-ing, Nice, France, pp. 2–11, 1990,
[22] F. E. McGarry and W. W. Agresti, “Measuring Ada for software development in the Software Engineering Labo-ratory,” Journal of Systems and Software, Vol. 9, pp. 149–159, 1989.
[23] D. Doubleday, “ASAP: An Ada static source code ana-lyzer program,” Technical Report 1895, Department of Computer Science, University of Maryland, College Park, MD USA, 1987.