6
I
January 2018
Optimization of MIG Welding Process Parameters
on AISI 304 Stainless Steel Using Taguchi Method
and Fuzzy Logic
S. Vani 1, J. Venumurali 1, N. Swapna 1, B. Prasad kumar 1
1
Depatment of Mechanical Engineering, S. V. University, Tirupati, India
Abstract: The present paper tells about how to predict and optimize the Metal Inert Gas (MIG) welding of AISI 304 Stainless Steel (AISI 304 SS) work pieces, which are most widely in used in many industrial applications. The powerful tool known as Design of Experiments (DOE) was used to optimize the welding process parameters for effective welding joint of the work pieces. The following welding voltage, welding current and welding speed were considered as input parameters and similarly tensile strength, percentage of elongation, and hardness were considered as performance characteristics for DOE application. The values after experimental measurements, compared with corresponding predicted results of tensile strength, percentage of elongation, and hardness. Moreover, the Taguchi Method was also used for DOE and considered L27 orthogonal array matrix
and Signal-to-Noise Ratio, the tensile strength, percentage of elongation, and hardness of the predicted values have been creditably acquired via Fuzzy representation.
Keywords: AISI 304 SS, MIG welding, DOE, Tensile Strength, Percentage of elongation, Hardness, Fuzzy logic
I. INTRODUCTION
Gas metal arc welding (GMAW), sometimes referred to by one of its subtypes metal inert gas (MIG) welding, is a welding process in which an electric arc forms between a consumable wire electrode and the work piece metals, which heats the work piece metals, causing them to melt and join. Originally developed for welding of aluminum and other non-ferrous materials in the 1940s, it was soon applied to steels because it provides faster welding time compared to other welding process.
Aghakhani et al. [1] have carried out research on optimization of gas metal arc welding process parameters to enhance quality and productivity of weld ment. They have chosen ST-37 steel plate as work piece, 80% argon combination with 20% CO2 as shield gas depends on type of base metal being welded. The experiment was designed by Taguchi with L27 orthogonal array and it was carried out by Analysis of Variance (ANOVA) by considering weld dilution as output characteristic and wire feed rate, welding voltage, nozzle to plate distance, welding speed, and gas flow rate were as the input parameters. They reported that, the wire feed rate has no much significant effect on the weld dilution while gas flow has no effect at all on it. In another research made by Ajithooda et al. [2], AISI 1040 medium carbon steel was used for welding, output characteristic tensile strength was predicted with response surface model. The welding voltage, current, wires speed and gas flow rate were kept as input parameters. Tensile strengths in transverse and in longitudinal were almost same with input parameters explored by face centered design matrix.
L9 orthogonal array which is for very small values by Pawnkumar et al. [8]. Pradeep et al. [9] investigated on effect of process parameters on tensile strength of SS 3Cr12 specimen after MIG welding. Reported that, the tensile strength was increasing by increasing of welding speed and flow rate, but it was remains increasing with decreasing of voltage and wire feed rate. It was revealed through central composite matrix using Minitab software.
Irfan et al. [10] found that the penetration depth was increasing with welding speed, current and voltage in case of MIG welding of galvanized steel. Experimental investigation for welding aspect of AISI 304 and 316 grades was done for die penetrate testing by using Taguchi technique for the process of TIG and MIG welding by Suresh et al. [11]. Vinita et al. [12] preferred aluminum alloys of 6061 and 5082 grades for MIG welding, with aluminum 4043 wire as filler material of diameter 1.2 mm and an orthogonal array of L9 was used to conduct to optimize the process parameters via Taguchi through statistical software minitab-17. Moreover, similar methods applied to study of welding parameters on tensile strength of AM-40 aluminum alloy as workpiece in MIG welding. They were identified for maximum tensile strength and reported that the welding current and voltage were shown major influence on tensile strength of weld joint by Viveksaxena et al. [13].
In the present work, AISI 304 SS work pieces after MIG welding carried out were studied for tensile strength, percent of elongation, and hardness (performance characteristics) with influence of process parameters. Taguchi Method was used for DOE and considered L27 orthogonal array matrix and Signal-to-Noise Ratio to optimize process parameters.
II. EXPERIMENTATION
[image:3.612.153.449.347.670.2]AISI 304 Stainless Steel of 3.5 mm thickness sheet is used in this investigation. Chemical composition of AISI 304 Stainless Steel is listed in Table 1. MIG welding is done, the arc and weld pool is shielded from the atmospheric contamination by an externally supplied shield gas (CO2) and welding specifications listed in Table 2, MIG welding process parameters are listed in Table 3.
Table 1. Chemical composition of AISI 304 SS
C Mn P S Si Cr Ni Fe Component
0.08 2 0.045 0.03 1.0 18-20 8-10.5 66.345-74 Weight. %
Table 2. Specifications of MIG Welding Machine
Item Description
Model SB-10
Rated welding current 350 A/500 A
Feeding voltage of motor DC 24 V
Rated drawing force 100 N
Wire feeding speed 1.5-15 m/min
Cable length 3 m
Wire type Soft steel solid core, flux cored
Table 3.MIG welding process parameters
Parameters Units Code
Level-1 Level-2 Level-3 Welding
Voltage volts A 26 25 24
Welding
Current amps B 140 130 120
Welding Speed mm/min C 110 100 90
Fig. 1. (a). MIG welding setup, (b). Welded component.
Fig. 2. Tensile test specimen dimensions
Tensile test was carried out by using SM 1000-S3 UTM TQ228687-001, Tec Quipment Ltd., UK.
III. RESULTSANDDISCUSSIONS
Experiments were conducted to join the AISI 304 stainless steel by MIG welding technique, total experiments were conducted based on the Taguchi method. Moreover, the experimental results obtained by considering L27 orthogonal array matrix. The response averages of Tensile strength, Percentage of Elongation and Hardness were exhibited via S/N ratios.
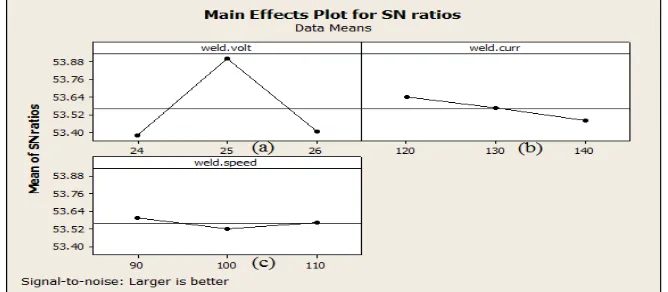
The results are blocked in terms graphs and have been shown in Figure 3, 4, and 5. The X-axis represents Welding voltage for (a), Welding current for (b) and Welding speed for (c), it is common for all figures such as 3, 4, and 5. Only Y-axis is varying for figure 3, 4 and 5 as referred as Tensile strength for Fig. 3, Percent of elongation for Fig. 4, and Hardness for Fig. 5 respectively.
A. S/N Ratio Average Values for Tensile Strength
In Fig. 3, S/N ratio of tensile strength clears that, the welding voltage is the more influential parameter followed by welding current and welding speed on MIG welding of AISI 304 SS.
[image:4.612.110.518.270.382.2] [image:4.612.143.477.572.718.2]Table 4.Numerical representation of Responses for S/N ratio average Parameter S/N Ratios Welding Voltage Welding Current Welding Speed
S/N Ratio Level 1 53.37 53.64 53.59
S/N Ratio Level 2 53.90 53.56 53.52
S/N Ratio Level 3 53.40 53.48 53.56
Delta = S/N (Max)-S/N (Min) 0.53 0.16 0.07
Rank 1 2 3
B. S/N Ratio Average Values for Percentage of Elongation
[image:5.612.138.486.241.509.2]In Fig. 4, S/N ratio of tensile strength clears that, the Welding speed is more influencing parameter followed by Welding voltage and Welding current on MIG welding of AISI 304 SS.
Fig. 4.Variation of mean of S/N ratio Vs Percentage elongation
Table 5.Numerical representation of Response for mean of percentage of Elongation
Parameter S/N Ratios Welding Voltage Welding Current Welding Speed
Mean Level 1 33.67 32.23 31.67
Mean Level 2 30.56 32.44 35.11
Mean Level 3 33.00 32.56 30.44
Delta = S/N (Max)-S/N (Min)
3.11 0.33 4.67
Rank 2 3 1
C. N Ratio Average Values for Hardness
Fig. 5.Response for mean of Hardness
Table 6. Numerical representation of Response for S/N ratio average Parameter
S/N Ratios
Welding Voltage
Welding Current
Welding Speed
S/N Ratio Level 1 45.78 45.67 45.58
S/N Ratio Level 2 45.40 45.63 45.60
S/N Ratio Level 3 45.73 45.60 45.71
Delta = S/N (Max)-S/N (Min) 0.38 0.07 0.13
Rank 1 3 2
D. Experimental (Exp.) and Predicted Values from Fuzzy Model
Though the experiments conducted for 27 runs, but considered only 9 with 3 runs intervals for simplicity. From the figure 6, it can be seen that the graph for experimental and predicted values have been increased up to the end of Exp. 5 then the same trend is observed from experiment No.6. From the Exp. 9, again it was raised and continued for 18 run and then again there is a sudden falling at Exp. 21 until Exp. 27 but not like Exp.6 can be observed.
Further, it can be seen that the graph for two results follow the same path. Thus trend shows that the experimental and modeling results are in correlation and therefore it can be said the experiments conducted are found to be correct.
Fig. 6.Comparison of Tensile Strength
[image:6.612.129.494.506.651.2]Fig. 7.Comparison of Percentage of Elongation
From the figure 8, it can be seen that the graph for experimental and predicted values show that the increasing trend at the beginning and then decreasing Exp. 9. Then continued until beginning of Exp. 18. Further, it can be seen that the two results follow the space path. The trend is also exhibited abnormal pattern, observed from Exp. 3 till experiment No.27. But the difference is not much considerable. Thus trend shows that the experimental and modelling results are in correlation and therefore it can be said the experiments conducted are found to be correct.
Fig. 8.Comparison of Hardness
IV. CONCLUSIONS
Optimization of MIG welding process parameters on 304 AISI Stainless Steel using Taguchi method and Fuzzy logic has been carried out for tensile strength, percent of elongation, and hardness with influence of process parameters.
The following conclusions are drawn from results of performance characteristics:
The welding voltage has exerted the greatest effect on Tensile strength followed by welding current and welding speed. The welding speed has exerted the greatest effect on Percentage of elongation followed by welding current and welding voltage. The welding voltage has exerted the greatest effect on Hardness followed by welding current and welding speed. BThe predicted value agree fairly well with the experimental value for Tensile strength, Percentage of elongation and Hardness due to the Fuzzy representation of Tensile strength, Percentage of elongation and Hardness of the predicted values can be obtained well.
REFERENCES
[1] M. Aghakhani, E. Mehrdad, Parametric Optimization of Gas Metal Arc Welding Process by Taguchi Method on Weld Dilution, International Journal of Modeling and Optimization, vol. 1, 2011, pp. 216-220.
[2] Ajithooda, Ashwanidhingra and satpalsharma, “Optimization of MIG welding process parameter to predict maximum yield strength in AISI 1040”, international journal of mechanical engineering and robotics research, October (2014) Vol.1, N0.3, PP-203-213.
[image:7.612.111.505.343.500.2][4] Arya. D.M, Chaturvedi. V and Vimal. J, “Parametric optimization of MIG process parameters using taguchi and grey taguchi analysis,” international journal
of research in engineering and applied sciences volume 3, issue 6
(Jun 2013) ISSN: 2249-3905.
[5] Das. B, B. Debbarma, R.N. Ray and S.C.Saha, “Influence of process parameters on depth of penetration of welding joint in MIG welding process”, International journal of research in engineering and technology vol.2, issue 10, Oct 2013, ISSN: 2321-7308.
[6] Ghosh. N, P.K.Pal, G.Nandi, parametric optimization of MIG welding on 316L Austenitic stainless steel by taguchi method archives of materials science and engineering May 2016 vol.79,No.1, PP-27-36.
[7] Kapil B. Pipavat, Dr. Divyanapandya, Mr.Vivekpatil “optimization of MIG welding process parameter using taguchi techniques”, International journal of advance engineering and research development volume.1, issue.5, May 2014, e-ISSN:2348-4470, print-ISSN;2348-6406.
[8] Pawn Kumar, Dr. B. K. Roy and Nish ant, “Parameters optimization for gas metal arc welding of Austenitic stainless steel (AISI 304) and low carbon steel using Taguchi’s technique”. International journal of engineering and management research, August 2013, pp-18-22.
[9] Pradeep D. Chaudhari and Nitin. N more, “Effect of welding process parameters on tensile strength” IOSR journal of engineering, May (2014), Vol.04, Issue05, PP-01-05.
[10] Sheikh Irfan and Prof. Vishal Achwal, “An experimental study on the effect of MIG welding parameters on the weld ability of galvanize steel”; International
journal on emerging technologies 5(1), June [2014],
pp-146-152.
[11] Suresh Kumar. L, S.M.Varma, P.Radhakrishna Prasad, P.Kiran Kumar, T. Siva Shankar [2011]. “Experimental investigation for welding aspect of AISI 304 and 316 by Taguchi technique for the process of TIG and MIG welding”, International journal of Engineering trends and technology, vol.2, no.2, PP.28-33.
[12] Vinita Knawel, R.S. Jadon. “Optimization of MIG welding parameters for hardness of aluminium alloys using taguchi method”, International journal of mechanical engineering vol.2, issue 6, June 2015 ISSN: 2348-8360.