Jean-Christophe Plantier,
bVéronique Avettand-Fenoel,
c,ffor the ANRS-CO5
HIV-2 and the ANRS-AC11 Quantification Working Group
IAME, UMR 1137, INSERM, Université Paris Diderot, Sorbonne Paris Cité, Laboratoire de Virologie, Hôpital Bichat, AP-HP, Paris, Francea; Laboratoire de Virologie, Hôpital Charles Nicolle, CHU de Rouen, and GRAM, Equipe d'Accueil 2656, Faculté de Médecine-Pharmacie, Institut de Recherche et d'Innovation en
Biomédecine, Université de Rouen, Rouen, Franceb; Université Paris-Descartes, Sorbonne Paris-Cité, Faculté de Médecine, EA 7327, Paris, Francec; IAME, UMR 1137, INSERM, Université Paris Diderot, Sorbonne Paris Cité, Service de Maladies Infectieuses et Tropicales, Hôpital Bichat, AP-HP, Paris, Franced; University of Bordeaux, INSERM, Bordeaux Population Health Research Center, UMR 1219, Bordeaux, Francee; AP-HP, Hôpital Necker Enfants-Malades, Laboratoire de Virologie, Paris, Francef
ABSTRACT
HIV-2 infection is characterized by a very low replication rate in most
cases and low progression. This necessitates an approach to patient monitoring that
differs from that for HIV-1 infection. Here, a new highly specific and sensitive
method for HIV-2 DNA quantification was developed. The new test is based on
quantitative real-time PCR targeting the long terminal repeat (LTR) and
gag
regions
and using an internal control. Analytical performance was determined in three
labo-ratories, and clinical performance was determined on blood samples from 63
pa-tients infected with HIV-2 group A (
n
⫽
35) or group B (
n
⫽
28). The specificity was
100%. The 95% limit of detection was three copies/PCR and the limit of
quantifica-tion was six copies/PCR. The within-run coefficients of variaquantifica-tion were between 1.03%
at 3.78 log
10copies/PCR and 27.02% at 0.78 log
10copies/PCR. The between-run
co-efficient of variation was 5.10%. Both manual and automated nucleic acid extraction
methods were validated. HIV-2 DNA loads were detectable in blood cells from all 63
patients. When HIV-2 DNA was quantifiable, median loads were significantly higher
in antiretroviral-treated than in naive patients and were similar for groups A and B.
HIV-2 DNA load was correlated with HIV-2 RNA load (
r
⫽
0.68; 95% confidence
inter-val [CI], 0.4 to 0.8;
P
⬍
0.0001). Our data show that this new assay is highly sensitive
and quantifies the two main HIV-2 groups, making it useful for the diagnosis of
HIV-2 infection and for pathogenesis studies on HIV-2 reservoirs.
KEYWORDS
HIV-2, DNA, PCR, quantification
H
IV-2 infection, mainly restricted to West Africa (1), is characterized by a slow
disease progression associated with a slow decline in CD4 T cell counts (2, 3), a low
rate of sexual or vertical transmission (4, 5), lower viral replication than HIV-1 (6, 7), and
natural resistance to non-nucleoside reverse transcriptase inhibitors, fusion inhibitors
(enfuvirtide), and several protease inhibitors, necessitating a specific approach for
HIV-2-infected patient monitoring, different than that for HIV-1 infection (8, 9).
Most HIV-2-infected patients display undetectable plasma HIV RNA loads in the
absence of antiretroviral therapy. In the French National HIV-2 Cohort, 71% of
antiretroviral-naive patients had plasma viral loads below 100 copies/ml (10). Data from
a West Africa cohort showed that 46.5% of antiretroviral-naive patients had
undetect-able HIV-2 RNA (
⬍
10 copies/ml), and 35.8% had low HIV-2 RNA loads of 10 to 100
Received9 May 2017 Returned for modification12 June 2017 Accepted7 July 2017
Accepted manuscript posted online12 July 2017
CitationBertine M, Gueudin M, Mélard A, Damond F, Descamps D, Matheron S, Collin F, Rouzioux C, Plantier J-C, Avettand-Fenoel V, for the ANRS-CO5 HIV-2 and the ANRS-AC11 Quantification Working Group. 2017. New highly sensitive real-time PCR assay for HIV-2 group A and group B DNA quantification. J Clin Microbiol 55:2850 –2857.https://doi.org/10 .1128/JCM.00755-17.
EditorAngela M. Caliendo, Rhode Island Hospital
Copyright© 2017 American Society for Microbiology.All Rights Reserved.
Address correspondence to Véronique Avettand-Fenoel, [email protected].
on May 16, 2020 by guest
copies/ml (11). In this context, HIV-2 DNA may be the only detectable viral marker for
patients with undetectable HIV-2 RNA. It may then be a useful marker to confirm a
diagnosis of monoinfection by HIV-2 or coinfection with HIV-1 in the case of strong
serological cross-reactivity (12). This diagnosis will permit the adaptation of therapeutic
decisions. Moreover, HIV-2 DNA detection is essential for the early diagnosis of infants
born to HIV-2-seropositive mothers. Lastly, this marker can be useful for pathogenesis
studies on HIV-2 reservoirs.
Several previous studies have developed HIV-2 DNA quantification assays, but they
presented difficulties for quantifying group B viruses, and HIV-2 DNA was not
detect-able in some samples (13–15). No commercial HIV-2 DNA quantification assay is
currently available.
The aim of the present study was to develop a reproducible, sensitive, and specific
method for quantifying HIV-2 DNA, especially for the two endemic HIV-2 groups A and
B (10), based on a real-time PCR method. The new test was developed and validated by
three laboratories belonging to the Agence Nationale de Recherche sur le Sida et les
Hépatites Virales (ANRS) AC11 Quantification Working Group to assess the analytical
performance and interlaboratory reproducibility.
RESULTS
Analytical performance of the assay.
All 50 HIV-1-positive and 30 HIV-negative
DNA samples were negative in the assay, giving a specificity of 100%.
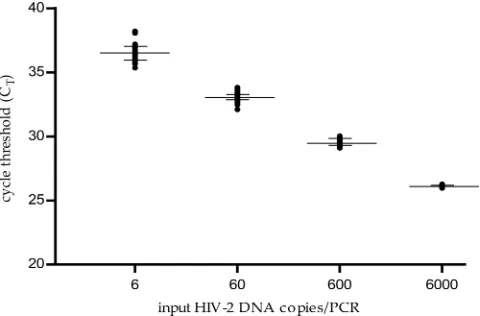
The standard curve showed strong linearity between the cycle threshold (
C
T) values
and log
10HIV-2 DNA copies/PCR, with a limit of quantification of six copies/PCR (
n
⫽
22 runs) (Fig. 1). The median correlation coefficient was 0.997 (range, 0.982 to 1), and
the median slope was
⫺
3.45 (range,
⫺
3.11 to
⫺
3.64). The limit of quantification is 40
copies/10
6cells (1.6 log) when studying 1
g total DNA per PCR.
The analytical sensitivity of the assay was 100% at four copies/PCR (20/20), 95% at
three copies/PCR (19/20), and 85% at two copies/PCR (17/20).
The within-run reproducibility was evaluated using the external standard with
theoretical concentrations of 6,000, 600, 60, and 6 copies/PCR (3.78 log
10, 2.78 log
10,
1.78 log
10, and 0.78 log
10copies/PCR, respectively). We obtained a mean of 3.80 log
10copies/PCR for the expected value of 3.78 log
10copies/PCR with a within-run coefficient
of variation (CV) of 1.03% and mean values of 2.79 log
10, 1.83 log
10, and 0.85 log
10copies/PCR for the expected concentrations of 2.78 log
10, 1.78 log
10, and 0.78 log
10copies/PCR and within-run CVs of 1.60%, 3.43%, and 27.02%, respectively.
The positive control was determined to be 2.19 log
10copies/PCR for the
between-run assays performed in the three laboratories, with a CV of 5.10%. This reproducibility
was evaluated on DNA extracts.
FIG 1Standard curve of the HIV-2 DNA real-time PCR assay (n⫽22 runs). The cycle threshold (CT) is the
number of cycles at which fluorescence passes a fixed limit (time to positivity). Median values and 25% and 75% interquartile ranges of theCTare indicated (logarithmic scale).
on May 16, 2020 by guest
http://jcm.asm.org/
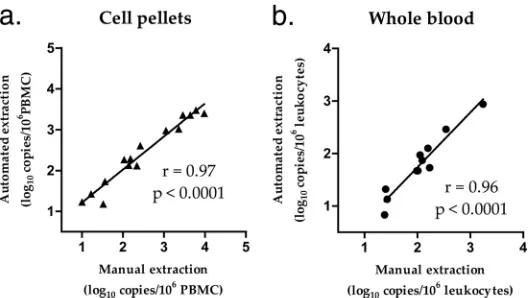
[image:2.585.86.326.72.230.2]The manual versus automated extractions were compared using samples extracted
and quantified in parallel in labs A and C, respectively. The median values of HIV-2 DNA
obtained from the 15 cell pellet samples were 2.34 log
10copies/10
6peripheral blood
mononuclear cells (PBMCs) with manual extraction and 2.29 log
10copies/10
6PBMCs
with automated extraction, with a median difference of 0.22 log
10and a correlation
coefficient of 0.97 (95% confidence interval [CI], 0.92 to 0.99;
P
⬍
0.0001). The median
values obtained from the 11 whole blood samples were 2.05 log
10copies/10
6leuko-cytes with manual extraction and 1.73 log
10copies/10
6leukocytes with automated
extraction, with a median difference of 0.3 log
10and a correlation coefficient of 0.96
(95% CI, 0.85 to 0.99;
P
⬍
0.0001) (Fig. 2).
Clinical performance.
The clinical performance was evaluated in lab C. All samples
from HIV-2-infected patients were validated according to the internal control
manu-facturer’s instructions.
Total DNA in the amounts of 122 to 1,000 ng (median, 548 ng) per PCR well was
analyzed, depending on the total DNA concentrations in the extracts. HIV-2 DNA was
detectable from all 63 patients. HIV-2 DNA was detectable but not quantifiable (
⬍
6
copies/PCR) from 20 patients (32%) and quantifiable (
ⱖ
6 copies/PCR) from 43 patients
(68%), with a median HIV-2 DNA load of 2.45 log
10copies/10
6PBMCs (interquartile
range [IQR], 2.15 log
10to 3.00 log
10). From the 20 patients with detectable but not
quantifiable HIV-2 DNA, the same DNA extracts were retested using 2 to 6 PCR
replicates. Eighteen samples gave positive results in all replicates, one sample had two
positive results out of three, and one had three positive results out of four, at levels
lower than six copies per PCR.
Among the 35 group A samples, HIV-2 DNA was quantifiable in 23 (66%), with a
median load of 2.56 log
10copies/10
6PBMCs (IQR, 2.29 log
10to 3.03 log
10). Among the
28 group B samples, HIV-2 DNA was quantifiable in 20 (71%), with a median load of 2.27
log
10copies/10
6PBMCs (IQR, 1.97 log
10to 2.81 log
10). There was no difference between
groups A and B in the proportions of patients displaying HIV-2 DNA loads below the
limit of quantification (
P
⫽
0.79) nor in the median load (2.56 log
10versus 2.27 log
10copies/10
6PBMCs, respectively;
P
⫽
0.17) when the load was quantifiable.
Among the 18 antiretroviral-naive patients, HIV-2 DNA was quantifiable from 10
(56%), with a median load of 2.08 log
10copies/10
6PBMCs (IQR, 1.88 log
10to 2.28 log
10).
Among the 45 antiretroviral-treated patients, HIV-2 DNA was quantifiable from 33
(73%), with a median load of 2.60 log
10copies/10
6PBMCs (IQR, 2.26 log
10to 3.09 log
10).
There was no difference in the proportions of patients displaying HIV-2 DNA loads
below the limit of quantification between antiretroviral-naive and -treated patients (
P
⫽
0.23 for all patients,
P
⫽
0.74 for group A, and
P
⫽
0.65 for group B). The median HIV-2
DNA load was significantly higher in antiretroviral-treated than -naive patients (
P
⫽
FIG 2Comparison of manual and automated extractions from blood cell pellets and whole blood. (a) HIV-2 DNA was quantified in PBMCs (peripheral blood mononuclear cells [lymphocytes plus monocytes]) isolated from whole blood using Ficoll (n⫽15). (b) HIV-2 DNA was quantified in leukocytes from whole blood, including PBMCs and polynuclear cells (n⫽11).
on May 16, 2020 by guest
[image:3.585.74.338.71.220.2]0.003 for all patients,
P
⫽
0.068 for group A, and
P
⫽
0.03 for group B), when
quantifiable.
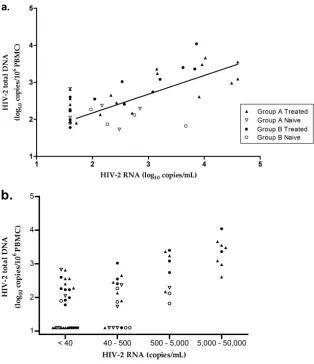
When quantifiable, the HIV-2 DNA load correlated with the HIV-2 RNA load (
r
⫽
0.68;
95% confidence interval, 0.4 to 0.8;
P
⬍
0.0001 for the whole group and
r
⫽
0.73; 95%
confidence interval, 0.4 to 0.9;
P
⬍
0.0002 for treated patients) (Fig. 3a). The proportions
of patients displaying HIV-2 DNA loads below the limit of quantification were 46%, 39%,
0%, and 0% for HIV-2 RNA loads of
⬍
40 copies/ml, 40 to 500 copies/ml, 500 to 5,000
copies/ml, and 5,000 to 50,000 copies/ml, respectively. When quantifiable, the median
(IQR) HIV-2 DNA loads were 2.26 log
10(2.02 log
10to 2.56 log
10), 2.37 log
10(2.01 log
10to 2.50 log
10), 2.74 log
10(2.17 log
10to 3.24 log
10), and 3.42 log
10(3.06 log
10to 3.58
log
10) copies/10
6PBMCs, respectively (Fig. 3b). HIV-2 DNA loads were significantly
different depending on the HIV-2 RNA load strata (analysis of variance [ANOVA],
P
⬍
0.0001). Comparisons between subgroups (e.g., group A and group B or
antiretroviral-treated and -naive patients) according to HIV-2 RNA loads were not relevant because
of the small numbers of patients in each subgroup.
DISCUSSION
Infection by HIV-2 is different from that by HIV-1, especially with respect to its slower
progression, its therapeutic management, and its level of genetic diversity. Specific
molecular methods are therefore necessary for the diagnosis and monitoring of HIV-2
infection (either alone or in the context of a coinfection with HIV-1), for the diagnosis
FIG 3Clinical performance. (a) Correlation between HIV-2 DNA and HIV-2 RNA loads (r⫽0.68; 95% confidence interval, 0.4 to 0.8;P⬍0.0001 for the whole group). An arbitrary value of 1.60 log10copies/ml was attributed to samples with an undetectable plasma viral load. (b) Distribution of HIV-2 DNA based on HIV-2 RNA concentration strata:⬍40, 40 to 500, 500 to 5,000, and 5,000 to 50,000 copies/ml.on May 16, 2020 by guest
http://jcm.asm.org/
[image:4.585.48.362.69.433.2]of infants born to seropositive HIV-2 mothers, and for studying the HIV-2 reservoir.
Plasma viremia is undetectable in many HIV-2-infected patients in the absence of
antiretroviral therapy, particularly in those with high CD4 T cell counts (11). HIV-2 DNA
may be the only detectable marker in these patients.
The aim of this work was to develop a highly sensitive quantitative assay for HIV-2
DNA that is easy to implement in developing countries where HIV-2 is endemic.
This test exhibited 100% specificity. As expected, given the wide genomic
diver-gence between HIV-1 and HIV-2, the HIV-2 primers did not hybridize to the HIV-1
genome. This assay also displayed good linearity (6 to 6,000 copies/PCR) and within-run
reproducibility. We report good interlaboratory reproducibility. In addition, this assay
that includes an external standard for quantification will improve the reliability of and
the comparisons between studies. The excellent sensitivity (95% limit of detection,
three copies/PCR) should prove useful both for clinical diagnosis and for
pathophysi-ological studies. A minimal DNA input of 0.4
g should be studied to have a 95% limit
of detection of 50 copies/million cells.
Both manual and automated extraction methods, as well as two real-time PCR
instruments, were validated for compatibility with local practices in resource-limited
countries. We also showed that the assay can be performed on blood cell pellets and
whole blood samples.
We used the same amplification protocol as used by the Generic HIV DNA cell kit
(Biocentric, Bandol, France) to detect and quantify HIV-1 DNA (16, 17). This test is
currently being used with success in many resource-limited countries (18). This will
facilitate the use of this new assay to test for HIV-2 alone or jointly with HIV-1 in the
same run. This will allow a reduction of analytical costs by increasing the number of
samples per run and will facilitate the molecular diagnosis of dual HIV-1/HIV-2 infection
within the same sample or the diagnosis of HIV infection in babies.
HIV-2 DNA was detectable in blood cells from all patients (infected either with HIV-2
group A or group B), owing to the use of primers and probes designed to efficiently
amplify HIV-2 RNA (16); the sensitivity of this assay has thus been improved relative to
previous assays which reported undetectable HIV-2 DNA in 17% (5/29) and 26% (11/42)
of samples (13, 15). The addition of an internal control, which was absent in the
previous assays (13, 14), allowed for the validation of the analytical process.
We also showed that HIV-2 patients receiving antiretroviral therapy had higher HIV-2
DNA loads than antiretroviral-naive patients, probably because patients who had been
treated had more advanced disease, which necessitated the initiation of antiretroviral
treatment. As described in Table 1, antiretroviral-treated patients had significantly
fewer CD4 cells than antiretroviral-naive patients (424 versus 603/mm
3,
respec-tively;
P
⫽
0.003). Among the treated patients, higher HIV-2 DNA viral loads correlated
copies/10 PBMCs) (median [IQR])
aARV, antiretroviral; IQR, interquartile range; PBMC, peripheral blood mononuclear cell. bSignificantPvalues are in boldface font.
on May 16, 2020 by guest
[image:5.585.40.553.82.237.2]with higher HIV-2 RNA loads, similar to what has been reported for HIV-1 infection (18).
A negative correlation between CD4 cell count and HIV-2 DNA load was also observed
(
r
⫽
0.66; 95% confidence interval, 0.8 to 0.4;
P
⬍
0.0001).
The quantification of HIV-2 DNA levels would also provide information about the
HIV-2 reservoir (19, 20), as HIV-1 DNA load has been reported to be a relevant marker
of the HIV-1 reservoir (21–27).
In conclusion, this new HIV-2 DNA viral load assay has good analytical performance
and clinical sensitivity. It is particularly successful for detecting both HIV-2 groups A and
B, the most prevalent, more so than the previously described assays (13–15). It has been
validated on a large well-characterized panel of patient samples. This easy-to-perform
assay is appropriate for use in resource-limited countries in which multiple HIV-2
variants circulate. It will also be particularly useful for HIV-2 diagnosis in babies born to
seropositive mothers and for the diagnosis of mono- or coinfections with HIV-1, which
is important because of monitoring and the therapeutic consequences. It may also aid
in pathogenesis studies on HIV-2 reservoirs, exploring new insights into the natural
history of HIV-2 infection at different stages, and improving opportunities for clinical
studies in treated patients.
MATERIALS AND METHODS
Patients samples.HIV-2 samples from 63 infected patients included in the French National HIV-2 Cohort (ANRS CO5) collected between June 2014 and May 2015 and with sufficient cells available were selected, and plasma HIV-2 RNA loads were determined as described previously (16). The viral genotype was representative of the genetic diversity among HIV-2 groups observed in the French cohort. Written informed consent was obtained from all patients at the time of inclusion in the cohort.
Whole blood sample aliquots collected with EDTA anticoagulant were frozen at⫺80°C. Blood cell pellets were obtained from whole blood after centrifugation (1,000 ⫻ g for 20 min) and plasma decantation. PBMCs were separated using a Ficoll-diatrizoate gradient (Eurobio, Courtaboeuf, France) from blood samples according to the manufacturer’s instructions, and aliquots were frozen at⫺80°C.
Among the 63 patients assessed, 62% were women with a median age of 50 years (IQR, 43 to 55 years), and the median CD4 cell count was 485/mm3(IQR, 280 to 599/mm3) (Table 1). Of these, 71% (n⫽45) were treated by antiretroviral therapy, and the viral group, determined as previously described (28), was A for 35 patients (71% treated) and B for 28 (71% treated). The selected samples had the following HIV-2 RNA loads:⬍40 copies/ml (n⫽28; 15 group A and 13 group B), 40 to 500 copies/ml (n⫽18; 10 group A and 8 group B), 500 to 5,000 copies/ml (n⫽9; 4 group A and 5 group B), and 5,000 to 50,000 copies/ml (n⫽8; 6 group A and 2 group B). These samples were used to evaluate the clinical performance of the assay. Eleven whole blood samples from HIV-2-infected patients (6 group A and 5 group B) were also used to evaluate the performance using whole blood.
Blood samples from 30 HIV-negative subjects, 40 HIV-1 group M-positive patients, and 10 HIV-1 group O patients were tested to evaluate the specificity of the assay.
HIV-2 DNA quantification assay.Several extraction methods were used for whole blood and cell pellets, depending on the laboratory (three were involved in the study). For whole blood, total DNA was extracted from 200l using NucleoSpin blood kits (Macherey-Nagel, Düren, Germany) in labs A and B (Necker Hospital, Paris, and Charles Nicolle Hospital, Rouen, France) and using the QIAsymphony DSP DNA minikit (Qiagen, Courtaboeuf, France) in lab C (Bichat Claude Bernard Hospital, Paris). For cell pellets, the QIAamp DNA minikit and the QIAsymphony DSP DNA minikit were used for total DNA extraction from three to five million cells in labs A and C, respectively.
To normalize the HIV-2 DNA quantification, the amount of total DNA in extracts was determined by spectrophotometry (Nanodrop, Thermo Scientific, Wilmington, NC, USA) (labs A and B) or by quantifi-cation of the albumin gene (lab C) using the LightCycler FastStart DNA Master Hybprobe kit (Roche, Mannheim, Germany) and serial dilutions of human genomic DNA (Roche) as the standard (29, 30).
This new quantification assay is based on a triplex TaqMan PCR approach targeting the conserved consensus regions in the long terminal repeat (LTR) andgaggene already used in the HIV-2 RNA quantification assay (Biocentric) (16). It includes an internal control (yellow dye universal DNA extraction and inhibition control; Diagenode, Liège, Belgium) that is added before extraction. As recommended by Diagenode, the internal control is validated if positive, regardless of the cycle threshold.
The forward and reverse primers for the LTR region were 5=-AGCAGGTAGAGCCTGGGTGTT-3=and 5=-TCTTTAAGCAAGCAAGCGTGG-3=, respectively (31), with an internal probe (5=-FAM-CTTGGCCGGYRCT GGGCAGA-BHQ1-3=[FAM, carboxyfluorescein; BHQ1, black hole quencher 1]). The forward and reverse primers for thegagregion were F3 (5=-GCGCGAGAAACTCCGTCTTG-3=) and R1 (5=-TTCGCTGCCCACACA ATATGTT-3=), respectively, and the internal HIV-2 TaqMangagprobe was S65GAG2 (5=-FAM-TAGGTTAC GGCCCGGCGGAAAGA-BHQ1-3=) (32).
The reaction mixtures consisted of 50-l volumes containing the DNA extracts (20l), primers and probes for HIV-2 (400 nM each), primers and probe for the internal control (1l), and 1⫻PCR buffer (2⫻ qPCR MasterMix Plus; Eurogentec, Seraing, Belgium).
The thermocycling conditions were 2 min at 50°C and 10 min at 95°C, followed by 50 cycles of 95°C for 15 s and 60°C for 1 min. Amplification and data acquisition were carried out with the CFX96 (Bio-Rad,
on May 16, 2020 by guest
http://jcm.asm.org/
600, 60, and 6 copies/20l (22 runs).
The analytical sensitivity was determined by testing dilutions of the external standards to 10, 6, 4, 3, and 2 copies/20l (20 replicates each) (lab A and lab B).
The within-run reproducibility was determined by testing the external standard at dilutions of 6000, 600, 60, and 6 copies/20l (10 replicates for each dilution) (lab B).
To determine between-run reproducibility, an HIV-2-positive control was prepared by diluting the DNA extract from cell cultures of an HIV-2 group A isolate (GenBank accession numberM15390) to 2.13 log10copies/20l by a previously described assay (32). This solution was tested in the three laboratories in separate runs (n⫽24).
The manual and automated extractions were compared using blood cell pellets and whole blood; 15 PBMC pellets (8 group A and 7 group B) and 11 whole blood samples (6 group A and 5 group B) were extracted and quantified in parallel in labs A (manual) and C (automated).
Statistical analysis.Comparisons between groups were performed with the Mann-Whitney and Fisher exact tests. Pearson’s correlation coefficients were calculated to estimate the relationship between theCTvalues and log10HIV-2 DNA copies/PCR, the relationship between the HIV-2 DNA and HIV-2 RNA loads, the relationship between the HIV-2 DNA and CD4 cell counts, and to compare manual versus automated extractions. An ANOVA was performed to evaluate the HIV-2 DNA values according to HIV-2 RNA strata.
ACKNOWLEDGMENTS
This work was supported by the Agence Nationale de Recherche sur le Sida et les
Hépatites Virales (ANRS). We also thank the HIV-2 cohort (ANRS CO5), which is
sup-ported by a grant from the ANRS.
REFERENCES
1. De Cock KM, Brun-Vézinet F. 1989. Epidemiology of HIV-2 infection. AIDS 3 Suppl 1:S89 –S95.
2. Marlink R, Kanki P, Thior I, Travers K, Eisen G, Siby T, Traore I, Hsieh CC, Dia MC, Gueye EH. 1994. Reduced rate of disease development after HIV-2 infection as compared to HIV-1. Science 265:1587–1590.https:// doi.org/10.1126/science.7915856.
3. Matheron S, Pueyo S, Damond F, Simon F, Leprêtre A, Campa P, Salamon R, Chêne G, Brun-Vezinet F, French HIV-2 Cohort Study Group. 2003. Factors associated with clinical progression in HIV-2 infected-patients: the French ANRS cohort. AIDS 17:2593–2601.https://doi.org/10.1097/ 00002030-200312050-00006.
4. Kanki PJ, Travers KU, MBoup S, Hsieh CC, Marlink RG, Gueye-NDiaye A, Siby T, Thior I, Hernandez-Avila M, Sankalé JL. 1994. Slower heterosexual spread of HIV-2 than HIV-1. Lancet 343:943–946.https://doi.org/10.1016/ S0140-6736(94)90065-5.
5. Burgard M, Jasseron C, Matheron S, Damond F, Hamrene K, Blanche S, Faye A, Rouzioux C, Warszawski J, Mandelbro L, ANRS French Perinatal Cohort EPF-CO1. 2010. Mother-to-child transmission of HIV-2 infection from 1986 to 2007 in the ANRS French Perinatal Cohort EPF-CO1. Clin Infect Dis 51:833– 843.https://doi.org/10.1086/656284.
6. Ariyoshi K, Jaffar S, Alabi AS, Berry N, Schim van der Loeff M, Sabally S, N=Gom PT, Corrah T, Tedder R, Whittle H. 2000. Plasma RNA viral load predicts the rate of CD4 T cell decline and death in HIV-2-infected patients in West Africa. AIDS 14:339 –344.https://doi.org/10.1097/ 00002030-200003100-00006.
7. Berry N, Ariyoshi K, Jaffar S, Sabally S, Corrah T, Tedder R, Whittle H. 1998. Low peripheral blood viral HIV-2 RNA in individuals with high CD4
percentage differentiates HIV-2 from HIV-1 infection. J Hum Virol 1:457– 468.
8. Desbois D, Roquebert B, Peytavin G, Damond F, Collin G, Bénard A, Campa P, Matheron S, Chêne G, Brun-Vézinet F, Descamps D, French ANRS HIV-2 Cohort (ANRS CO 05 VIH-2). 2008. In vitro phenotypic suscep-tibility of human immunodeficiency virus type 2 clinical isolates to protease inhibitors. Antimicrob Agents Chemother 52:1545–1548.
https://doi.org/10.1128/AAC.01284-07.
9. Witvrouw M, Pannecouque C, Switzer WM, Folks TM, De Clercq E, Heneine W. 2004. Susceptibility of HIV-2, SIV and SHIV to various anti-HIV-1 compounds: implications for treatment and postexposure prophylaxis. An-tivir Ther 9:57– 65.
10. Visseaux B, Damond F, Matheron S, Descamps D, Charpentier C. 2016. HIV-2 molecular epidemiology. Infect Genet Evol 46:233–240.https://doi .org/10.1016/j.meegid.2016.08.010.
11. Ekouévi DK, Avettand-Fènoël V, Tchounga BK, Coffie PA, Sawadogo A, Minta D, Minga A, Eholie SP, Plantier J-C, Damond F, Dabis F, Rouzioux C, IeDEA West Africa Collaboration. 2015. Plasma HIV-2 RNA according to CD4 count strata among HIV-2-infected adults in the IeDEA West Africa Collaboration. PLoS One 10:e0129886.https://doi.org/10.1371/journal .pone.0129886.
12. Damond F, Apetrei C, Robertson DL, Souquière S, Leprêtre A, Matheron S, Plantier JC, Brun-Vézinet F, Simon F. 2001. Variability of human immunodeficiency virus type 2 (HIV-2) infecting patients living in France. Virology 280:19 –30.https://doi.org/10.1006/viro.2000.0685.
13. Damond F, Descamps D, Farfara I, Telles JN, Puyeo S, Campa P, Leprêtre A, Matheron S, Brun-Vezinet F, Simon F. 2001. Quantification of proviral
on May 16, 2020 by guest
load of human immunodeficiency virus type 2 subtypes A and B using real-time PCR. J Clin Microbiol 39:4264 – 4268.https://doi.org/10.1128/ JCM.39.12.4264-4268.2001.
14. Gueudin M, Damond F, Simon F. 2005. Quantification of proviral DNA load of human immunodeficiency virus type 2 subtypes A and B using real-time PCR. Methods Mol Biol 304:215–220.https://doi.org/10.1385/ 1-59259-907-9:215.
15. Gueudin M, Damond F, Braun J, Taïeb A, Lemée V, Plantier J-C, Chêne G, Matheron S, Brun-Vézinet F, Simon F. 2008. Differences in proviral DNA load between HIV-1- and HIV-2-infected patients. AIDS 22:211–215.
https://doi.org/10.1097/QAD.0b013e3282f42429.
16. Avettand-Fenoel V, Damond F, Gueudin M, Matheron S, Mélard A, Collin G, Descamps D, Chaix M-L, Rouzioux C, Plantier J-C, ANRS-CO5 HIV-2 and the ANRS-AC11 Quantification Working Group. 2014. New sensitive one-step real-time duplex PCR method for group A and B HIV-2 RNA load. J Clin Microbiol 52:3017–3022.https://doi.org/10.1128/JCM.00724-14.
17. Avettand-Fènoël V, Chaix M-L, Blanche S, Burgard M, Floch C, Toure K, Allemon M-C, Warszawski J, Rouzioux C, French Pediatric Cohort Study ANRS-CO 01 Group. 2009. LTR real-time PCR for HIV-1 DNA quantitation in blood cells for early diagnosis in infants born to seropositive mothers treated in HAART area (ANRS CO 01). J Med Virol 81:217–223.https:// doi.org/10.1002/jmv.21390.
18. Avettand-Fenoel V, Blanche S, Le Chenadec J, Scott-Algara D, Dollfus C, Viard J-P, Bouallag N, Benmebarek Y, Rivière Y, Warszawski J, Rouzioux C, Buseyne F. 2012. Relationships between HIV disease history and blood HIV-1 DNA load in perinatally infected adolescents and young adults: the ANRS-EP38-IMMIP study. J Infect Dis 205:1520 –1528.https://doi.org/10 .1093/infdis/jis233.
19. Samri A, Charpentier C, Bertine M, Diallo M, Even S, Matheron S, Thiébaut R, Autran B, Brun-Vezinet F. 2017. Skewed distribution of HIV-2 reservoir with limited input of central memory T cells, abstr 290. Abstr 24th Confer-ence on Retroviruses and Opportunistic Infections, Seattle, WA, 13 to 16 February 2017.
20. Matheron S, Descamps D, Gallien S, Besseghir A, Tubiana R, Damond F, Collin F, Brun-Vezinet F, Chene G. 2017. Raltegravir/emtricitabine/ tenofovir in HIV-2 infection (ANRS 159 VIH-2 pilot trial), abstr 448. Abstr 24th Conference on Retroviruses and Opportunistic Infections, Seattle, WA, 13 to 16 February 2017.
21. Avettand-Fènoël V, Hocqueloux L, Ghosn J, Cheret A, Frange P, Melard A, Viard J-P, Rouzioux C. 2016. Total HIV-1 DNA, a marker of viral reservoir dynamics with clinical implications. Clin Microbiol Rev 29:859 – 880.https:// doi.org/10.1128/CMR.00015-16.
22. Rouzioux C, Hubert J-B, Burgard M, Deveau C, Goujard C, Bary M, Séréni D, Viard J-P, Delfraissy J-F, Meyer L, SEROCO Cohort Study Group. 2005. Early levels of HIV-1 DNA in peripheral blood mononuclear cells are predictive of disease progression independently of HIV-1 RNA levels and CD4⫹T cell counts. J Infect Dis 192:46 –55.https://doi.org/10.1086/
430610.
23. Goujard C, Bonarek M, Meyer L, Bonnet F, Chaix M-L, Deveau C, Sinet M, Galimand J, Delfraissy J-F, Venet A, Rouzioux C, Morlat P, Agence Na-tionale de Recherche sur le Sida PRIMO Study Group. 2006. CD4 cell count and HIV DNA level are independent predictors of disease progres-sion after primary HIV type 1 infection in untreated patients. Clin Infect Dis 42:709 –715.https://doi.org/10.1086/500213.
24. Avettand-Fenoel V, Bouteloup V, Mélard A, Fagard C, Chaix M-L, Leclercq
P, Chêne G, Viard J-P, Rouzioux C, members of the ETOILE study. 2010. Higher HIV-1 DNA associated with lower gains in CD4 cell count among patients with advanced therapeutic failure receiving optimized treat-ment (ANRS 123–ETOILE). J Antimicrob Chemother 65:2212–2214.
https://doi.org/10.1093/jac/dkq282.
25. Martinez V, Costagliola D, Bonduelle O, N=go N, Schnuriger A, Théodorou I, Clauvel J-P, Sicard D, Agut H, Debré P, Rouzioux C, Autran B, Asymp-tomatiques à Long Terme Study Group. 2005. Combination of HIV-1-specific CD4 Th1 cell responses and IgG2 antibodies is the best predictor for persistence of long-term nonprogression. J Infect Dis 191:2053–2063.
https://doi.org/10.1086/430320.
26. Lambotte O, Boufassa F, Madec Y, Nguyen A, Goujard C, Meyer L, Rouzioux C, Venet A, Delfraissy J-F, SEROCO-HEMOCO Study Group. 2005. HIV controllers: a homogeneous group of HIV-1-infected patients with sponta-neous control of viral replication. Clin Infect Dis 41:1053–1056.https://doi .org/10.1086/433188.
27. Sáez-Cirión A, Bacchus C, Hocqueloux L, Avettand-Fenoel V, Girault I, Lecuroux C, Potard V, Versmisse P, Melard A, Prazuck T, Descours B, Guer-gnon J, Viard J-P, Boufassa F, Lambotte O, Goujard C, Meyer L, Costagliola D, Venet A, Pancino G, Autran B, Rouzioux C, ANRS VISCONTI Study Group. 2013. Post-treatment HIV-1 controllers with a long-term virological remis-sion after the interruption of early initiated antiretroviral therapy ANRS VISCONTI Study. PLoS Pathog 9:e1003211.https://doi.org/10.1371/journal .ppat.1003211.
28. Charpentier C, Eholié S, Anglaret X, Bertine M, Rouzioux C, Avettand-Fenoël V, Messou E, Minga A, Damond F, Plantier J-C, Dabis F, Peytavin G, Brun-Vézinet F, Ekouevi DK, IeDEA West Africa Collaboration. 2014. Genotypic resistance profiles of HIV-2-treated patients in West Africa. AIDS 28:1161–1169.https://doi.org/10.1097/QAD.0000000000000244. 29. Laurendeau I, Bahuau M, Vodovar N, Larramendy C, Olivi M, Bieche I,
Vidaud M, Vidaud D. 1999. TaqMan PCR-based gene dosage assay for predictive testing in individuals from a cancer family with INK4 locus haploinsufficiency. Clin Chem 45:982–986.
30. Dehee A, Asselot C, Piolot T, Jacomet C, Rozenbaum W, Vidaud M, Garbarg-Chenon A, Nicolas JC. 2001. Quantification of Epstein-Barr virus load in peripheral blood of human immunodeficiency virus-infected patients using real-time PCR. J Med Virol 65:543–552.https://doi.org/10 .1002/jmv.2071.
31. Rouet F, Ekouevi DK, Inwoley A, Chaix M-L, Burgard M, Bequet L, Viho I, Leroy V, Simon F, Dabis F, Rouzioux C. 2004. Field evaluation of a rapid human immunodeficiency virus (HIV) serial serologic testing algorithm for diagnosis and differentiation of HIV type 1 (HIV-1), HIV-2, and dual HIV-1-HIV-2 infections in West African pregnant women. J Clin Microbiol 42:4147– 4153.https://doi.org/10.1128/JCM.42.9.4147-4153.2004. 32. Damond F, Collin G, Descamps D, Matheron S, Pueyo S, Taieb A, Campa
P, Benard A, Chêne G, Brun-Vezinet F. 2005. Improved sensitivity of human immunodeficiency virus type 2 subtype B plasma viral load assay. J Clin Microbiol 43:4234 – 4236.https://doi.org/10.1128/JCM.43.8 .4234-4236.2005.
33. Dib C, Fauré S, Fizames C, Samson D, Drouot N, Vignal A, Millasseau P, Marc S, Hazan J, Seboun E, Lathrop M, Gyapay G, Morissette J, Weissen-bach J. 1996. A comprehensive genetic map of the human genome based on 5,264 microsatellites. Nature 380:152–154.https://doi.org/10 .1038/380152a0.