Comparison of Five Level and Seven Level based
DSTATCOMs for Distribution System
K. Balaji Nanda Kumar Reddy1, Dr. V.C. Veera Reddy2
1
Research Scholar, Rayalaseema University, Professor, EEE Department, A.I.T.S, Tirupati, JNTUA
Abstract: DSTATCOM is capable of improving the voltage of weak buses in distribution systems. The objective of this research work is to reduce THD in the output of STATCOM using multilevel concept. This paper deals with Design, Modeling and Simulation of Ten Bus System using Matlab Simulink. The modelling of DSTATCOM and control of THD using multilevel DSTATCOM becomes an important issue. Ten Bus Distribution Systems (TBDS) with five and seven level STATCOMs are modulated, simulated and the results are presented here. The Simulation Results indicate that the real power loss and reactive power loss are reduced by introducing multiple numbers of STATCOMs. The STATCOMs are introduced at the weak buses and the reduction in losses was observed. The THD with seven levels based STATCOM is observed to be less than that of five level based STATCOM.
Keywords: TBDS - Ten Bus Distribution System FLSS - Five level STATCOM system SLSS - Seven level STATCOM system THD - Total Harmonic Distortion
I. INTRODUCTION
The customary consistent state steadiness studies and transient solidness consider the dynamic power stream and power edge and for the most part expect steady getting and sending end transport voltage. The receptive power stream and voltage fall amid overwhelming current stream is ignored. This approach could not explain the several black-outs in USA, Europe, Japan etc. during the last quarter of the twentieth century. The blackouts were due to voltage collapse. During voltage collapses, the bus voltage starts falling and as a result power transfer through the transmission line starts reducing resulting in ultimate voltage collapse and loss of system stability of entire network. That is the reason voltage security ponders have gotten more consideration and have obtained a fundamental place in power framework thinks about. Voltage fall wonders occur where receptive power administration is lacking. The application of power electronics in the electric power transmission plays an important role to make the system more reliable, controllable and efficient [1]. Because of deregulation, natural enactments and cost of development, it is ending up noticeably progressively hard constructing new transmission lines. Thus it is essential to fully utilize the capacities of the existing transmission system. The Flexible AC Transmission System (FACTS) has become a popular solution to our large/over extended power transmission & distribution system. FACTS devices are proving to be very effective in using the full transmission capacity while increasing power system stability, transmission efficiency and maintained power quality and reliability of power system. These devices are mainly based on either voltage source converter (VSC) or current source converter (CSC) and have fast response time. As an important member of FACTS devices family, STATCOM has been at the centre of attention and the subject of active research for many years. STATCOM is a shunt associated gadget that is utilized to give receptive power remuneration to a transmission line. This controller can either absorb or inject reactive power whose capacitive or inductive current can be controlled independent to the AC line voltage. Thus, STATCOM can enhance the transmission line load ability by extending the MW margin and improves the oscillation of voltage transients through efficient regulation of the transmission line voltage at the point of connection [1]-[3]. The device is connected to a load bus with a converter transformer. The displaying of shunt controller and testing is reproduced in the MATLAB/Simulink condition. The controller is spoken to as piece chart that presents down to earth electronic model of shunt controller. PID controller is used to control the current injection at the connection point by varying the desired parameters, one is Modulation Index (AM) and another is power angle (δ). Mainly there are four loop tuning methods for a PID controller; those are manual tuning, Ziegler-Nichols, Software Tools and Cohencoon Method.
coordinate control, decoupling control, cross control and framework control. The immediate control strategy is utilized here to control the yield of shunt associated FACT device.
II. BASIC CONFIGURATION AND PRINCIPLE OF OPERATION
Basically, shunt connected FACTS device can be realized by either a VSC or a CSC [4]. But the VSC topology is preferred because CSC topology is more complex than VSC in both power and control circuits. In CSC such as GTO (Gate Turn Off Thyristor) is used, a diode has to be placed in series with each of the switches. This almost doubles the conduction losses compared with the case of VSC. The DC link energy storage element in CSC topology is inductor where as that in VSC topology is a capacitor. Thus, the efficiency of a CSC is expected to be lower than that of a VSC [6]-[9]. The modelled STATCOM using VSC topology is being used in the test system to supply reactive power to increase the transmittable power and to make it more compatible with the prevailing load demand. Thus, the shunt connected FACTS device should be able to minimize the line over voltage under light load condition and maintain voltage levels under heavy load condition. Two VSC technologies can be used for the VSC. One of them, VSC is constructed with IGBT/GTO-based SPWM inverters. This type of inverter uses sinusoidal Pulse-Width Modulation (SPWM) technique to synthesize a sinusoidal waveform from a DC voltage source with a typical chopping frequency of a few kilohertz. Harmonic voltages are cancelled by connecting filters at the AC side of the VSC. This type of VSC uses a DC link voltage Vdc. Output voltage is varied by changing the modulation index of the SPWM modulator. Thus modulation index has to be varied for controlling the reactive power injection to the transmission line. In another type VSC is constructed with GTO-based square-wave inverters and special interconnection transformers. Typically four three-level inverters are used to build a 48-step voltage waveform. Special interconnection transformers are used to neutralize harmonics contained in the square waves generated by individual inverters. In this type of VSC, the fundamental component of output voltage is proportional to the voltage Vdc. Therefore
Vdc has to be varied for controlling the reactive power.
The shunt controller is like a current source, which draws from or injects current into the system at the point of connection. The shunt controller may be variable impedance, variable source or a combination of these [10]. Variable shunt impedance associated with the line voltage causes a variable current stream and thus speaks to infusion of current into the line. For whatever length of time that the infused current is in stage quadrature with the line voltage, the shunt controller just supplies or devours receptive power. When system voltage is low, the STATCOM generates reactive power (STATCOM capacitive). When system voltage is high, it absorbs reactive power (STATCOM inductive).
The variation of reactive power is performed by means of a VSC connected on the secondary side of a coupling transformer. The VSC uses forced-commutated power electronic devices (GTOs, IGBTs or IGCTs) to synthesize a voltage V2 from a DC voltage source. Any other phase relationship will involve handling of real power as well [11]. So, the shunt controller is therefore a good way to control the voltage at and around the point of connection through injection of reactive current (leading or lagging) alone or a combination of active and reactive current for a more effective voltage control and damping of voltage dynamics [12].
The above literature does not deal with comparison of five and seven level based STACOMs in ten bus radial distribution system. This work proposes seven level STATCOM for power quality improvement of ten bus system. The real power (P) and reactive power (Q) are expressed as follows:
III. SIMULATION RESULTS
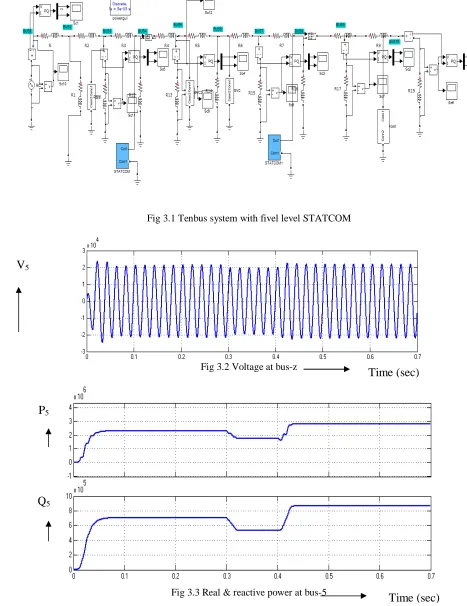
The Ten bus system with five level and seven level STATCOMs are modelld and simulated. The results are discussed in this section.3.1. Ten bus system with five level STATCOM is shown in Fig 3.1. Each section of the feeder is represented as a series combination of Resistance and reactance. STATCOMs are introduced at buses 5 and 9. The voltage at bus five is shown in Fig 3.2 and its peak value is 20KV. The real and reactive power at bus five are shown in Fig 3.3 and value of real power 3 MW and
P = V1.V
2 Sin ( X
Q =
V2
(V2 Cos δ –V1)
(2) X
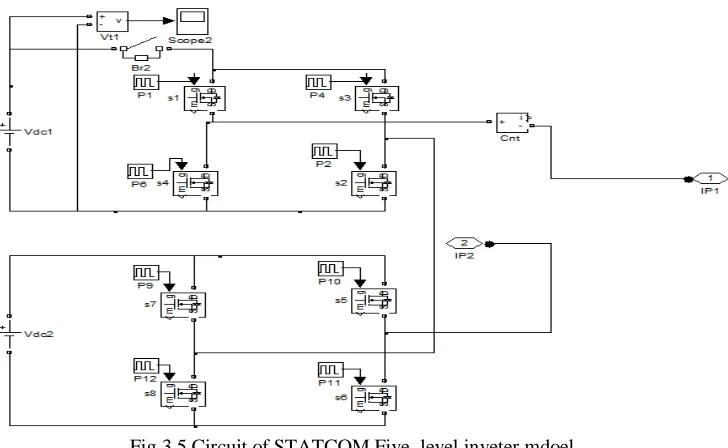
Reactive power value is 8.9 MW. The spectrum for current through load at bus Five is shown in Fig 3.4. The THD current is 7.1 %. The circuit of five level STATCOM is shown in Fig 3.5. Two inverters in series cascading produce five level output.
Fig 3.1 Tenbus system with fivel level STATCOM
Fig 3.2 Voltage at bus-z
Fig 3.3 Real & reactive power at bus-5
P
5Q
5Time (sec)
V
5 [image:4.612.57.524.136.742.2]Fig 3.4 Frequency Spectrum for th current througn the load at Bus 5
Fig 3.5 Circuit of STATCOM Five level inveter mdoel
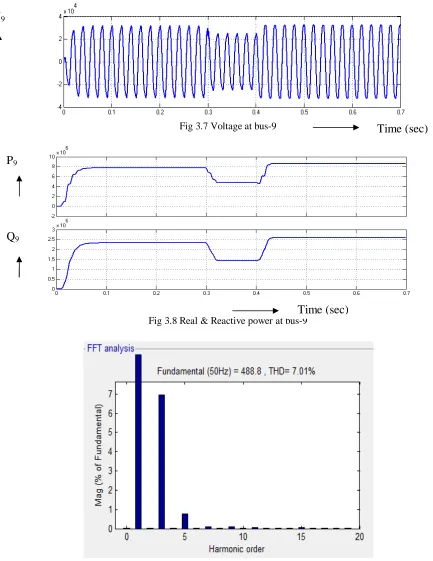
The output voltage of inverter is shown in Fig 3.6 and its peak value is 450 V. The voltage at bus nine is shown in Fig 3.7 and its peak value is 3* 106V. The real and reactive powers are shown in Fig 3.8 and its value of real power 8 *106W, reactive power value
is 2.6*106 VAR W. The spectrum for current through load at bus nine is shown in Fig 3.9. The THD content is 7.01%.
Fig 3.6 Output voltage of Five level inverter
Time (sec)
[image:5.612.96.480.557.716.2]Fig 3.7 Voltage at bus-9
Fig 3.8 Real & Reactive power at bus-9
Fig 3.9 Frequency spectrum for current through the load
A. Ten Bus system with Seven Level STATCOMs
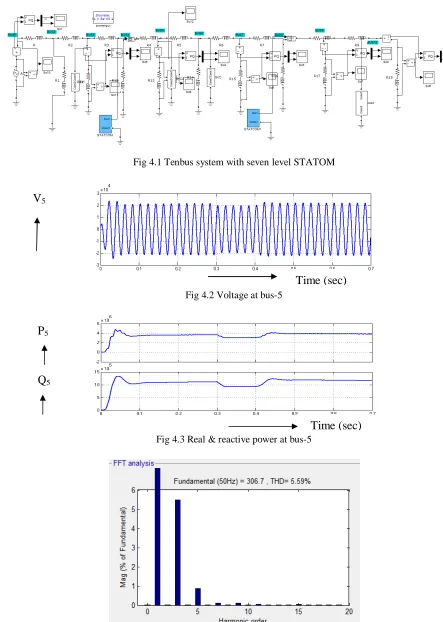
Ten bus system with seven level STATCOM is shown in Fig 4.1. STATCOM are added at two location to improve the voltage profile. They are added at bus 5 and bus 9. The voltage at bus five is shown in Fig 4.2 and its peak value is 3*104 V. The real and reactive powers are shown in Fig 4.3 and its value of real power 4*106W, and its value of reactive power are shown is 11*105, VAR. The spectrum for current through load at bus five is shown in Fig 4.4. The seven level STATCOM is shown in Fig 4.5.
V
9Time (sec)
P
9Q
9Fig 4.1 Tenbus system with seven level STATOM
Fig 4.2 Voltage at bus-5
Fig 4.3 Real & reactive power at bus-5
Fig 4.4 Frequency Spectrum for current through load at bus 5
V
5Time (sec)
Time (sec)
P
5Fig 4.5 Circuit of seven level STATCOM
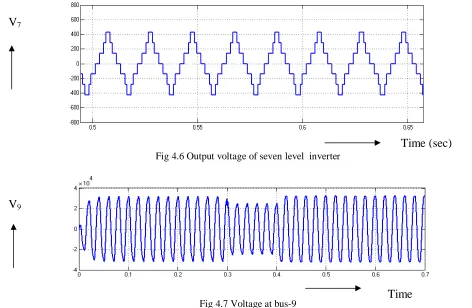
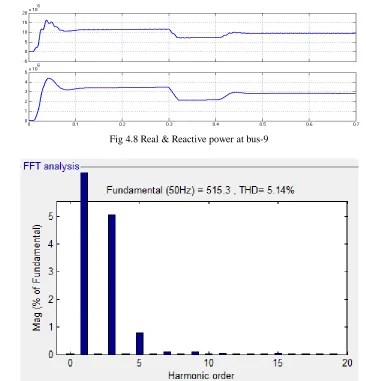
The output voltage of inverter is shown in Fig 4.6 and its value is 430 V. The voltage at bus nine is shown in Fig 4.7 and its peak value is 3*104 VAR. The real and reactive power at are shown in Fig 4.8 and real power is value 11*106W, reactive power value is 3.5*106 VAR. The spectrum for current through load at bus nine is shown in Fig 4.9. The THD is 5.1%. The comparison of real and reactive power at bus five is shown in Table-1. The comparison of real and reactive power at bus nine is shown in Table-2. The THD of SLSS is 1.5 % less than that of FLSS.
Fig 4.6 Output voltage of seven level inverter
Fig 4.7 Voltage at bus-9
Time (sec)
V
7V
9 [image:8.612.58.530.428.736.2]Fig 4.8 Real & Reactive power at bus-9
Fig 4.9 Frequency Spectrum for current through load at Bus-9.
Table-1
comparsion of real & reactive power at bus-5
STATCOM THD Real power (MW) Reactive power(MVAR)
FLSS 7.12% 2.981 0.917
SLSS 5.59% 4.021 1.015
Table-2
comparsion of real & reactive power at bus-9
STATCOM THD Real power (MW) Reactive power(MVAR)
FLSS 7.01% 8.210 2.501
SLSS 5.14% 9.912 2.920
IV. CONCLUSION
The conclusions derived from simulation work on FLSS & SLSS presented in previous section has been summarized. Ten Bus Distribution System was successfully modelled and simulated using the blocks of Simulink and the results are described. Voltage Sag was created by adding extra load and it is compensated by using STATCOM. The THD is reduced by 2 percentage by replacing five level STATCOM with seven level STATCOM. The real and reactive powers delivered to the load increase by 10 % by using SLS instead of FLSS. The results obtained in this paper are clear example of improvement in power quality using multilevel
Q
9STATCOM. The advantages of proposed system are reduced heating of distribution lines and improved voltage profile. The disadvantage of STATCOM is that it requires large DC Capacitor at the input and eight switches per phase.
The scope of the present work is to study the performance of SLSS in ten bus system. The performance of SLSS in thirty bus system will be studied in future. Closed loop controlled SLSS to extend control capability will be studied in future.
REFERENCES
[1] Ricardo D.M., Juan M.R. and Ruben T.O., 2005. Three-phase multi-pulse converter STATCOM analysis. International Journal of Electrical Power & Energy Systems 27(1): 39-51.
[2] Moran, P.D., Ziogas, L.T., Joos, G. and Hingorani, N.G., 1989. Analysis and design of a three-phase current source solid- state var compensator. IEEE Transactions on Industrial Application 25(2): 356-365.
[3] Gyugyi, L., 1994 Dynamic compensation of AC transmission lines by solid-state synchronous voltage sources. IEEE Transactions on power Delivery 9(2): 904-911.
[4] Gyugyi, L., Schauder, C.D., Williams, S.L., Reitman, T.R., Torgerson, D.R., and Edris, A., 1995. The unified power flow controller: A new approach to power transmission control. IEEE transactions on power delivery 10(2): 1085-1097.
[5] Ye, Y.,Kazerani, M., and Quintana, V.H.2005. Current-Source Converter, Based STATCOM:Modeling and control. IEEE Tansactions on Power Delivery 20(2):795-800.
[6] Tavakoli Bina, M., Eskandari, M.D. and Panahlou, M., 2005. Design and installation of a # 250 kV ArD-STATCOM for a distribution substation. Electric Power Systems Research 73(3): 383-391.
[7] Puleston, P.F., Gonzalez, S.A. and Valenciaga, F., 2007. A STATCOM based variable structure control for power system oscillations damping. International journal of Electrical Power & Energy Systems 29(3):241-250
[8] Iyer, S., Ghosh, A. and Joshi, A., 2005. Inverter topologies for DSTATCOM applications-a simulation study. Electric Power Systems Research 75(3-2): 161-170.
[9] Schauder, C.D. and H. Mehta, 1993. Vector analysis and control of advanced static VAR compensators. IEEE Proceedings 140(4): 299-306.
[10] Lehn, P.W. and M.R. Iravani, 1998. Experimental evaluation of STATCOM closed loop dynamics. IEEE Transactions on Power Delivery 13(4): 1378-1384. [11] Fujita, H., Akagi, H. and Watanabe, Y., 2006. Dynamic control and performance of a unified power flow controller for stabilizing an AC transmission system.
IEEE Transactions on Power Electronics 21(4): 1013-1020.
[12] El-Moursi, M.S. and A.M. Sharaf, 2006. Novel reactive power controllers for the STATCOM and SSSC. Electric Power Systems Research 76(4): 228-241. [13] Jower F.A., 2007, Improvement of synchronizing power and damoing power by means of SSSC and STATCOM: A comparative study. Electric Power
Systems Research 77(8): 1112-1117.
[14] Applications, In Proceedings IEEE Power Engineering Society Winter Meeting. 1177-1183. Yankui, Z., Yan, Z., Bei, W, and Jian, Z., 2006. Power injection model of STATCOM with control and operating limit for power flow and voltage stability analysis. Electric Power Systems Research 76(12): 1003-1010. [15] Hingorani, N. G. and L. Gygugyi, 2000. Understanding FACTS: Concepts and Technology of Flexible AC Transmission Systems. New York: IEEE Press. [16] Sen, K.K., 199. STATCOM-STA Ticsynchronous COM Pensator: Theory, modeling, and O. Farrok. M.G. Rabbani and M.R. Islam/International Energy
Journal 11(2010) 43-50.