© 2017, IRJET | Impact Factor value: 5.181 | ISO 9001:2008 Certified Journal
| Page 211
Analysis of Wind Response on Different Shapes of High Rise Mivan Wall
Buildings by Using Gust Factor Method
Hemanthkumar M S
1, Kiran.T
2,
1
M.E Student, Dept. of Civil Engg. UVCE, Bengaluru, Karnataka, India
2Assistant Professor, Dept. of Civil Engg. UVCE, Bengaluru, Karnataka, India
---***---Abstract -
In addition to gravity loads, high rise buildingsare susceptible to wind loads hence the magnitude and nature of these wind loads has to be determined and the structure has to be analyzed for the wind loads to understand its behavior. This work focuses on the wind produced response of the high rise building by taking G+20 Storey building .The structure under study is a Mivan structure where in which the slab wall system is adopted in place of moment resting frame for the building. This study concentrates on the horizontal irregularities by considering different shapes in plan of the structure. Magnitudes of wind loads are dependent on the area of exposure of the building, hence the shape of the building has to be studied with due importance as the area of exposure is dependent on shape. Different shaped building will have different responses to the applied lateral loads. Hence in this study an attempt has been made to predict the effect of different shapes of building for wind loads.In this work wind forces are calculated based on Gust effectiveness factor method. Gust effectiveness factor method is known for rational and realistic way of calculating dynamic wind loads. The wind loads so calculated by this method are applied for various shapes of the building models and are analyzed. The results obtained for different models are correlated to predict the better performance against the wind loads amongst the different shapes considered.
Key Words: Mivan Technology, Gust Factor Method,
Horizontal Irregularities, Wind Responses, Dynamic wind.
1. INTRODUCTION
Growing population, race towards new heights, new architecture and growing economy around the globe has intensified the urbanization .This phenomenon has led to grow vertical, as the horizontal growths have reached an extent of saturation. Hence High rise buildings have become more prevalent in most of the cities, replacing vast areas of small houses. The race towards the new heights and architecture is associated with many challenges. In high rise buildings, Lateral loads will be of primary concern rather than just gravity loads. Lateral loads induce heavy moments and forces on the high rise buildings. Presence of asymmetry in plan of the high rise building adds complexity to the building as it introduces torsional effects. Hence the study of responses of different types of structural elements used and the different shapes of building adopted is of immense important to choose the perfect combination of structural
element and the shape of a building which minimize the lateral displacement.
In general, it is very much necessary that both wind as well as earthquake loads should be considered for the design of tall buildings. Governing criteria for carrying out dynamic analysis of high rise buildings for wind loads are different from earthquake loads. The present study is on the dynamic wind effects on high rise buildings and describes about response of the structures for the various wind actions to choose better shape of structure among C, H, L and T. The structural system considered is a structural wall system which is widely adopted due to its ample of advantages, in the construction of high rise buildings in recent days.
1.1 Mivan Technology
Construction sector is one of the major sectors which contributes more to Indian economy and is an integral part of the development. Increased rate of population growth has led to increased demand for housing.
There is a growing realization today that speed of construction needs to be given greater importance especially for large housing projects for achieving the national objective of creating a large stock to overcome shortest possible time. Fortunately, one such technology catering to faster speed of construction is Mivan technology.
Mivan is an Aluminum formwork system which has empowered and motivated the mass construction projects throughout the world. Mivan technology has got wide range of advantages like fast long-lasting, economical, and adaptive and produces excellent quality work which reduces cost of maintenance. Mivan technology is best suited for the developing countries like India since fully cast in situ concrete structures can be erected easily with the help of aluminum form work.
© 2017, IRJET | Impact Factor value: 5.181 | ISO 9001:2008 Certified Journal
| Page 212
the help of Mivan technology. This aluminum form worksystem is proved to be most suited kind of form work for a kind of construction environment in India.
Mivan technology is widely used in Asia, Europe, Gulf countries and in other parts of the globe also. Adoption of steam curing allows the premature removal of moulds hence adds to the rate of construction, about two flats for a day. Every activity is arranged in assembly line manner. Thus, this system produces well controlled and more precise and superior production at optimal cost in shorter time period. The forms are finished tough and care is taken that the finished forms are fabricated with high precision. Concrete is manufactured in ready concrete mix plants under firm caliber control and transported to site with transit mixers. Before concreting, the frames for doors, windows, and ducts are placed in the form for service. Staircase, chejjas also different pre-fabricated things are consolidated under that structure. This may be a boss preference when contrasted with different current development systems.
1.2 Horizontal Irregularities
An irregular structure is one which exceeds the limits prescribed by different design codes. Horizontal irregularity limits and vertical irregularity limits have been discussed in the relevant codes. The structure may have two types of irregularities namely Horizontal irregularities and vertical irregularities. The present study concentrates on the Horizontal irregularities in the tall structures. A horizontal irregularity occurs if center of mass and the center of stiffness of the structure do not coincide, which may result in eccentricities in the structure finally giving rise to the torsion in the structure. As for as possible the irregularities should be minimized for the better performance of the buildings but now a days it is unavoidable that the structure is designed for the irregularities.
2. OBJECTIVES
The objectives of this study can be listed as follows
• To study the Dynamic Wind response of high rise irregular Mivan wall building by Gust factor method of wind analysis.
• To correlate the Gust Wind response of different shapes of High rise irregular Mivan wall building.
3. METHODOLOGY
General Steps followed
• In ETABS software Modeling of C-shaped, H-shaped L-shaped and T L-shaped buildings.
• Gust factored Wind load calculations by using the formulae specified in IS-875 (part –III) -1987 in Excel spread sheets.
• Importing the wind loads calculated in excel sheets to the ETABS and applying the same to the respective building models.
•
Analyzing all the models in ETABS.•
Comparing the results of C, H, L, and T shaped buildings.3.1 Structural Models
G+20 storied tall Mivan wall C-shaped, I-shaped, L-shaped and T-L-shaped building models are considered as a part irregularity for modeling. 700 Square.m is the Plan Area of each model. Depth of foundation is restricted to 2m from the natural ground level and storey height of the building including ground storey is kept 3.5m for all type of buildings. ETABS 9.7.0 version software is used for structural modeling and analysis. Different material parameters and sectional parameters used while modeling are listed in the tables below.
The behaviour of the building against wind loads varies with the area of exposure of the building so, at most care should be taken while arriving at different shapes in plan. Buildings shape in plan is chosen in such a way that total area in plan of all the buildings is same so that value of dead and live load remains almost same. For convenient arrangement of different shapes, the plan area is divided into grid of size 5mX5m.
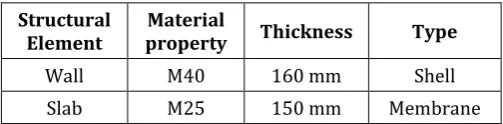
[image:2.595.308.560.476.538.2]As this work focuses on the behavioural examination of Mivan wall system or structural Slab Wall System the structural components are modeled by using Slab and wall elements only.
Table -1: Section Properties
Structural
Element property Material Thickness Type
Wall M40 160 mm Shell
Slab M25 150 mm Membrane
Dimensional details of buildings used for modeling
• Building height : 73.5m
• Storey height : 3.5m
3.2 Types of Models
Before knowing the best shape among the C-shape, H-shape, L-shape and T-shape it is a prime thing to choose the better plan arrangement that is nothing but better lateral length ratio for which all the shapes experience minimum wind load. To arrive at this, each shape is modeled and analysed for 2 lateral length ratios. Hence there are 2 types of C, H, L and T shapes under study.
© 2017, IRJET | Impact Factor value: 5.181 | ISO 9001:2008 Certified Journal
| Page 213
TYPE-2 models. Among the TYPE-1 and TYPE-2 modelsbetter resisted type will be chosen for further study to know better shape among C, H, L and T shape.
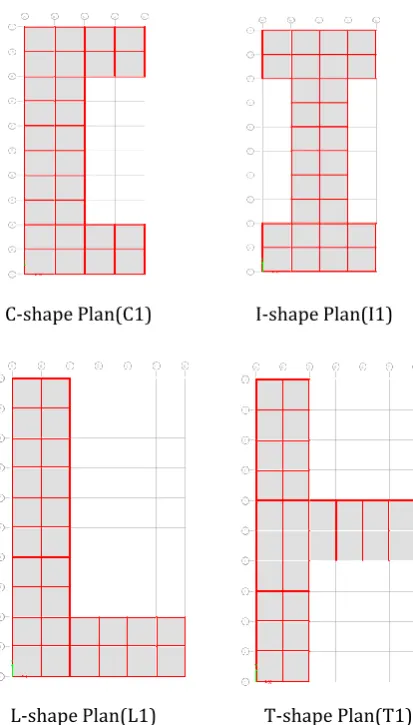
C-shape Plan(C1)
I-shape Plan(I1) [image:3.595.311.555.95.254.2]L-shape Plan(L1)
T-shape Plan(T1)Fig. 1 Plan of Type 1 Models
C-shape Plan(C2)
I-shape Plan(I2)L-shape Plan(L2)
T-shape Plan(T2) Fig. 2 Plan of Type 2 Models3.3
Parameters Considered for Wind load CalculationThe wind load is dependent on various parameters and are to be given due importance while selecting particular parameter. IS 875 (Part III) -1987 has given detailed information about the parameters which are to be considered in the calculation of wind loads. They are • Life of the Structure
• Terrain Category • Topography • Location
These parameters are further divided in to subcategories and are accounted in the load calculation in the form of coefficients. The coefficients k1(risk factor), k2 (terrain factor) and k3(topography factor) which are used in the calculation of design hourly mean wind speed are selected based on life of the structure, terrain category and topography respectively. The basic wind speed is dependent on the location of the structure, as per IS-875 (Part III) 1987 our country is divided in to 6 zones based on the basic wind speeds in each zone.The following are the parameters which are considered for present study
• Life of the Structure : 50 years
• Terrain category : Category 2
• Topography : Flat
• Location : Madras
• Basic wind speed : 50 m/s
• Building height : 73.5 m
• Storey Height : 3.5 m
3.3.1 Gust Factor wind load calculation
[image:3.595.52.259.133.496.2]© 2017, IRJET | Impact Factor value: 5.181 | ISO 9001:2008 Certified Journal
| Page 214
Table -2: Gust Wind loads along 0 degree and 180 degree for C1 and H1 shape building.STOREY HEIGHT m K2' m/s Vz kN/mPz 2 CYCLES/SEC Fo S foL(h)/Vh E G FORCE kN
GSTORY 3.5 0.670 33.50 0.6734 17.7995 0.0366 32.2894 0.0557 1.9545 299.410
STORY1 7 0.670 33.50 0.6734 17.7995 0.0366 32.2894 0.0557 1.9545 299.410
STORY2 10.5 0.675 33.75 0.6834 17.6677 0.0370 32.0502 0.0562 1.9559 304.102
STORY3 14 0.710 35.50 0.7562 16.7968 0.0393 30.4703 0.0591 1.9654 338.101
STORY4 17.5 0.735 36.75 0.8103 16.2254 0.0409 29.4339 0.0608 1.9720 363.545
STORY5 21 0.754 37.70 0.8528 15.8166 0.0422 28.6922 0.0619 1.9768 383.513
STORY6 24.5 0.768 38.40 0.8847 15.5282 0.0431 28.1692 0.0627 1.9804 398.609
STORY7 28 0.782 39.10 0.9173 15.2503 0.0440 27.6649 0.0636 1.9840 414.033
STORY8 31.5 0.795 39.73 0.9468 15.0103 0.0449 27.2296 0.0643 1.9873 428.082
STORY9 35 0.805 40.25 0.9720 14.8145 0.0456 26.8744 0.0649 1.9901 440.087
STORY10 38.5 0.816 40.78 0.9976 14.6238 0.0463 26.5284 0.0655 1.9929 452.280
STORY11 42 0.826 41.30 1.0234 14.4379 0.0470 26.1912 0.0661 1.9957 464.661
STORY12 45.5 0.837 41.83 1.0496 14.2567 0.0477 25.8624 0.0667 1.9986 477.233
STORY13 49 0.847 42.35 1.0761 14.0799 0.0484 25.5418 0.0673 2.0015 489.994
STORY14 52.5 0.854 42.68 1.0927 13.9727 0.0489 25.3473 0.0676 2.0033 497.990
STORY15 56 0.858 42.92 1.1053 13.8929 0.0492 25.2026 0.0679 2.0046 504.067
STORY16 59.5 0.863 43.17 1.1179 13.8141 0.0495 25.0596 0.0682 2.0060 510.185
STORY17 63 0.868 43.41 1.1307 13.7361 0.0499 24.9181 0.0684 2.0074 516.345
STORY18 66.5 0.873 43.66 1.1435 13.6590 0.0502 24.7783 0.0687 2.0087 522.548
STORY19 70 0.878 43.90 1.1563 13.5828 0.0505 24.6400 0.0690 2.0101 528.793
STORY20 73.5 0.883 44.15 1.1693 13.5074 0.0509 24.5032 0.0693 2.0115 496.860
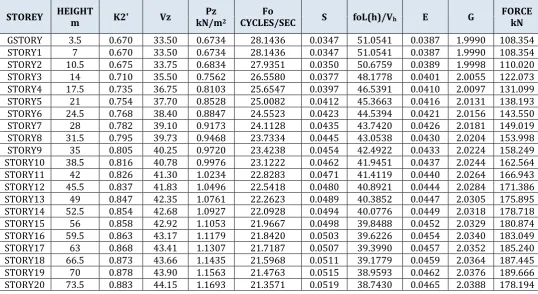
Table -3: Gust Wind loads along 90 degree and 270 degree for C1 and H1 shape building.
STOREY HEIGHT m K2' Vz kN/mPz 2 CYCLES/SEC Fo S foL(h)/Vh E G FORCE kN
GSTORY 3.5 0.670 33.50 0.6734 28.1436 0.0347 51.0541 0.0387 1.9990 108.354
STORY1 7 0.670 33.50 0.6734 28.1436 0.0347 51.0541 0.0387 1.9990 108.354
STORY2 10.5 0.675 33.75 0.6834 27.9351 0.0350 50.6759 0.0389 1.9998 110.020
STORY3 14 0.710 35.50 0.7562 26.5580 0.0377 48.1778 0.0401 2.0055 122.073
STORY4 17.5 0.735 36.75 0.8103 25.6547 0.0397 46.5391 0.0410 2.0097 131.099
STORY5 21 0.754 37.70 0.8528 25.0082 0.0412 45.3663 0.0416 2.0131 138.193
STORY6 24.5 0.768 38.40 0.8847 24.5523 0.0423 44.5394 0.0421 2.0156 143.550
STORY7 28 0.782 39.10 0.9173 24.1128 0.0435 43.7420 0.0426 2.0181 149.019
STORY8 31.5 0.795 39.73 0.9468 23.7334 0.0445 43.0538 0.0430 2.0204 153.998
STORY9 35 0.805 40.25 0.9720 23.4238 0.0454 42.4922 0.0433 2.0224 158.249
STORY10 38.5 0.816 40.78 0.9976 23.1222 0.0462 41.9451 0.0437 2.0244 162.564
STORY11 42 0.826 41.30 1.0234 22.8283 0.0471 41.4119 0.0440 2.0264 166.943
STORY12 45.5 0.837 41.83 1.0496 22.5418 0.0480 40.8921 0.0444 2.0284 171.386
STORY13 49 0.847 42.35 1.0761 22.2623 0.0489 40.3852 0.0447 2.0305 175.895
STORY14 52.5 0.854 42.68 1.0927 22.0928 0.0494 40.0776 0.0449 2.0318 178.718
STORY15 56 0.858 42.92 1.1053 21.9667 0.0498 39.8488 0.0452 2.0329 180.874
STORY16 59.5 0.863 43.17 1.1179 21.8420 0.0503 39.6226 0.0454 2.0340 183.049
STORY17 63 0.868 43.41 1.1307 21.7187 0.0507 39.3990 0.0457 2.0352 185.240
STORY18 66.5 0.873 43.66 1.1435 21.5968 0.0511 39.1779 0.0459 2.0364 187.445
STORY19 70 0.878 43.90 1.1563 21.4763 0.0515 38.9593 0.0462 2.0376 189.666
[image:4.595.32.571.434.728.2]© 2017, IRJET | Impact Factor value: 5.181 | ISO 9001:2008 Certified Journal
| Page 215
Table -4: Gust Wind loads along 0 degree and 180 degree for L1 and T1 shape buildingSTOREY HEIGHT m K2' Vz kN/mPz 2 CYCLES/SEC Fo S foL(h)/Vh E G FORCE kN
GSTORY 3.5 0.670 33.50 0.6734 21.7999 0.0267 39.5463 0.0455 1.9212 305.619
STORY1 7 0.670 33.50 0.6734 21.7999 0.0267 39.5463 0.0455 1.9212 305.619
STORY2 10.5 0.675 33.75 0.6834 21.6384 0.0271 39.2534 0.0459 1.9223 310.383
STORY3 14 0.710 35.50 0.7562 20.5717 0.0301 37.3183 0.0482 1.9308 344.924
STORY4 17.5 0.735 36.75 0.8103 19.8720 0.0321 36.0490 0.0499 1.9370 370.832
STORY5 21 0.754 37.70 0.8528 19.3713 0.0331 35.1406 0.0512 1.9408 391.000
STORY6 24.5 0.768 38.40 0.8847 19.0181 0.0339 34.5000 0.0522 1.9436 406.240
STORY7 28 0.782 39.10 0.9173 18.6777 0.0346 33.8824 0.0531 1.9464 421.804
STORY8 31.5 0.795 39.73 0.9468 18.3838 0.0353 33.3493 0.0540 1.9490 435.976
STORY9 35 0.805 40.25 0.9720 18.1440 0.0358 32.9143 0.0547 1.9512 448.083
STORY10 38.5 0.816 40.78 0.9976 17.9104 0.0364 32.4905 0.0554 1.9534 460.376
STORY11 42 0.826 41.30 1.0234 17.6827 0.0369 32.0775 0.0561 1.9557 472.855
STORY12 45.5 0.837 41.83 1.0496 17.4608 0.0375 31.6749 0.0568 1.9580 485.523
STORY13 49 0.847 42.35 1.0761 17.2443 0.0381 31.2822 0.0575 1.9603 498.380
STORY14 52.5 0.854 42.68 1.0927 17.1130 0.0384 31.0440 0.0580 1.9618 506.434
STORY15 56 0.858 42.92 1.1053 17.0153 0.0387 30.8668 0.0583 1.9629 512.553
STORY16 59.5 0.863 43.17 1.1179 16.9187 0.0389 30.6916 0.0586 1.9640 518.715
STORY17 63 0.868 43.41 1.1307 16.8232 0.0392 30.5183 0.0590 1.9651 524.918
STORY18 66.5 0.873 43.66 1.1435 16.7288 0.0394 30.3471 0.0593 1.9662 531.163
STORY19 70 0.878 43.90 1.1563 16.6355 0.0397 30.1777 0.0596 1.9674 537.449
STORY20 73.5 0.883 44.15 1.1693 16.5431 0.0400 30.0102 0.0600 1.9685 504.937
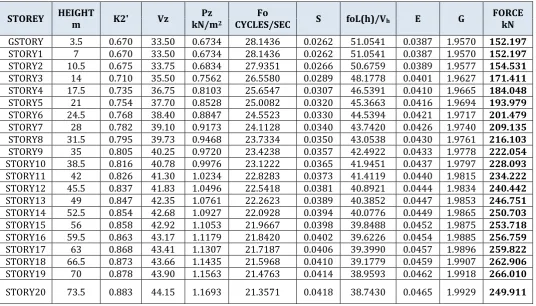
Table -5: Gust Wind loads along 90 degree and 270 degree for L1 and T1 shape building.
STOREY HEIGHT m K2' Vz kN/mPz 2 CYCLES/SEC Fo S foL(h)/Vh E G FORCE kN
GSTORY 3.5 0.670 33.50 0.6734 28.1436 0.0262 51.0541 0.0387 1.9570 152.197
STORY1 7 0.670 33.50 0.6734 28.1436 0.0262 51.0541 0.0387 1.9570 152.197
STORY2 10.5 0.675 33.75 0.6834 27.9351 0.0266 50.6759 0.0389 1.9577 154.531
STORY3 14 0.710 35.50 0.7562 26.5580 0.0289 48.1778 0.0401 1.9627 171.411
STORY4 17.5 0.735 36.75 0.8103 25.6547 0.0307 46.5391 0.0410 1.9665 184.048
STORY5 21 0.754 37.70 0.8528 25.0082 0.0320 45.3663 0.0416 1.9694 193.979
STORY6 24.5 0.768 38.40 0.8847 24.5523 0.0330 44.5394 0.0421 1.9717 201.479
STORY7 28 0.782 39.10 0.9173 24.1128 0.0340 43.7420 0.0426 1.9740 209.135
STORY8 31.5 0.795 39.73 0.9468 23.7334 0.0350 43.0538 0.0430 1.9761 216.103
STORY9 35 0.805 40.25 0.9720 23.4238 0.0357 42.4922 0.0433 1.9778 222.054
STORY10 38.5 0.816 40.78 0.9976 23.1222 0.0365 41.9451 0.0437 1.9797 228.093
STORY11 42 0.826 41.30 1.0234 22.8283 0.0373 41.4119 0.0440 1.9815 234.222
STORY12 45.5 0.837 41.83 1.0496 22.5418 0.0381 40.8921 0.0444 1.9834 240.442
STORY13 49 0.847 42.35 1.0761 22.2623 0.0389 40.3852 0.0447 1.9853 246.751
STORY14 52.5 0.854 42.68 1.0927 22.0928 0.0394 40.0776 0.0449 1.9865 250.703
STORY15 56 0.858 42.92 1.1053 21.9667 0.0398 39.8488 0.0452 1.9875 253.718
STORY16 59.5 0.863 43.17 1.1179 21.8420 0.0402 39.6226 0.0454 1.9885 256.759
STORY17 63 0.868 43.41 1.1307 21.7187 0.0406 39.3990 0.0457 1.9896 259.822
STORY18 66.5 0.873 43.66 1.1435 21.5968 0.0410 39.1779 0.0459 1.9907 262.906
STORY19 70 0.878 43.90 1.1563 21.4763 0.0414 38.9593 0.0462 1.9918 266.010
[image:5.595.31.568.430.736.2]© 2017, IRJET | Impact Factor value: 5.181 | ISO 9001:2008 Certified Journal
| Page 216
Table -6: Gust Wind loads along 0,90,180 and 270 degree for C2 and H2 shape buildingSTOREY HEIGHT m K2' Vz kN/mPz 2 CYCLES/SEC Fo S foL(h)/Vh E G FORCE kN
GSTORY 3.5 0.670 33.50 0.6734 21.7999 0.0403 39.5463 0.0455 1.9889 189.833
STORY1 7 0.670 33.50 0.6734 21.7999 0.0403 39.5463 0.0455 1.9889 189.833
STORY2 10.5 0.675 33.75 0.6834 21.6384 0.0409 39.2534 0.0459 1.9903 192.814
STORY3 14 0.710 35.50 0.7562 20.5717 0.0445 37.3183 0.0482 2.0006 214.437
STORY4 17.5 0.735 36.75 0.8103 19.8720 0.0471 36.0490 0.0499 2.0084 230.697
STORY5 21 0.754 37.70 0.8528 19.3713 0.0490 35.1406 0.0512 2.0143 243.486
STORY6 24.5 0.768 38.40 0.8847 19.0181 0.0504 34.5000 0.0522 2.0187 253.168
STORY7 28 0.782 39.10 0.9173 18.6777 0.0518 33.8824 0.0531 2.0232 263.073
STORY8 31.5 0.795 39.73 0.9468 18.3838 0.0530 33.3493 0.0540 2.0274 272.107
STORY9 35 0.805 40.25 0.9720 18.1440 0.0541 32.9143 0.0547 2.0309 279.836
STORY10 38.5 0.816 40.78 0.9976 17.9104 0.0552 32.4905 0.0554 2.0345 287.693
STORY11 42 0.826 41.30 1.0234 17.6827 0.0563 32.0775 0.0561 2.0382 295.681
STORY12 45.5 0.837 41.83 1.0496 17.4608 0.0574 31.6749 0.0568 2.0419 303.800
STORY13 49 0.847 42.35 1.0761 17.2443 0.0585 31.2822 0.0575 2.0457 312.051
STORY14 52.5 0.854 42.68 1.0927 17.1130 0.0592 31.0440 0.0580 2.0481 317.226
STORY15 56 0.858 42.92 1.1053 17.0153 0.0597 30.8668 0.0583 2.0499 321.161
STORY16 59.5 0.863 43.17 1.1179 16.9187 0.0602 30.6916 0.0586 2.0517 325.126
STORY17 63 0.868 43.41 1.1307 16.8232 0.0607 30.5183 0.0590 2.0535 329.120
STORY18 66.5 0.873 43.66 1.1435 16.7288 0.0613 30.3471 0.0593 2.0554 333.143
STORY19 70 0.878 43.90 1.1563 16.6355 0.0618 30.1777 0.0596 2.0572 337.196
STORY20 73.5 0.883 44.15 1.1693 16.5431 0.0623 30.0102 0.0600 2.0591 316.903
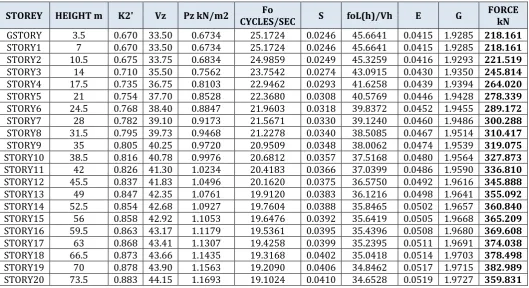
Table -7: Gust Wind loads along 0,90,180 and 270 degree for L2 and T2 shape building
STOREY HEIGHT m K2' Vz Pz kN/m2 CYCLES/SEC Fo S foL(h)/Vh E G FORCE kN
GSTORY 3.5 0.670 33.50 0.6734 25.1724 0.0246 45.6641 0.0415 1.9285 218.161
STORY1 7 0.670 33.50 0.6734 25.1724 0.0246 45.6641 0.0415 1.9285 218.161
STORY2 10.5 0.675 33.75 0.6834 24.9859 0.0249 45.3259 0.0416 1.9293 221.519
STORY3 14 0.710 35.50 0.7562 23.7542 0.0274 43.0915 0.0430 1.9350 245.814
STORY4 17.5 0.735 36.75 0.8103 22.9462 0.0293 41.6258 0.0439 1.9394 264.020
STORY5 21 0.754 37.70 0.8528 22.3680 0.0308 40.5769 0.0446 1.9428 278.339
STORY6 24.5 0.768 38.40 0.8847 21.9603 0.0318 39.8372 0.0452 1.9455 289.172
STORY7 28 0.782 39.10 0.9173 21.5671 0.0330 39.1240 0.0460 1.9486 300.288
STORY8 31.5 0.795 39.73 0.9468 21.2278 0.0340 38.5085 0.0467 1.9514 310.417
STORY9 35 0.805 40.25 0.9720 20.9509 0.0348 38.0062 0.0474 1.9539 319.075
STORY10 38.5 0.816 40.78 0.9976 20.6812 0.0357 37.5168 0.0480 1.9564 327.873
STORY11 42 0.826 41.30 1.0234 20.4183 0.0366 37.0399 0.0486 1.9590 336.810
STORY12 45.5 0.837 41.83 1.0496 20.1620 0.0375 36.5750 0.0492 1.9616 345.888
STORY13 49 0.847 42.35 1.0761 19.9120 0.0383 36.1216 0.0498 1.9641 355.092
STORY14 52.5 0.854 42.68 1.0927 19.7604 0.0388 35.8465 0.0502 1.9657 360.840
STORY15 56 0.858 42.92 1.1053 19.6476 0.0392 35.6419 0.0505 1.9668 365.209
STORY16 59.5 0.863 43.17 1.1179 19.5361 0.0395 35.4396 0.0508 1.9680 369.608
STORY17 63 0.868 43.41 1.1307 19.4258 0.0399 35.2395 0.0511 1.9691 374.038
STORY18 66.5 0.873 43.66 1.1435 19.3168 0.0402 35.0418 0.0514 1.9703 378.498
STORY19 70 0.878 43.90 1.1563 19.2090 0.0406 34.8462 0.0517 1.9715 382.989
[image:6.595.32.562.437.725.2]© 2017, IRJET | Impact Factor value: 5.181 | ISO 9001:2008 Certified Journal
| Page 217
4. RESULTS AND DISCUSSIONS
A comparative behavioural study of high rise irregular Mivan-wall structures has been done, with the aim of response optimization of the building against the wind loads and to verify more adoptable arrangements of the shapes, so that the building is exposed to minimum wind pressure. All the C, H, L and T shapes are analysed for 2 different arrangements i.e. for 2 lateral length ratios.
Behaviour of the structures is also studied for three different load application types that is, for Diaphragm loads, for joint loads and for Pressure loads. Then different shaped building models are compared with the help of results obtained from the analysis to arrive at the best shaped building model among C-shape, H-shape, L-shape and T-
shapes. To assess the best shape among the models, the
buildings are studied for storey displacements, inter storey drifts and storey shears.
4.1 Comparison of Results Different Arrangements
Graph -1: Storey displacements (Along X and Y direction) of C shaped models.
Graph -2: Storey displacements (Along X and Y direction) of H shaped models.
Graph -3: Storey displacements (Along X and Y direction) of L shaped models.
Graph -4: Storey displacements (Along X and Y direction) of T shaped models.
4.1.1 Discussions
By going through the graphs shown above, it can be clearly stated that the displacements are more in case of type-1 models and are comparatively less in type-2 models.Slenderness and large area of exposure to wind load are the two prime reasons, which have made type-1 models to undergo more displacements. Area of exposure is less in case of type 2 models hence displacements underwent by type-2 models are also less comparatively.Since displacements are minimum in type-2 models which are having lateral length ratio of the plan dimensions equal to unity (L1/L2 = 1) can be considered for the further analysis.
4.2 Comparison of Results for Different Types of
Load Application
Behaviour of all the building models are checked for different types of load applications to know under which type of load application the models undergo more displacements.Methods of application of loads are
© 2017, IRJET | Impact Factor value: 5.181 | ISO 9001:2008 Certified Journal
| Page 218
Applied in the form of Pressure loads
In each building model certain critical nodes are chosen and the displacements of those chosen nodes are compared for all the load application types.
Graph -5: Different Point displacements of C shaped models.
Graph -6: Different Point displacements of H shaped models.
Graph -7: Different Point displacements of L shaped models.
Graph -8: Different Point displacements of T shaped models.
4.2.1 Discussions
The displacement values corresponding to diaphragm load type application are comparatively less.The displacement values corresponding to equivalent joint loads as well as pressure loads are almost same.The difference in displacement values produced by diaphragm loads and pressure loads are found to be around 1-2 mm.Since the pressure loads will have more realistic way of application of wind loads on the high rise buildings, building models with pressure load application type are considered for further studies.
4.3 Comparison of Results of Different Shaped
Models
From the graphs which are compared against type of load application, it was found that the wind loads applied in the form of pressure will experience the wind loads in a more realistic way to cause more displacement in building models compared to other methods of load application. Hence the building models with pressure load application type are considered for further studies.To assess the best shape among the models, the buildings are studied for storey displacements, inter-storey drifts and storey shears. These storey displacements, inter storey drifts and storey shears of different model shapes are tabulated against the wind forces acting in four different directions.
Four along wind directions considered for study are • Along Positive X direction i.e. 0 degree
• Along Positive Y direction i.e. 90 degree • Along Negative X direction i.e. 180 degree • Along Negative Y direction i.e. 270 degree
Load combinations are considered as per IS 456: 2000 and are
• DCON3 i.e. 1.2 (D.L+ L.L+ SIDL+ DWIND 0) • DCON5 i.e. 1.2 (D.L+L.L+SIDL+ DWIND 90) • DCON7 i.e. 1.2 (D.L+L.L+SIDL+ DWIND 180) • DCON9 i.e. 1.2 (D.L+L.L+SIDL+ DWIND 270)
4.3.1 Storey Displacements
© 2017, IRJET | Impact Factor value: 5.181 | ISO 9001:2008 Certified Journal
| Page 219
Graph -10: Storey displacements for different shapedmodels for load case DCON5.
Graph -11: Storey displacements for different shaped models for load case DCON7.
Graph -12: Storey displacements for different shaped models for load case DCON9.
4.3.1.1Discussions
For DCON3 i.e. for factored Wind load which is incident at zero degree angle
• Among C, H, L and T models, L shaped model has undergone maximum Storey displacement whereas T shaped model is having minimum Storey displacement. • H shape and C shaped models have intermediate Storey
displacement values of L and T shapes.
• Graph-9 tells us that for the wind incident angle zero degree the performance of T shape model is better. For DCON 5 i.e. for factored Wind load which is incident at 90 degree angle
•Among C, H, L and T models, C shaped model has undergone maximum Storey displacement whereas H shaped model is having minimum Storey displacement. •L shape and T shaped models have intermediate Storey
displacement values of C and H shapes.
•Graph-10 tells us that for the wind incident angle 90 degree the performance of H shape model is better. For DCON 7 i.e. for factored Wind load which is incident at 180 degree angle
• Among C, H, L and T models, L shaped model has undergone maximum Storey displacement whereas T shaped model is having minimum Storey displacement. • C shape and H shaped models have intermediate Storey
displacement values between L and T shapes.
• Graph-11 tells us that for the wind incident angle 180 degree the performance of T shape model is better For DCON 9 i.e. for factored Wind load which is incident at 270 degree angle
• Among C, H, L and T models, C shaped model has undergone maximum Storey displacement whereas H shaped model is having minimum Storey displacement. • L shape and T shaped models have intermediate Storey
displacement values of C and H shapes.
• Graph-12 tells us that for the wind incident angle 270 degree the performance of H shape model is better.
Irrespective of the wind incident angle, maximum storey displacement that was found in each model in this study are listed below.
• 6.0562 mm for C shaped model • 4.6135 mm for H shaped model • 5.7649 mm for L shaped model • 5.5626 mm for T shaped model
© 2017, IRJET | Impact Factor value: 5.181 | ISO 9001:2008 Certified Journal
| Page 220
4.3.2 Storey Drift ratioGraph -13: Max storey drift ratios for different shaped models for load case DCON3.
Graph -14: Max storey drift ratios for different shaped models for load case DCON5.
Graph -15: Max storey drift ratios for different shaped models for load case DCON7.
Graph -16: Max storey drift ratios for different shaped models for load case DCON9.
4.3.2.1Discussions
For DCON3 i.e. for factored Wind load which is incident at zero degree angle
• Among C, H, L and T models, L shaped model has got maximum Storey drift ratios whereas T shaped model is having minimum Storey drift ratios.
• H shape and C shaped models have intermediate Storey drift ratio values between L and T shapes.
• Graph-13 tells us that for the wind incident angle zero degree the performance of T shape model is better. For DCON 5 i.e. for factored Wind load which is incident at 90 degree angle
• Among C, H, L and T models, T shaped model has got maximum Storey drift ratios whereas H shaped model is having minimum Storey drift ratios.
• L shape and C shaped models have intermediate Storey drift ratio values between T and H shapes.
• Graph-14 tells us that for the wind incident angle 90 degree the performance of H shape model is better. For DCON 7 i.e. for factored Wind load which is incident at 180 degree angle
• Among C, H, L and T models, L shaped model has got maximum Storey drift ratios whereas T shaped model is having minimum Storey drift ratios.
• C shape and H shaped models have intermediate Storey drift ratio values between L and T shapes.
• Graph-15 tells us that for the wind incident angle 180 degree the performance of T shape model is better For DCON 9 i.e. for factored Wind load which is incident at 270 degree angle
© 2017, IRJET | Impact Factor value: 5.181 | ISO 9001:2008 Certified Journal
| Page 221
• C shape and T shaped models have intermediate Storeydrift ratio values between L and H shapes.
• Graph-16 tells us that for the wind incident angle 270 degree the performance of H shape model is better.
Irrespective of the wind incident angle, maximum Storey drift ratio that were found in each model is listed below. • 0.000120 for C shaped model
• 0.000074 for H shaped model • 0.000147 for L shaped model • 0.000142 for T shaped model
Out of all the above listed values of maximum Storey drift ratios, maximum Storey drift ratio is minimum for H shaped model and maximum for L shaped model.
4.3.3 Storey Shears
Graph -17: Storey shears for different shaped models
4.3.3.1Discussions
• The storey shear is maximum for L shape and T shaped models and minimum for C and H shaped models. • Thus for the same plan area the C and H shaped models
has lesser storey shears compared to L and T shapes.
5. CONCLUSIONS
The following conclusions are drawn based on the results of the analysis.
• Since lateral dimensions ratio is more than unity for Type-1 models, the area of exposure that is prone to wind loads is more in Type-1 models. Hence Type-1 building models exhibit more displacements compared to Type-2 building models. Therefore we can conclude that Type-2 building models have better performances in comparison with the Type-1 building models.
• Building models with wind loads applied in the form of pressures have exhibited more displacements compared to those building models with wind loads applied in the form of diaphragm loads and joint loads.
• C-shape, L-shape, T-shape building models have more displacement in comparison with H-shape models. • H-shape model has less values of storey displacement,
storey drift and storey shear compared to C-shape, L-shape and T-L-shape building models. This implies that H shape models have better behaviour against wind loads. • Even though, T-shaped building model has less values of displacements and storey drifts for comparison of results under consideration of wind flow in certain individual direction. As a whole H shape model has least value for both maximum storey displacement and maximum storey drift for wind loads.
6. SCOPE FOR FUTURE WORK1
• Work can be extended to study on across wind responses of irregular buildings.
• As a part of extension of this work the effect of internal wind pressures can also be studied by considering openings in external walls.
• For more accuracy as a part of extension of the work Computational Fluid Dynamics method can be used to compute wind loads.
REFERENCES
[1] B.Dean Kumar, B.L.P.Swami,“Wind Effects on tall
Building Frames- Influence of Dynamic Parameters”, International Journal of Science and technology, Volume 3, No 5, May 2010.
[2] Ranjitha K. P, Khalid Nayaz Khan, Dr. N. S. Kumar, Syed
Ahamed Raza.,(2014) “Effect of Wind Pressure on R.C Tall Buildings using Gust Factor Method” Internatinal Journal of Engineering and Technical Research, Volume 3, Issue 07, July 2014.
[3] Prof. M R Wakchaure, Anantwad Shirish, Rohit Nikam.
“Study on Plan Irregularity on High Rise Structures”, Internatinal Journal of Innovative Research and Development, Volume 1, Issue 08, October 2012.
[4] K Rama Raju, M.I. Shreef, Nagesh R. Iyer, S
Gopalakrishnan, “Analysis and Design of Tall Building Subjected to Wind and Earthquake Loads”, The Eighth India Pacific Conference on Wind Engineering, December 10-14, 2013.
[5] J.A.Amin, A.K.Ahuja, “Characteristics of Wind Forces and
Responses of Rectangular Tall Buildings”, International Journal of Advanced Structural Engineering”, July 19th 2014.
[6] Himanshu Gaur, R K Goliya, Krishna Murari, Dr. Mullick.
© 2017, IRJET | Impact Factor value: 5.181 | ISO 9001:2008 Certified Journal
| Page 222
Research in Engineering and Technology, Volume 3,Issue 04, April 2014.
[7] Koushal Patil, Ajitkumar Jadhav, Nikhil Shingate, “Mivan
Technology”, Internatinal Journal of Engineering and Technical Research, Volume 3, Issue 06, June 2015.
[8] P Venkata Sarat, Ch Surendra Reddy, “Detailed Analysis
and Design of Slab- Wall System and Column- Beam System in Concrete Building”, International Journal of Research Sciences and Advanced Engineering, Volume 2, Issue 08, October- December 2014.
[9] Kintali Nanda Kishore, K Satya Narasimha Rao, Dr. Shaik
Yajdhani. “Comparative Study of Wind Analysis with Horizontal Irregularities in Multi-storied Buildings using STAAD.Pro”, International Journal of Science Technology and Engineering, Volume 2, Issue 01, July 2015.
[10] Mr. N B Baraskar, Prof.U.R.Kawade, “Structural
Performance of RC Structural Wall System over conventional Beam Column System in G+15 Storey Building”, International Journal of Engineering Research and General Science, Volume 3, Issue 04, July- August 2015.
[11] IS: 875 – 1987- Code of Practice for Design Loads (other