© 2017, IRJET | Impact Factor value: 5.181 | ISO 9001:2008 Certified Journal | Page 517
Image Denoising of Various Images using Wavelet Transform and
Thresholding Techniques
Yamini P. Chaudhari
1, Dr. P. M. Mahajan
21
ME Student, Dept. of Electronics and Telecommunication, J. T. Mahajan College of Engineering, Faizpur.
2Associate Professor, Dept. of Electronics and Telecommunication, J. T. Mahajan College of Engineering, Faizpur.
---***---Abstract -
Generally the Gaussian and salt Peppernoise occurred in images of different quality due to random variation of pixel values. To denoise these images, it is necessary to apply various filtering techniques. So far there are lots of filtering methods proposed in literature which includes the haar, sym4, and db4 Wavelet Transform based soft and hard thresholding approach to denoise such type of noisy images. This work analy-ses exiting literature on haar, db4 and sym4 Wavelet Transform for image denoising with variable size images from self generated grayscale database generated from various image sources such as satellite images(NASA), Engineering Images and medical images. However this new proposed Denoising method shows signs of satisfactory performances with respect to previous literature on standard indices like Signal-to-Noise Ratio (SNR), Peak Signal to Noise Ratio (PSNR) and Mean Square Error (MSE). Literature indicates that Wavelet transform represents natural image better than any other transformations. Therefore, Wavelet coeficient can be used to improve quality of true image and from noise. The aim of this work to eliminate the Gaussian and salt Pepper noise in wavelet transform domain. Subsequently a soft and hard threshold based denoising algorithm has been developed. Finally, the denoised image was compared with original image using some quantifying statistical indices such as MSE, SNR and PSNR for different noise variance which the experimental results demonstrate its effectiveness over previous method.
Key Words: Image Denoising, Gaussian noise, salt
Pep-per noise, Wavelet transforms, Image Thresholding techniques, Signal-to-Noise Ratio (SNR), Peak Signal to Noise Ratio (PSNR), Mean Square Error (MSE).
1. INTRODUCTION
The image usually has noise which is not easily eliminated in image processing. According to actual image characteristic, noise statistical property and frequency spectrum distribution rule, people have developed many methods of eliminating noises, which
© 2017, IRJET | Impact Factor value: 5.181 | ISO 9001:2008 Certified Journal | Page 518 which algorithm should be used to find the most reliable
estimate of the original image data given its degraded version.
2. REVIEW OF SELECTED LITERATURE ON WAVELET TRANSFORM BASED IMAGE DENOISING
F. Xiaoa et al. [6] presented a technique Wavelet-based image denoising which is the foundation of wavelet-based de-noising through thresholding. To explores properties of various thresholding techniques in wavelets denoising several natural gray scale test images like Lina, Barbara of size 512 X 512 at different noise levels are 10, 20, 30, 35 with soft thresholding and semi-soft thresholding with discrete Mayer filter having 4th level decomposition are used to evaluate these threshold selection algorithms are used to explore various Properties of image denoising algorithm and quantitative comparison between these techniques through MSE and PSNR (Peak Signal-to-Noise Ratio). Based on their results authors conclude that BayesShrink and Feature-Adaptive Shrink are the best wavelet-based denoising methods in methods.
Z. Weipeng et al. [7] Presented method with combining two-dimensional discrete wavelet transform and bilateral denoising is introduced for this purpose two images of coal-mine refuge chamber in different scenes are selected as original images with sizes of 352 X 288 pixels. First the wavelet transform is adopted to break down the image of safety enclosure and low frequency component of subject image remains unchanged. Then, 3 high-frequency elements are activated by bilateral filtering, and the image is reconstructed. While supplying better optical effect and ultimately terminate that integrating wavelet transform and bilateral filtering collectively, can in effect destruct image noises of refuge chamber, and result comparison given in this paper depending on Comparison of information entropy, standard deviation and mean gradient after applying bilateral filtering based on wavelet transform. When coal mine disaster happen proposed method will guide the emergency deliverance and assurance the coal-mine safety production.
C. chen et al. [8] proposed method which uses the digital complex ridgelet transform to denoise some standard images such as lina, MRI image and Thumb Impression image having Gaussian white noise. Hard thresholding of the complex ridgelet coefficients is used. their experiment Results show that this new method performs VisuShrink, the ordinary ridgelet image denoising, and wiener2 filter both in terms of peak signal-to-noise ratio and in visual quality. In particular, this method preserves sharp edges better while
removing white noise. Complex ridgelets could be applied to curvelet image denoising as well.
A. Jaiswal et al. [9]proposed a method worked with de-noising of user generated image, saltpepper and Gaussian noise. Remaining work is organized in four steps first image is denoised by filtering method, second images is denoised by wavelet based techniques using thresholding, third hard thresholding and filtering method applied simultaneously on noisy image, at last results of PSNR (peak signal to noise ratio) and MSE (mean square error) are calculated by comparing all cases. Experiments are performed on the 512 X 512 noisy images with noise having noise variance 0.04, output of median filter, Wiener filter, hard thresholding and hard thresholding plus median filtering implemented on the basis of PSNR, MSE and visual quality of image. The filtering and wavelet thresholding technique jointly gives good agreement of PSNR and MSE than applying Bior, Hard thresholding plus Wiener filter method.
G. Gao [10] proposed a method controls both the structural and statistical belongings of microarray of stranded images lina, barbras and Gaussian noise added which acting for wavelet based microarray picture denoising and for shrinking of microarray images. The shrinking scheme is unusual in its use of approximate (rather than perfect) textual matter. Proposed method brings forth smaller overall bits per pixel when compared with Micro Zip the best-known microarray compression algorithm. Given the assets of data typically bring forth by microarray based on experimentation. Further granted the important amount of noise that is ordinary in such experiments, method acting for removing (or at least reducing) the noise, in front further analysis using the microarray images.
© 2017, IRJET | Impact Factor value: 5.181 | ISO 9001:2008 Certified Journal | Page 519 without local parameters and (4) methods that consider
both heavy-tailed and locality properties. The technique is best among the best reported in the literature both visually and peak signal-to-noise ratio (PSNR). Because 3-D complex wavelet transform provides a motion-based multiscale decomposition for video, proposed algorithm has very good performance without explicitly using motion estimation.
V. Bruni et al. [12] Presents scheme for simultaneous compression and denoising of images using WISDOW-Comp (Wavelet based Image and Signal Denoising via Overlapping Waves Compression). However, atoms can be also used for achieving compression. In selected images such as lina, ship etc the core of WISDOW-Comp consists of recovering wavelet details by exploiting wavelet low frequency information. Therefore, just the approximation band and significance map of atoms absolute maxima have to be encoded and sent to the decoder for recovering a cleaner as well as compressed version of the image such as lina. Results show that WISDOW-Comp outperforms the state of the art of compression based denoisers in terms of both rate and distortion.
3. PROPOSED ALGORITHM
An image is a rectangular grid of pixels. It has a definite height and a definite width counted in pixels. Each pixel is square and has a fixed size on a given display. However different computer monitors may use different sized pixels and different types such as gray scale, color image (.jpeg, .gif, .png, .tiff etc.). The noise will reduce the quality of the images(the different noised images are showed in Figure 3 such as Gaussian and salt pepper noise) To clear noise from image is called as image denoising one goal in image restoration or denoising is to remove the noise from the image in such a way that the original image is discernible of course, noise is in the eye of the be holder; One approach is to decide that features that exist on a very small scale in the image are noise, and that removing these while maintaining larger features might help clean things up. Different Wavelet Transforms such as Db4, Sym4 and Haar used in project work Daubechies constructed the first wavelet family of scale functions that are orthogonal and have ignite vanishing moments, i.e., compact support. This property insures that the number of non-zero coefficients in the associated filter is innate. This is very useful for local analysis. The Haar wavelet is the simplest wavelet transform. It is also the only symmetric wavelet in the Daubechies family and the only one that has an explicit
expression in discrete form. Haar wavelets are related to a mathematical operation called Haar transform such as one of the brightest stars in the world of wavelet research, invented what called compactly supported orthonormal wavelets are thus making discrete wavelet analysis practicable. The names of the Daubechies family wavelets are written dbN, where N is the order [10], and db the surname of the wavelet. Symlet Wavelet, also known as “least asymmetric” wavelet, defines a family of orthogonal wavelets. Symlet Wavelet[n] is defined for any positive integer n. The scaling function (Ψ) and wavelet function (Φ) have compact support length of 2n. The scaling function has n vanishing moments. Symlet Wavelet can be used with such functions as Discrete Wavelet Transform and Wavelet Phi, etc. In symN, N is the order. Some author’s use 2N instead of N. Thresholding is the simplest method of image denoising. In this from a gray scale image, thresholding can be used to create binary image. Thresholding is used to segment an image by setting all pixels whose intensity values are above a threshold to a foreground value and all the remaining pixels to a background value. Thresholding is mainly divided into two categories hard and soft thresholding.
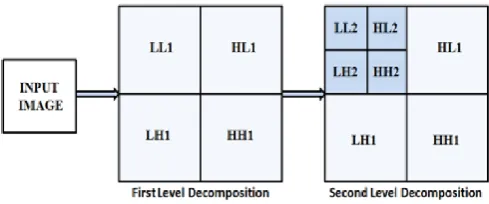
[image:3.595.316.561.565.667.2]Image processing is required to remove unwanted noise so that the quality of the processed image does not deteriorate. Generally, the noise is removed using some specified filters. Several methods have been reported to remove such noises form the stationary digital images. Discrete wavelet transform (DWT) is one of the recent wavelet trans- forms used in image processing. DWT decomposes an image into different sub images as shown in figure below.
Figure 1: First and Second level of Image decomposition.
© 2017, IRJET | Impact Factor value: 5.181 | ISO 9001:2008 Certified Journal | Page 520 This process is called the reconstruction of an image
using decomposition.
3.1 Image Denoising using Wavelet and
Thresholding is carried out in following steps.
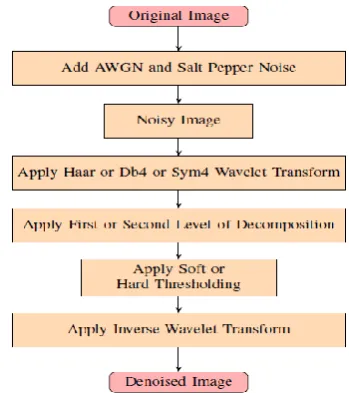
To denoise the image by using wavelet transform, the following steps are carried out as per algorithm shown in figure 2, For the experimentation variable size images from various image sources such as satellite images(NASA), Engineering Images and medical images are taken in to consideration.
Step 1: Select any one original image from MATLAB database for example original lina image from database is selected as shown in figure 3.
Step 2: Guassian noise at the variance of 0.01 or salt peeper noise at the variance of 0.1 is added in to original lina image from wavelet toolbox for example Gaussian noise of variance 0.01 and Salt pepper noise of variance 0.1 is added in to selected image from wavelet toolbox as shown in figure 4.
Step 3: These Noisy images are decomposed using different wavelet transforms such as db4, haar and sym4 for example haar Wavelet Transform is applied to these noisy images
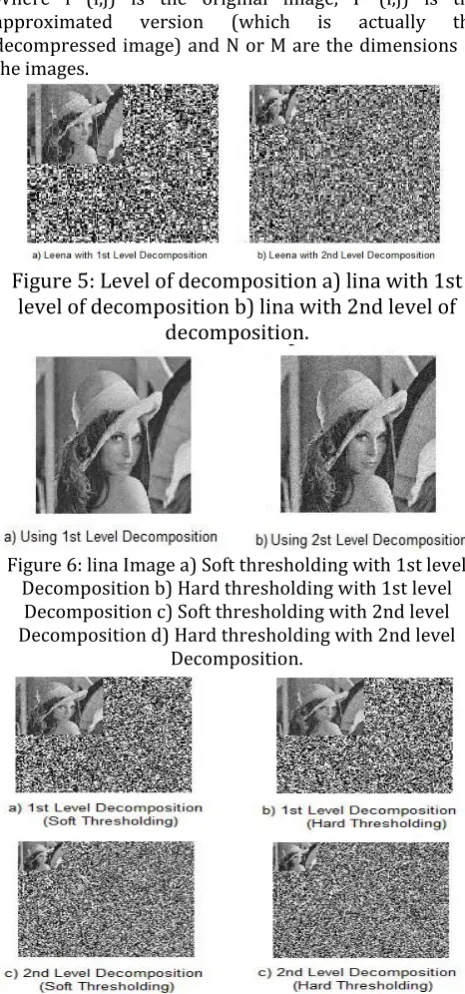
Step 4: First level or second level decomposition is applied to these noisy image. In the first level of decomposition, the image is split into 4 sub bands, namely the HH, HL, LH and LL sub bands. The HH sub band gives the diagonal details of the image; the HL and LH sub bands give the horizontal and vertical features respectively. The LL sub band is the low resolution residual consists of low frequency components and its sub bands are further split at higher levels of decomposition as shown in figure 1. In Wavelet Sub bands as the level increases the coefficients of sub band becomes smoother.HL2 is smoother than HL1 and so threshold value should be smaller than for HL1 for example first and second level of decomposition for lina image is shown in figure 6.
Step 5: We have performed Soft and Hard Thresholding at each decomposition level of an image for different wavelet transforms. At each level the value of threshold is different for example at the end the inverse of the wavelet transform has been performed to get the denoised image as shown in figure 7.
[image:4.595.345.520.103.300.2]Step 6: Finally the inverse of the wavelet transform has been performed to get the denoised image as shown in figure 7 and The performance of various wavelet transforms has been compared with the help of various parameters such as Peak signal to Noise Ratio (PSNR), Signal to Noise Ratio (SNR) and Mean Square Error (MSE), figure 8 shows complete denoised step wise result for lina.
Figure 2: Wavelet Denoising Algorithm form Haar, Db4 and Sym4.
Figure 3: Selected original lina Image from MATLB database.
Figure 4: Noisy lina Image a) lina with AWGN .01 varience and b) lina with Salt Peeper .1 variance.
4. EXPERIMENTAL RESULT AND DISCUSSION
Two parameters, PSNR (peak signal to noise ratio) and MSE (Mean square Error) are calculated for all the denoised images.
4.1 Mean Square Error (MSE):
© 2017, IRJET | Impact Factor value: 5.181 | ISO 9001:2008 Certified Journal | Page 521 quality of image. Having a Mean Square Error of zero (0)
is ideal. Lower the MSE produces good denoising result, The Mean Square Error (MSE) is defined and used to calculate error metrics used to compare the various image compression techniques are the Mean Square Error (MSE).
Where f (i,j) is the original image, F (i,j) is the approximated version (which is actually the decompressed image) and N or M are the dimensions of the images.
Figure 5: Level of decomposition a) lina with 1st
level of decomposition b) lina with 2nd level of
[image:5.595.318.549.104.280.2]decomposition.
Figure 6: lina Image a) Soft thresholding with 1st level Decomposition b) Hard thresholding with 1st level
Decomposition c) Soft thresholding with 2nd level Decomposition d) Hard thresholding with 2nd level
Decomposition.
Figure 7: Denoised lina Images a and b) with 1st level Decomposition c and d) with 2nd level decomposition.
Figure 8: Result of AWGN noisy lina using haar second level Decomposition with Soft thresholding.
4.2 Peak Signal to Noise Ratio (PSNR):
The Peak Signal-to-Noise Ratio (PSNR) is
defined as a ratio between the maximum possible
power of a signal and the noise power that affects
the fidelity of its representation. PSNR is usually
expressed in terms of the logarithmic decibel scale.
The PSNR is most commonly used as a measure of
quality of reconstruction of lossy compression for
image compression. It is most easily defined via the
Mean Square Error (MSE) which for two mxn
monochrome images i and k where one of the
images is considered a noisy approximation. Two of
the error metrics used to compare the various
image compression techniques are the Mean Square
Error (MSE) and the Peak Signal to Noise Ratio
(PSNR). The MSE is the cumulative squared error
between the compressed and the original image,
whereas PSNR is a measure of the peak error. The
mathematical formulae for the two are:
The PSNR is defined as:
[image:5.595.44.277.221.719.2]© 2017, IRJET | Impact Factor value: 5.181 | ISO 9001:2008 Certified Journal | Page 522 for Selected images such as lina, Barbara, cameraman,
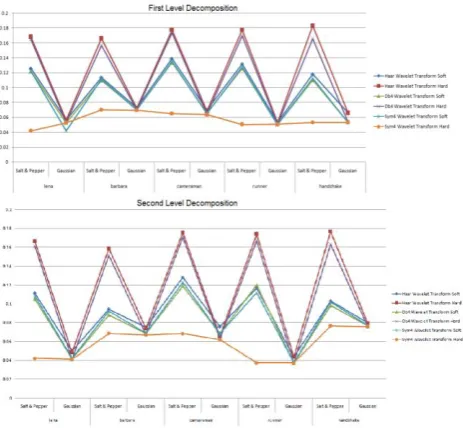
[image:6.595.314.558.161.390.2]Runner and Handshake, Grayscale Images with variable sizes are used for experimentation. Using proposed algorithm it is clear that PSNR values are not same for haar, db4 and sym4 wavelet transform. Out of these three sym4 shows high PSNR and Lowest MSE vales.
Figure 9: MSE Values of selected 5 Images with Hard and Soft Thresholding and First and Second Level of
Decomposition.
5. CONCLUSION
In this paper several well known algorithms for
denoising natural images were investigated and
their performance was comparatively assessed. A
new algorithm based on the haar, db4 and sym4
wavelet transform was developed. Its performance
was shown to be competitive with or exceeding the
performance of other algorithms. In addition, it has
been shown to the advantage of implementation
simplicity. There are different types of noises that
may corrupt a natural image in real life, such as
Gaussian noise and salt pepper noise etc. However,
both salt pepper and white Gaussian noise was
considered because of its simplicity. A major part of
the thesis was devoted to the review,
implementation and performance assessment of
published image denoising algorithms based on
various techniques including the haar, db4 and
sym4 Wavelet transform. The Wavelet transform
and its characteristics were studied and as per
result and comparison, and previous literature say
lower MSE of images gives good denoising result
mean clear denoised image and higher PSNR values
produces good quality of decomposed image it is
conduced that out of three haar db4 and sym4
wavelet transform sym4 gives lowest MSE values
(0.0373) for the different images and highest PSNR
value (62.4179) as compared to haar and db4.
Figure 10: PSNR Values of selected 5 Images with Hard and Soft Thresholding and First and Second Level of
Decomposition.
REFERENCES
[1]
L. Boubchir, J. Fadili,“ Multivariate statistical
modeling of images with thecurvelet transform”,
In: Proc. 8th Inter. Symp. Signal Process. and its
Applications(ISSPA
2005),
vol.2,
Sydney,
Australia, 2005, pp. 747-750.
[2]
A. lecu, A. Munteanu, A. Pizurica, W. Philips, J.
Cornells, P. Schelkens,“Information-theoretic
analysis of dependencies between curvelet
coefficients”,in: Proc. ICIP, 2006, pp. 1-6171620.
[3]
J. Portilla, V. Strela, M.J. Wainwright, E.P.
Simoncelli,“ Image denoising usingscale mixtures
of gaussians in the wavelet domain”, IEEE Trans.
Image Process.12 (2003) 13381351.
[4]
Akhilesh Bijalwan, Aditya Goyal and Nidhi Sethi,
“Wavelet Transform Based Image Denoise Using
Threshold Approaches”, International Journal of
Engineering and Advanced Technology (IJEAT),
ISSN: 2249-8958, Vol.1, Issue 5, June 2012.
[5]
S.Arivazhagan,
S.Deivalakshmi,
K.Kannan,
[image:6.595.46.278.190.404.2]© 2017, IRJET | Impact Factor value: 5.181 | ISO 9001:2008 Certified Journal | Page 523