© 2017, IRJET | Impact Factor value: 5.181 | ISO 9001:2008 Certified Journal
| Page 3048
TEMPERATURE SENSOR FAULT DETECTION USING PRINCIPAL
COMPONENT ANALYSIS
Nadar Rahul Chairmalingam
1,
Vivek Joe Bharath
2, Thirumarimurugan
M
31
Student, M.Tech, Department of Chemical Engineering, Coimbatore Institute of Technology, Coimbatore, Tamil
Nadu, India
2
Assistant Professor, Department of Chemical Engineering, Coimbatore Institute of Technology, Coimbatore, Tamil
Nadu, India
3
Professor and Head of the department, Department of Chemical Engineering, Coimbatore Institute of Technology,
Coimbatore, Tamil Nadu, India
---***---Abstract:
This paper proposes method for fault detection of a J-type thermocouple temperature sensor used for measuring room temperature by using principal component analysis (PCA). One of the most important parameter monitored continuously in all the industries is temperature. However any failure in controlling the temperature can cause physical, economical and social damage. The setup consists of the J-type thermocouple i.e. a temperature sensor whose readings is published on the computer using Lab VIEW. Fault detection is used to detect faults during the early stage in a system. In this method the fault is manually introduced in the experiment by introducing a resistor. PCA is increasingly being used for reducing the dimensionality of multivariate data, process monitoring and for fault detection. In this paper Hotelling’s T2 and Q statistics are calculated to find the faultsoccurring in the system with extensive simulation results showing which the onset of fault.
Keywords: Fault detection, thermocouple, principal component analysis, temperature, sensor fault.
1. INTRODUCTION
Nowadays all the major industries like chemical, petrochemical and nuclear consists of various operational processes which involve different sensors, actuators and other components [1]. Fault in any system is an unwanted deviation of a parameter or characteristic property of a system from acceptable, usual or standard condition. There is major concern in most of the industries due to the influence of faults in the various operating systems [2]. If not attended faults may lead to higher energy consumption and unacceptable social, economical and physical losses. Fatal injuries to people can also be one of the consequences of the failures occurring in the system [3]. There are various types of faults occurring in industries like sensor, actuator and system fault, and it is imperative that a fault control system must be able to perform fault detection, isolation and diagnosis [4].
Sensors plays significant role in productivity both quantitatively and qualitatively in most of the industrial operations. Failure in sensor may cause system shutdown, degradation of process equipments or lead to fatal injuries [5].
Fault detection methods are classified in to two groups: process history based methods and model based methods. Model based techniques involve process models, diagnostic observers, state observers, neural networks method, fuzzy method and kalman filters. Process based methods requires large amount of data obtained from statistical method. Majorly used statistical technique is principal component analysis [6].
2. PRINCIPLE COMPONENT ANALYSIS
For large-scale processes, such as chemical plants, the development of model-based fault-detection methods requires a considerable and eventually a too high effort. Then data driven analysis methods offer an alternative way, mostly methods based on multivariate statistical analysis and here especially principal component analysis [7]. Principal component analysis (PCA) has found major application in monitoring complex systems. There are many techniques for extracting process information from large data sets and interpreting this information have been developed in various fields [8]. Major objective of PCA is to reduce the dimensionality of the original dataset by projecting it onto a lower dimensional space. This technique was first proposed in 1933 by Hotelling to solve the problem of decorrelating the statistical dependency between variables in multivariate statistical data derived from exam scores
© 2017, IRJET | Impact Factor value: 5.181 | ISO 9001:2008 Certified Journal
| Page 3049
usually linear and static and are developed from a processin normal operation.
To achieve data analysis PCA is implemented because of its dimensionality reduction and data compression feature. PCA forms a new smaller set of variables with minimal loss of information, compared with original data size. Based on this unique feature, PCA is extended to be used for classification of variables and hence early identification of abnormalities in the data structure, i.e. detection of faults [9].
3. STRUCTURE OF PRINCIPAL COMPONENT ANALYSIS FOR FAULT DETECTION
Let X is the data matrix formed of m observation and n variables recorded from a real process. This data set represents normal operating conditions.
X= [Data matrix] (m x n)
The data matrix is scaled to new matrix with zero mean and unit variance to avoid serial and cross correlation between the variables.
̅ ( ̅ ) ̅ .
Here D is the diagonal matrix containing the standard deviation of each variable, 1 is a vector of elements equal to 1 and ̅ is a vector containing the mean of each variable. With the scaled data matrix, a set of a smaller number (r<n) of variables is searched through decomposing the data variance, r must preserve most of the information given in these variances and co variances. The dimensionality reduction is obtained by a set of orthogonal vectors, called loading vectors (p), which are obtained by solving an optimization problem involving maximization of the explained variance in the data matrix by each direction (j), with tj = ̅pj , the maximal variance
of data tj must be computed by:
( ) ( ̅ ̅ ).
Solution of this optimization is obtained by singular value decomposition of the correlation matrix of the data matrix A. Once the scaled matrix is decomposed to small matrix to explain the maximum variance in data, scree plot is used to find the significant principal components (PC) i.e. the largest eigen values of the matrix A. The scree plot is a good choice for showing the quantity of explained variance based on the number of retained PC. The number of retained PC will be determined, when the addition of another one PC does not improve the quality of data representation significantly. By the new orthogonal system the scaled data matrix is transformed to a new and smaller data matrix T called Score matrix
The next step is the fault detection step by using Hotelling’s T2 and Q statistics.
∑( ̅ )
Here S is the sigma matrix which is obtained in the singular value decomposition of the scaled data matrix and X* is the back transformed matrix and it is obtained
from the following equation
If both the Hotelling T2 and Q statistics value stays within
the control limit, then the status of the process is considered to be normal [10]. The PCA algorithm is shown in chart 1.The control limits are computed using the data obtained from normal operating conditions. A fault is correctly detected when both T2 and Q statistics
are greater than their threshold values. Hotelling T2
statistics measures the variation within the PCA model while Q statistics measures the variation outside the PCA model.
Chart - 1: Structure of PCA Construction of data matrix
Normalization or Scaling of data matrix
Computation of correlation matrix
Computation of eigen values and eigen vectors of correlation matrix
Selection of largest eigen value and corresponding eigen vector
Determination of
transformation matrix P for principal components
Transformation of scaled matrix to score matrix
Calculation of Hotelling T2
and Q statistics for fault detection
© 2017, IRJET | Impact Factor value: 5.181 | ISO 9001:2008 Certified Journal
| Page 3050
4. EXPERIMENTATION:
A J-type thermocouple acting as the temperature sensor is the important apparatus in this experiment. Room temperature is measured using the thermocouple. The other equipments used are a bread board and an NI- DAQ (Data Acquisition) toolbox. Data acquisition involves gathering signals from measurement sources and digitizing the signals for storage, analysis, and presentation on a PC. In order to take normal readings of the surroundings, the temperature sensor was connected to DAQ linked to a computer via USB data cable as shown in figure 1.
Figure –1: Experimental setup of J- type thermocouple connected to DAQ to obtain normal temperature readings
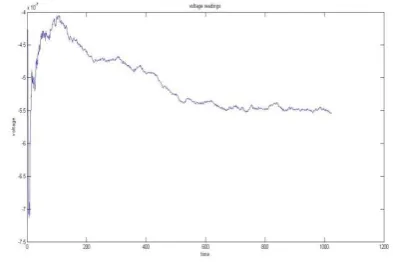
The room temperature readings get stored in the system. Here the input temperature and the output voltage of the thermocouple are collected and tabulated. The data are collected with time interval of 1 second. Over 1000 readings are obtained and are shown graphically in graph 1 and 2.
Graph -1: Temperature readings obtained during normal condition without any fault.
Graph -2: Voltage readings obtained during normal condition without any fault.
In order to collect faulty readings, the output of thermocouple wire is connected to a resistor of 3 KΩ through a breadboard to maintain constant contact with the resistance as shown in figure 2.
Figure -2: Experimental setup of J- type thermocouple connected to DAQ through a resistor to obtain faulty temperature readings.
[image:3.595.330.527.145.276.2] [image:3.595.38.282.269.447.2]© 2017, IRJET | Impact Factor value: 5.181 | ISO 9001:2008 Certified Journal
| Page 3051
Graph -3: Temperature and voltage readings obtained after introduction of resistor causing fault.
5. FAULT DETECTION RESULTS AND DISCUSSIONS
Here MATLAB commands are used for the implementation of principal component analysis algorithm. The data matrix is formulated from the 1025 observations of the sensor with temperature and voltage readings. The data vector is given by
X (t) = [T V] (1025 X 2)
Graph – 4: SCREE Plot
Principal components are calculated and the SCREE plot is shown in graph 1. After the first 1000 observations an abrupt fault is introduced by adding resistor. To detect fault Hotelling T2 and Q statistics are calculated. The
control limits i.e. thresholds are computed from the characterization of normal operating point. A fault is correctly detected when both T2 and Q statistics
overshoot their thresholds. Figure 2 shows the results for Hotelling T2 and Q statistics, proving that the fault has
occurred.
Graph -5: T2 and Q statistics showing error signals for
faulty readings of the thermocouple
6. CONCLUSION
Principal component analysis implemented on the experimental data obtained from J-type thermocouple is presented in this paper. Here abrupt fault was successfully introduced in the temperature sensor. PCA algorithm was applied for sensor fault detection with normal and faulty data provided from J type thermocouple. In the above process fault was easily identified using PCA algorithm. Thus PCA would also be easier to implement in industrial applications because it performs very well on fast detection of abnormal conditions. When it is difficult to obtain a proper process model due to the complexity of a system PCA can be utilized for fault detection. Thus we can say that PCA is effective in detecting fault of offline signals instantaneously.
REFERENCES
[1] R. Isermann, D. Füssel and H. Straky, “Industrial applications of fault detection control systems, robotics, and automation” – vol. XVI.
[2] W. Y. Lee, J. M. House, D. R. Shin, “Fault Diagnosis and Temperature Sensor Recovery for an Air-Handling Unit”, ASHRAE Transactions, vol. 103, No. 1, 1997. [3] V. Venkatasubramanian, R. Rengaswamy, K. Yin and S.
N. Kavuri, “A review of process fault detection and diagnosis Part I: Quantitative model-based methods”, Computers and Chemical Engineering, vol. 27 (2003) pp. 293 – 311.
© 2017, IRJET | Impact Factor value: 5.181 | ISO 9001:2008 Certified Journal
| Page 3052
[5] Nasir Mehranbod , Masoud Soroush , ChaninPanjapornpon, “A method of sensor fault detection and identification”, Journal of Process Control, vol 15 (2005) pp. 321–339.
[6] Rolf Iserman, “Fault diagnosis systems”, Springer, 2006.
[7] S. Wang and F. Xiao, “AHU sensor fault diagnosis using principal component analysis method”, Energy and buildings, vol. 36, 2004, pp. 147-160.
[8] M Ahmed, M Baqar, F Gu , “Fault detection and diagnosis using Principal Component Analysis of vibration data from a reciprocating compressor”, CONTROL, 2012 UKACC International Conference, IEEE.
[9] T Villegas, M. J. Fuente and M. Rodríguez, “Principal Component Analysis for Fault detection and diagnosis”, Experience with a pilot plant”, Proceedings of the 9th WSEAS international conference on computational intelligence, man-machine systems and cybernetics, Dec. 2010, pp. 147-152.
[10] J. C. T. Martinez, R. M. Menendez, , L. E. G. Castanon, A. V. Martinez, “Fault detection in a heat exchanger, comparative analysis between dynamic principal component analysis and diagnostic observers”, Comp. y Sis, 2011, vol. 14, no.3, pp.269-282.