Combination of TOPSIS and AHP in load shedding scheme for large pulp
mill electrical system
H.H. Goh
a,⇑, B.C. Kok
a, H.T. Yeo
a, S.W. Lee
a, A.A. Mohd. Zin
b aDepartment of Electrical Power Engineering, Faculty of Electrical and Electronic Engineering, Universiti Tun Hussein Onn Malaysia, 86400 Parit Raja, Batu Pahat, Johor, Malaysia b
Department of Electrical Power Engineering, Faculty of Electrical Engineering, Universiti Teknologi Malaysia, 81310 Skudai, Johor, Malaysia
a r t i c l e
i n f o
Article history: Received 22 June 2010
Received in revised form 25 October 2012 Accepted 27 October 2012
Available online 7 December 2012
Keywords:
Combination of TOPSIS and Analytical Hierarchy Process (AHP)
Load ranking Pulp mill
a b s t r a c t
In the era of technology, a variety of powerful equipments are design to satisfy the demand of industry sector. However, these equipments need a stable and reliable electrical supply in order for the whole sys-tem to flow smoothly. The overview of this paper is mainly about the load shedding application toward a large pulp mill electrical system using the multi-decision making methods which are the Analytical Hier-archy Process (AHP) and the Technique for Order Preference by Similarity to Ideal Solution (TOPSIS) methods. Whenever there are shortages of electrical supply, the load shedding method shall be applied in order to recover and stabilize the system. Load shedding is a module that shed the higher possible load in the system to overcome the voltage shortage in the system. The objective of this paper is to extract the possible unnecessary load and determine the ranking of the load according to their importance level. The proposed methods are to test on the plant load shedding table from a paper pulp mill industry with 25 load points for practical applications.
Ó2012 Elsevier Ltd. All rights reserved.
1. Introduction
Pulp mill is considered as one of the heavy industries which consist of hundreds of hectares of land that used for massive and sophisticated equipments and system[1]. To overcome and control this massive system, mill wide control system shall be integrated with mill wide electrical system, so that all plants and relevant sys-tem can be operated in good and proper manner. In this industry, protections are needed to ensure all the equipments were away from danger and safe to be used. For example, the Smart Motor Control Centre (MCC), microprocessor protection relay for switch-gear of incoming feeder, harmonic filter feeder with profibus pro-tocol, outgoing feeder and transformer feeder were operated in this industry to help in reducing the down time, maintenance cost, and data collections for diagnostic and maintenance purposes.
Palaniswany et al.[2]developed a method for best load shed-ding in a power system. This is a simple and economical protection system. In this method, it considers the dependence of load on voltage and frequency, together with the effect of the generator controls and voltage regulators. The objective of the system is not delivering the load shedding, but the power balance is obtained through the load shedding method.
According to Perumal and Chan[3], load shedding priority is determined based on the criticality of loads, that is the least impor-tant loads are shed in the first stage and the very imporimpor-tant ones
are shed in the last stage. In another word, not all the loads were included in load shedding scheme, but only selected loads that full-filled the load shedding design will be chosen. For those units that are required to be operated in all time shall not be included into this scheme.
Load shedding technique is used to shut down certain pre-determined electric loads or devices whenever there is any failure of generator to catch up the system frequency. When a power sys-tem is vulnerable to the stability problem, corrective control ac-tions may be required[4]. The corrective controls can be done by restoring back the stable system when subjected to severe distur-bances. Besides that, the corrective load shedding can also be ap-plied if the subjected operation were units that cannot be shut down or the restoring of stable system could not effectively over-come the stability problem. As mentioned, the stability of a power system is important for an industry to keep their operation running.
It is normally used in industrial, large commercial and utility operations to make sure the system flow is always in good condi-tion. The emergency loads shedding control required in restoring the power flow solvability and searching the minimum load shed-ding direction accorshed-ding to the sensitivity vector[5]. This is one of the energy utilities’ methods to maintain the stability on the en-ergy generation system by temporary switching off the distribu-tion of energy to different geographical areas.
Arya et al.[6]had used the numerical method on finding the minimum eigenvalue of load flow to determine the load shedding in IEEE 6 bus and 14 bus test system. Due to this is based on the
0142-0615/$ - see front matterÓ2012 Elsevier Ltd. All rights reserved.
http://dx.doi.org/10.1016/j.ijepes.2012.10.059
⇑Corresponding author. Tel.: +60 167416824 E-mail address:[email protected](H.H. Goh).
Contents lists available atSciVerse ScienceDirect
Electrical Power and Energy Systems
statistical inference, there are many iterations required in order to obtain the results.
On the other hand, the under frequency is always being used by the researchers to study about the load shedding scheme. For in-stance, Hooshmand and Moazzami used neural network to train the system acting fast toward under frequency circumstances[7]. Meanwhile, Karimi et al. used load shedding controller to trigger the load shedding scheme for an islanded distribution network [8]. The paper clearly indicates the situation of the system fre-quency in few cases. In addition, the hybrid load shedding scheme by using frequency and power was successfully developed by Giro-letti et al.[9]. By using a dynamic algorithm, the numbers of loads to be shed was minimized. This is very important for the industrial application. If the loads to shed can be minimized, it means that the production of the industry can be maintained well even the system is unstable.
However, the efficiency of the system could bring to the messy job to the operators where thousands of data need to be analyzed daily to know and ensure the system flows smoothly and neverthe-less identifying which load needs to be shed to keep the system to operate continuously.
In this paper, TOPSIS method is applied to give rank according to the importance of the alternatives towards the criteria’s throughout the specific calculation. With this method, operators could base on the ranking provided and solve the tripping prob-lems without causing the whole system to shut down or collapse.
2. Pulp mill information
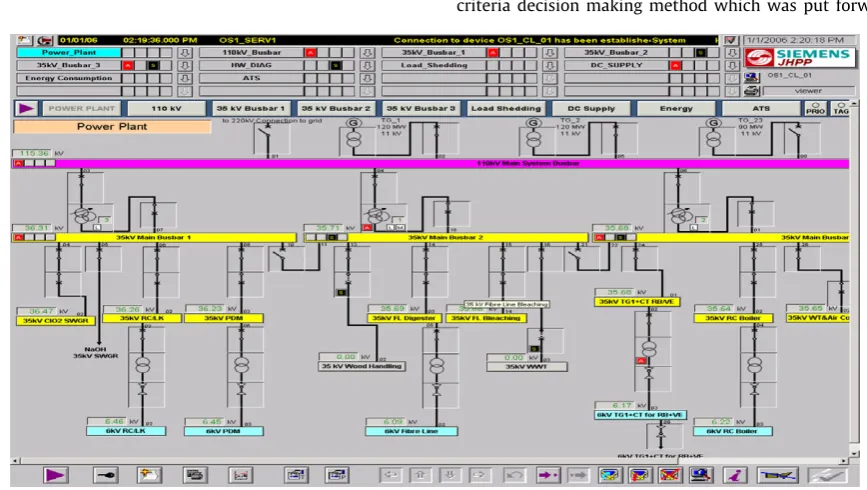
The analysis of the pulp mill electrical system is based onFig. 1. Fig. 1shows the SCADA of the pulp mill. Basically, the pulp mill electrical system can be divided into few parts such as:
(i) 3 Phase, 50 Hz voltage level
High voltage 110 kVac
Medium voltage 35 kVac and 6 kVac
Low voltage 690 Vac and 400 Vac
(ii) 3 nos of Turbine Generator
2120 MW + 90 MW = 330 MW and the connection to 220 kV grid system
The studies of proposed combination methods for the load shedding scheme will base on the information as shown inFig. 1. InFig. 1, connection in between the 220 kV grid and the pulp mill was disconnected. There are only two steam turbo generator are running in order to supply electricity to the pulp mill. In such cir-cumstance, the load shedding scheme of the system is activated to maintain the system stability. The one line diagram of the impor-tant parts in pulp mill system can be illustrated inFig. 2by using ETAP software.
As inFig. 1, the loads of the pulp mill can be divided into three main parts, which is main bus 1, 2 and 3 respectively. Each main bus consists of different types of loads. In main bus 1, CIO2, NaOH, RC, PDM are necessary for the paper production. Meanwhile, main bus 2 is needed for the final finishing of the products. Apart from that, main bus 3 plays the most important role in providing the steam to the steam turbo generator as well as the pulp boiler. In order to determine the load ranking of the whole system, the loads can be categorized into three. There are vital loads, semi-vital loads and non-vital loads. The categories of loads can be illustrated as in Fig. 2. Main bus 3 is the most vital loads in this system if compared with others. Main bus 1 and 2 rank as semi-vital and non-vital respectively.
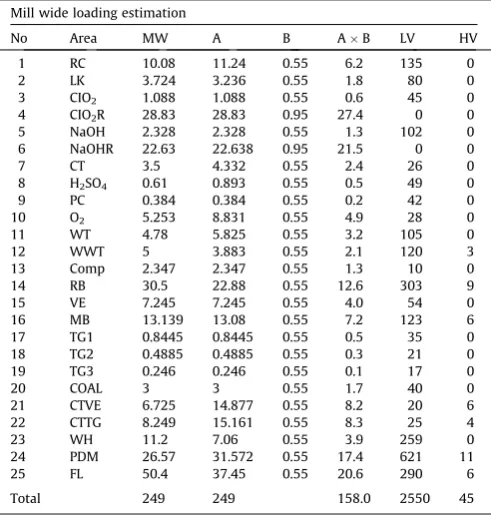
The pulp mill loading estimation can be tabulated as inTable 1. The analysis of the load ranking for the load shedding scheme will base on the loads as shown inFig. 2andTable 1only.
In the pulp mill, production is very important. The vital loads are the loads in main bus bar 3. The recovery boiler is very impor-tant in generating the steam for the generator as well as in the pro-duction. Hence, this is the most vital load in order to maintain the stability of the system. The power supply is absolute needed in any circumstance. If the load shedding scheme is triggered, the load first to be shed must be the least important load in the non-vital group. In this paper, the load ranking of the selected loads in three categories will be analyzed by using the combination of AHP and TOPSIS method. The categories of the priority for the pulp mill can be illustrated inFig. 3.
3. AHP method
[image:2.595.83.517.495.740.2]AHP, also known as the Analytical Hierarchy Process is multiple criteria decision making method which was put forward by Prof
T.L. Saaty of Pittsburgh University in 1970s[10]. The general idea in the AHP method is to make the pair wise comparisons, both of the alternatives with respect to the criteria (scoring), and criteria to estimate the criteria weights (weighting)[11].
AHP technique acts as a decision maker systematically evaluat-ing several data or elements by comparevaluat-ing one and another at the same time. It judges the elements relative meaning and impor-tance based on the numerical values process by this technique. The numerical value represented the weight or priority of each ele-ment of the hierarchy.
According to Cheng et al.[12], there were two basic applications where one is that assign weights to a set of predetermined ele-ments and make a decision out of several scenarios or alternatives, while the second one is to rank the elements to identify the key
elements. In the end of the calculation, the approximate weight vector of the elements can be determined.
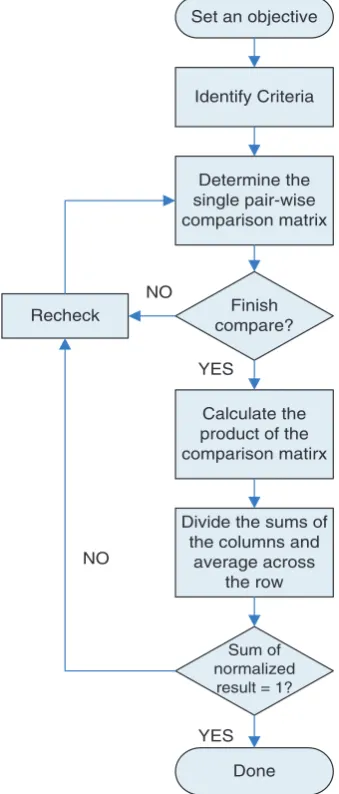
The AHP method can be expressed in series of steps as shown in Fig. 4.
4. TOPSIS method
TOPSIS is known as the ‘‘Technique for Order Preference by Sim-ilarity to Ideal Solution’’. This method is a unique technique to identify the ranking of all alternatives considered. In the TOPSIS method, the decision making matrix and weight vector are deter-mined as crisp values and a positive ideal solution (PIS) and a neg-ative ideal solution (NIS) are obtained from the decision matrix [13]. In another word, PIS is a set of best value of criteria while NIS is a set of worst values achievable of criteria. This method is applied to make wide-ranging evaluation of samples where it mea-sured the distances between index value vector of each sample and ideal solution along with the negative ideal solution of the compre-hensive evaluation[14].
The TOPSIS method can be expressed in series of steps as listed below.
(1) Identifying the alternatives over criteria involved to form a decision matrix.
(2) Constructing a set of normalized decision matrix using the following equation:
rij¼
xij
ffiffiffiffiffiffiffiffiffiffiffiffiffiffiffi
ðPx2
ijÞ
q ;fori¼1;. . .;m;
[image:3.595.134.448.65.262.2]j¼1;. . .;n ð1Þ
[image:3.595.312.542.299.403.2]Fig. 2.The one line diagram of the pulp mill electrical system using ETAP.
Table 1
The pulp mill loading estimation.
Mill wide loading estimation
No Area MW A B AB LV HV
1 RC 10.08 11.24 0.55 6.2 135 0
2 LK 3.724 3.236 0.55 1.8 80 0
3 CIO2 1.088 1.088 0.55 0.6 45 0
4 CIO2R 28.83 28.83 0.95 27.4 0 0
5 NaOH 2.328 2.328 0.55 1.3 102 0
6 NaOHR 22.63 22.638 0.95 21.5 0 0
7 CT 3.5 4.332 0.55 2.4 26 0
8 H2SO4 0.61 0.893 0.55 0.5 49 0
9 PC 0.384 0.384 0.55 0.2 42 0
10 O2 5.253 8.831 0.55 4.9 28 0
11 WT 4.78 5.825 0.55 3.2 105 0
12 WWT 5 3.883 0.55 2.1 120 3
13 Comp 2.347 2.347 0.55 1.3 10 0
14 RB 30.5 22.88 0.55 12.6 303 9
15 VE 7.245 7.245 0.55 4.0 54 0
16 MB 13.139 13.08 0.55 7.2 123 6
17 TG1 0.8445 0.8445 0.55 0.5 35 0 18 TG2 0.4885 0.4885 0.55 0.3 21 0
19 TG3 0.246 0.246 0.55 0.1 17 0
20 COAL 3 3 0.55 1.7 40 0
21 CTVE 6.725 14.877 0.55 8.2 20 6 22 CTTG 8.249 15.161 0.55 8.3 25 4
23 WH 11.2 7.06 0.55 3.9 259 0
24 PDM 26.57 31.572 0.55 17.4 621 11
25 FL 50.4 37.45 0.55 20.6 290 6
Total 249 249 158.0 2550 45
MW, Area power in Megawatt (MW); A, Siemens load list; B, Load factor; AB, Estimate operating load; LV, Low voltage motor; HV, High voltage motor.
Power Generation
(vital) Production
Finishing (non-vital)
Pre Production (semi-vital)
Steam Steam
[image:3.595.36.282.319.577.2](3) Constructing a set of weight normalized decision matrix with criteria weight,wjprovided.
(4) Identifying the ideal alternatives and negative ideal alternatives.
Ideal solution
PIS¼ f
v
1;. . .;
v
ng;where ð2ÞV
J ¼ fmaxð
v
ijÞifj2J;minðv
ijÞifj2J 0gNegative ideal solution
NIS¼ f
v
0 1;. . .;v
0
ng;where ð3Þ
V0
¼ fminð
v
ijÞifj2J;maxðv
ijÞifj2J0 g(5) Calculate the separation measurement of each alternative in sifor ideal solution andsnifor negative ideal solution. (6) Calculate the relative closeness to ideal solution using the
following equation:
RATIO¼ sni
sniþsi
ð4Þ
(7) Ranked the alternatives starting from the value that closest to 1.
Hwang and Yoon[15]are the first who introduce the TOPSIS method. Hwang and Yoon describe multiple decisions making as follow: multiple decisions making is applied to preferable decision (such as assessment making priority and choice) between available classified alternatives over the multiple attributes or criteria. It assumes that each criterion require to be maximized or minimized. Therefore, the ideal positive and negative values of each crite-rion are identified, and each alternative judge against this information.
It is noted that, in this typical multiple criterion decision mak-ing (MCDM) approaches, weights of attributes reflect the relative importance indecision making process. Each evaluation of criteria entails diverse opinions and meanings. Hence assumption that each evaluation criterion is equally importance is prohibited.[16]. TOPSIS method consists of two artificial alternatives hypothesis which are ‘Ideal Alternative’ and ‘Negative Ideal Alternative’. ‘Ideal Alternative’ represents the best level of all attributes considered while the ‘Negative Ideal Alternative’ represented the worst attri-butes value. With these two hypotheses, sets of calculations using eigenvector, square rooting and summations to obtain a relative closeness value of the criteria tested. These values of relative close-ness, TOPSIS ranked the whole system by selecting the highest va-lue of the relative closeness as the best attributes in the system.
5. Numerical example
FromTable 1, Power Supply (MW), the Estimated Optional Load (EOL), number of low voltage motors and number of high voltage motors are the four criteria involved in the system. Out of 25 areas listed inTable 1, 16 areas are selected, as shown inTable 2. These sixteen areas were determined based on their estimated optional load, the usage of that particular area, and the important of the area to the whole system. As discuss in Section 1, all loads that are chosen to be shed shall be those loads that have higher voltage load, and loads which were less important to the whole system that can be turn off when it is not in used. Besides that, theoreti-cally, after applying the TOPSIS method onto the load shedding scheme, the Area that shall be shed would be the Area that having higher load estimation during the operations.
Table 2shows the data obtained from a large pulp mill electrical system. It consists of Areas, power supply (MW), and the Estimate Optional Load (EOL) which attribute to the larger power consum-ing. The Area was the alternatives while the EOL, and MW taken as the attribute or criteria in TOPSIS method for calculations.
The percentage of loads in each category can be illustrated in Fig. 5.
Identify the data for alternatives over criteria to form a set of decision matrix. Note that, criteria that are needed to be minimized in the system shall be placed at the last position for easier calcula-tions in TOPSIS application. Since the objective of load shedding scheme is to maintain the system frequency when a system is vul-nerable to the stability, hence in arranging the criteria before form-ing the decision matrix, the power supply (MW) is placed as a last criterion. Before that, a few variable assumptions shall be assumed in this context.
Variablemas the alternatives (options), variable n as the attri-butes/criteria and the score of each option with respect to each criterion.
Letxijscore of optioniwith respect to criterionj.
Let the matrix,X= (xij)mnmatrix.
Let the variableJbe the set of benefit attributes or criteria (more is better).
[image:4.595.84.254.70.468.2]Let the variableJ0 be the set of negative attributes or criteria (less is better).
Non-vital:
m¼
H2SO4 WWT FL 0 B @ 1 C An¼
a1 a2 b1 b2 c1 c2
0 B @ 1 C A
Therefore, criteria matrix form is:
x11 x12 x21 x22 x31 x32
0 B @ 1 C A¼
0:5 0:61 2:1 5:0 20:6 50:4
0 B @ 1 C A Semi-vital: RC CIO2 CIO2R NaOH NaOHR O2 PDM 0 B B B B B B B B B B B @ 1 C C C C C C C C C C C A ¼
y11 y12 y21 y22 y31 y32 y41 y42 y51 y52 y61 y62 y71 y72
0 B B B B B B B B B B B @ 1 C C C C C C C C C C C A ¼
6:2 10:08 0:6 1:09 27:4 28:83
1:3 2:33 21:5 22:63
4:9 5:25 17:4 26:57
0 B B B B B B B B B B B @ 1 C C C C C C C C C C C A Vital: RB TG1 TG2 TG3 CTVE CTTG 0 B B B B B B B B @ 1 C C C C C C C C A ¼
z11 z12 z21 z22 z31 z32 z41 z42 z51 z52 z61 z62
0 B B B B B B B B @ 1 C C C C C C C C A ¼
12:6 30:5 0:5 0:84 0:3 0:49 0:1 0:25 8:2 6:73 8:3 8:25
0 B B B B B B B B @ 1 C C C C C C C C A
The matrix value being normalized, and the weight of each alternative was calculated by using AHP method. The PIS and NIS of EOL and MW for the selected loads are as follow:
PIS = (0.396, 0.001) NIS = (0.001, 0.122)
Hence, the distance between the alternatives with the positive and negative ideal solutions can be obtained by using Eqs. (5) and (6).
For positive ideal solution
SI¼
ffiffiffiffiffiffiffiffiffiffiffiffiffiffiffiffiffiffiffiffiffiffiffiffiffiffiffiffiffiffiffi X
ð
v
ijPISÞ2
q
ð5Þ
For negative ideal solution
SNI¼ ffiffiffiffiffiffiffiffiffiffiffiffiffiffiffiffiffiffiffiffiffiffiffiffiffiffiffiffiffiffiXð
v
iNISÞ2q
[image:5.595.33.555.86.249.2]ð6Þ
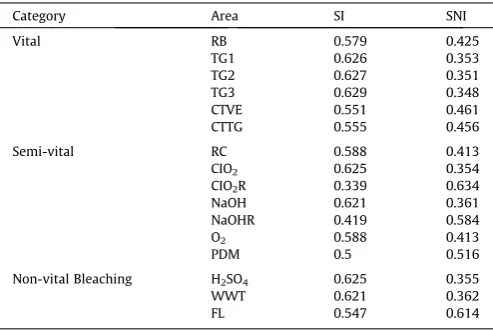
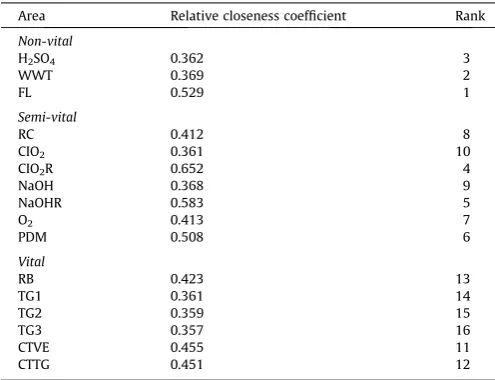
Table 3shows the SI and SNI values for each alternative in every category. On the other hand, the relative closeness coefficient and the load ranking can be tabulated inTable 4.
6. Analysis
In this paper, a new method in finding weight has been applied. The Analytic Hierarchy Process (AHP) is used to obtain the criteria
Table 2
The selected loads for load ranking analysis.
Category Area EOL MW LV HV
Vital RB 12.6 30.5 303 9
TG1 0.5 0.8445 35 0
TG2 0.3 0.4885 21 0
TG3 0.1 0.246 17 0
CTVE 8.2 6.725 20 6
CTTG 8.3 8.249 25 4
Semi-vital RC 6.2 10.08 135 0
CIO2 0.6 1.088 45 0
CIO2R 27.4 28.83 0 0
NaOH 1.3 2.328 102 0
NaOHR 21.5 22.63 0 0
O2 4.9 5.253 28 0
PDM 17.4 26.57 621 11
Non-vital Bleaching H2SO4 0.5 0.61 49 0
WWT 2.1 5 120 3
FL 20.6 50.4 290 6
[image:5.595.57.258.277.409.2]EOL, Estimate operating load; MW, Area power in Megawatt; LV, Number of low voltage motors; HV, Number of high voltage motors.
[image:5.595.304.551.589.754.2]Fig. 5.The percentage of load in each category.
Table 3
The distance between alternatives.
Category Area SI SNI
Vital RB 0.579 0.425
TG1 0.626 0.353
TG2 0.627 0.351
TG3 0.629 0.348
CTVE 0.551 0.461
CTTG 0.555 0.456
Semi-vital RC 0.588 0.413
CIO2 0.625 0.354
CIO2R 0.339 0.634
NaOH 0.621 0.361
NaOHR 0.419 0.584
O2 0.588 0.413
PDM 0.5 0.516
Non-vital Bleaching H2SO4 0.625 0.355
WWT 0.621 0.362
weight while the Technique for Order Preference by Similarity to Ideal Solution (TOPSIS) method is used to rank the selected load into series of sequences. In AHP method, the weight represents the priority of each criterion. From the calculations, the higher that the value of weight calculated (WAHP), the higher that the priority of one criteria. The numerical weight or priority derived from AHP allowing diverse and often incommensurable elements to be com-pared each other in a rational and consistent way. These values were then taken as their weight for TOPSIS usage.
After the executions of TOPSIS method, the analyses of percent-age of loads in every category are shown inFigs. 6–8. First, among 25 of areas in a pulp mill industry, there were 16 areas that been chosen for load shedding scheme. The load shedding should begin from the non-vital loads, and then go to semi-vital loads. The vital loads can only be shed if there was a circumstance such that gen-erator encounter severe damage. Voltage collapse can be caused by the higher estimation load in one system. Hence, in order to apply the load shedding scheme on an industry, load estimation can be one of the main criteria to be taken into account.
Secondly, the evaluation ranking sheds more on the areas that have higher estimation loads. The areas, FL, WWT, H2SO4 rank 1st, 2nd and 3rd respectively. Part of the reason is that, these three areas are having higher estimation loads and were in the non-vital group while the power supplies from the generator is just in the adequate manner to support the system. For other areas, CIO2R, NaOHR, and PDM rank 4th, 5th, and 6th respectively. These areas mostly stand of lower energy consumption but the power supplies towards the estimated load are much more sufficient. Hence, the area, PDM comes out to be the last area to shed in semi-vital group. Based on the above analyses, a few recommendations are pro-vided to improve the performance of the electrical system. First, the area that often occurring shortage of power supply should un-dergo monthly analyses on the power quality. This could help in gathering the relevant data and identifying the problems that occur-ring in the system. Besides that, all the operators shall ensure all un-used machines or any unnecessary loads were off after un-used. With this, it helps in reducing the demand of the energy during the peak hour. When unnecessary load is being shed, it could adequately overcome the insufficient power supply form the main generator.
In the industry, the load shedding method shall be conducted by operators who is more experience and could act fast to start the load shedding manually. Hence, with the help of ranking, the oper-ator can take and identify the load that should be shut down first. However, time relay will cause a system to collapse. Hence, this
ranking can also be programmed into the system based on tripping time needed.
7. Conclusions
The procedure of extended TOPSIS is explained in seven steps. Within the steps, it includes the normalized rules of combination as the pre-operation of external collection, defining the PIS and NIS, calculating the separation measurements of each alternative from total PIS and NIS, computing the closeness coefficient of each alternative and the ranking of the preference order for group.
[image:6.595.317.558.68.188.2]This paper presents an idea to combine the TOPSIS multi-crite-ria decision making with the load shedding in large pulp mill of electrical power system. This method is an agent in searching the best set of load to be shed to recover the shortage of the available electricity. The result satisfied the theory of load shedding where the largest load is the load to be shed to overcome the voltage shortage in a short time.
Table 4
The relative closeness coefficient and load ranking.
Area Relative closeness coefficient Rank Non-vital
H2SO4 0.362 3
WWT 0.369 2
FL 0.529 1
Semi-vital
RC 0.412 8
CIO2 0.361 10
CIO2R 0.652 4
NaOH 0.368 9
NaOHR 0.583 5
O2 0.413 7
PDM 0.508 6
Vital
RB 0.423 13
TG1 0.361 14
TG2 0.359 15
TG3 0.357 16
CTVE 0.455 11
[image:6.595.318.558.233.357.2]CTTG 0.451 12
Fig. 6.The percentage of power consumption and load contribution in non-vital
[image:6.595.319.555.403.533.2]loads.
Fig. 7.The percentage of power consumption and load contribution in semi-vital
loads.
[image:6.595.42.290.563.753.2]Acknowledgement
The authors gratefully acknowledged staff in the Laboratory of Electric Machines and Drives as well as the Laboratory of Electric Power, UTHM for their valuable contribution towards the success of this work. The authors would like to thank the Ministry of High-er Education, Malaysia (MOHE) and Research and Innovation Cen-tre, UTHM for financially supporting this research under the Fundamental Research Grant Scheme (RGS) Grant No. 0704.
References
[1] Goh HH, Kok BC. A unique load shedding application in a large pulp mill elctrical system. Int Conf Environ Electri Eng 2010.
[2] Palaniswany KA, Sharma J, Misra KB. Optimum Load Shedding taking into account of Voltage and Frequency Characteristic of Load. IEEE Trans Vol Power Apparatus Syst 1985;PAS-104:1342–8.
[3] Perumal Ir N, Chan CY. A proposed strategy of implementation for load shedding and load recovery with dynamic simulations. In: National Power & Energy Conference (PECon) 2004, IEEE Explore; 2004. p. 185–9.
[4] Worawat N, Istvan E. Optimal load shedding for voltage stability enhancement by ant colony optimization. International conference on intelligent system application to power systems. World Academy of Science, Engineering and Technology; 2009. p. 1003–8.
[5] Cai GL, Zhang YJ, Cai ZX, Yu, T. A corrective load shedding control scheme to prevent voltage collapse. In: International Power Engineering Conference (IPEC 2007), IEEE Explore; 2007. p. 817–21.
[6] Arya LD, Singh P, Titare LS. Differential evolution applied for anticipatory load shedding with voltage stability considerations. International Journal of Electrical Power & Energy Systems 2012;42:644–52.
[7] Hooshmand R, Moazzami M. Optimal design of adaptive under frequency load shedding using artificial neural networks in isolated power system. Int J Electr Power Energy Syst 2012;42:220–8.
[8] Karimi M, Mohamad H, Mokhlis H, Bakar AHA. Under-Frequency Load Shedding scheme for islanded distribution network connected with mini hydro. Int J Electr Power Energy Syst 2012;42:127–38.
[9] Giroletti M, Farina M, Scattolini R. A hybrid frequency/power based method for industrial load shedding. Int J Electr Power Energy Syst 2011;35:194–200. [10] Yu TB, Zhou JZ, Zhao K, Wang W, Wang WS. Study on project experts’
evaluation based on analytic hierarchy process and fuzzy comprehensive evaluation. In: International conference on intelligent computation technology and automation, IEEE explore; 2008. p. 941–5.
[11] Loken E, Botterud A, Holen Arne T. Decision analysis and uncertainties in planning local energy systems. In: International conference on probabilistic method applied to power systems KTH, Stockholm, Sweden, IEEE Explore; 2006.
[12] Cheng E, Li H, Ho D. Analytic hierarchy process (AHP). Measuring business excellence bradford 2002;6:33–8.
[13] Dashti Z, Pedram MM, Shanbehzadeh J. A multi-criteria decision making based method for ranking sequential patterns. In: International multi conference of engineers and computer, scientist; 2010.
[14] Dan Xue, Zhao QL, Guo XY. TOPSIS method for evaluation customer service satisfaction to fast food industry, IEEE Explore; 2008. p. 920–5.
[15] Hwang CL, Yoon K. Multiple attribute decision making methods and applications. New York: Springer-Verlag; 1981.