R E S E A R C H
Open Access
QoS priority-based dynamic frequency band
allocation algorithm for load balancing and
interference avoidance in 3GPP LTE HetNet
Zeeshan Kaleem, Bing Hui and KyungHi Chang
*Abstract
A 3rd Generation Partnership Project (3GPP) Long Term Evolution (LTE) system uses the concept of two-tier heterogeneous networks (HetNets), where low-power and short-range femtocells are laid under macrocells to fulfill the quality of service (QoS) requirements of users and to boost overall network capacity. However, co-channel interference is one of the major issues that need to be resolved for the successful deployment of HetNets. To overcome this problem, fractional frequency reuse (FFR) schemes have been proposed that can efficiently utilize the available spectrum. Nevertheless, these schemes waste limited frequency resources owing to their static allocation and lack of following QoS requirements, network loading conditions, and service priority of users. In this paper, a QoS-based dynamic FFR (QoS-DFFR) scheme is proposed that efficiently allocates the non-occupied center-zone frequency bands, i.e., bonus bandwidth (BBW), to cell-edge users by considering their QoS requirements. Consequently, the proposed QoS-DFFR scheme can optimize cell-edge user throughput and sector throughput and reduce co-channel interference by dynamically allocating the BBW to the most demanding cell-edge users. The proposed QoS-DFFR scheme improves performance because of its ability to dynamically allocate the limited portion of the frequency bands based on the service priorities of users. The system-level simulation results show that the proposed QoS-DFFR scheme performs remarkably well in a HetNet environment. Compared with the usual FFR schemes, the proposed scheme almost doubles the cell-edge user's throughput and reduces the user's packet loss rate.
Keywords:Fractional frequency reuse; Load balancing; Quality of service; Heterogeneous networks; 3GPP LTE
1 Introduction
Conventional cellular systems use a planned homogeneous macrocell-based network architecture where the macro-cells, i.e., evolved NodeBs or eNBs, provide services to the users in the network. In a homogeneous environment, the eNBs have the same transmit power levels, antenna pat-terns, receiver noise floors, and backhaul connectivity. This allows the network to offer a similar quality of service (QoS) to the user equipment (UE) across all cells [1,2]. However, such a deployment is not suitable for cell-edge users because they have weak received signal power from the base stations (BSs). This degrades the QoS and throughput performance of the users.
To improve QoS and throughput performance for the users, two-tier heterogeneous networks (HetNets) are
considered [3]. These networks have conventional eNBs in the first tier, overlaid with low-power LTE-Advanced (LTE-A) femtocells. In LTE-A, femtocells are commonly referred to as home evolved NodeBs (HeNBs). A recent study shows that 114 million mobile users will be acces-sing mobile networks through HeNBs by 2014 [4]. In HetNets that are composed of eNB and HeNB environ-ments, two classes of users are considered. Users who are connected to eNB are called macro users (MUE), while those connected to HeNBs are referred as femto users (FUE). In two-tier HetNets, the HeNBs have the advantages of small form factor, low cost, and smaller coverage. These advantages support reuse of the same licensed band multiple times within the second tier of the HetNets. That is, the employment of HeNB improves QoS for users, spectral efficiency, and hence the capacity of the overall network. However, the use of the same frequency bands between MUE and FUE leads to several
* Correspondence:[email protected]
Department of Electronic Engineering, Inha University, Incheon 402-751, South Korea
kinds of co-channel interference. The major interference scenario involves downlink (DL) interference from HeNBs to MUEs.
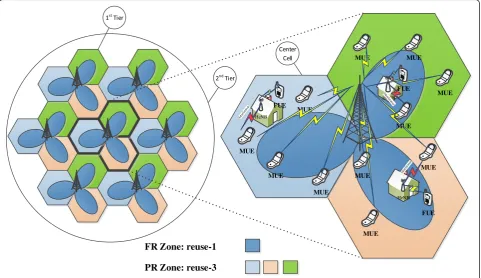
In order to reduce co-channel interference, various kinds of cooperation techniques have been considered in recent literature, including collaborative frequency scheduling among eNBs and HeNBs [5], group formation of HeNBs by exchanging information among neighboring HeNBs [6,7], power control approaches [8-10], and intelligent spectrum access [11]. Moreover, many uncoordinated schemes such as classical fractional frequency reuse (FFR) [12] have been proposed; a cellular network using a frequency reuse factor of 3 (FRF3) would be an example. This type of network re-duces co-channel interference and is particularly helpful in improving cell-edge users' throughput by proper cell plan-ning or spectrum management between the eNB and HeNBs, at the cost of system throughput. In order to balance the cell-edge users' throughput and thus the over-all throughput, a modified FFR scheme where the cell is di-vided into two zones, i.e., full-reuse (FR) and the partial-reuse (PR) zones, as shown in Figure 1, has been proposed [13]. By applying this modified FFR scheme, much research has been conducted to optimize the system throughput. The optimal static FFR (OSFFR) scheme is proposed in [14], where a bigger reuse factor of 6 is employed to im-prove the cell-edge user throughput. Notice that in OSFFR, the available frequency bands are equally allocated to PR zones without considering the network loading conditions.
The scheme of capacity density optimization by fractional frequency partitioning, proposed in [15], maximizes per-user throughput instead of system throughput. However, during the optimization of user throughput per cell, QoS and network loading conditions are not considered. Hence, the capacity density optimization scheme may result in lower spectral efficiency because of the static allocation of frequency bands.
To solve the issues of QoS and network loading condi-tions, we propose a QoS-based dynamic FFR (QoS-DFFR) scheme for frequency band allocation to fulfill users' QoS requirements and to maximize per-user and per-sector throughput. In the proposed QoS-DFFR scheme, the con-cept of bonus bandwidth (BBW) is introduced to dy-namically allocate the frequency bands to the PR zones according to QoS requirements and service priorities of the users. In this way, the QoS of the users can be guar-anteed, and the per-user and per-sector throughput can be optimized, according to network loading conditions.
The rest of the paper is organized as follows: Section 2 describes the system model that includes the network setup, channel models, and physical (PHY) layer. In Section 3, the necessary components of bearer models, schedulers, and traffic models that have their own role in QoS provisioning are covered in detail. Section 4 explains the proposed QoS-DFFR scheme, capacity optimization steps, BBW allo-cation procedure, and several advantages of the proposed algorithm. In Section 5, the performance of the proposed
FR Zone: reuse-1
PR Zone: reuse-3
HeNB
MUE MUE
MUE MUE
MUE
MUE MUE
MUE
MUE
HeNB FUE
FUE
FUE
QoS-DFFR scheme is evaluated using system-level simula-tions. Finally, in Section 6, we draw conclusions.
2 System model 2.1 Network setup
In this paper, the DL of a 3rd generation partnership pro-ject (3GPP) LTE-A system is considered. Each user is allo-cated a number of so-called physical resource blocks (PRBs) in the time-frequency grid. The PRBs correspond to the smallest radio resource that can be assigned to UE for data transmission. A resource block has a size of 180 kHz in the frequency domain and 0.5 ms in the time domain. Due to the fixed size of PRBs, the number of PRBs varies according to the system bandwidth (BW) configuration, e. g., 50 and 100 PRBs for system BWs of 10 and 20 MHz, respectively. In this paper, to avoid co-channel interfer-ence, both the eNBs and HeNBs utilize the fractional frequency bands instead of the full system BW.
2.1.1 HetNet deployment scenario
We consider a two-tier HetNet environment with 19 eNB sites. Each site is composed of three hexagonal sectors, as shown in Figure 1. In the deployed scenario, the center cell and first-tier cells are the area of interest, while second-tier cells consist of only eNBs to generate interfer-ence to the users. The area of interest consists of eNBs, HeNBs, MUEs, and FUEs. In each hexagonal sector, a 5 × 5 grid model is considered for HeNB deployment.
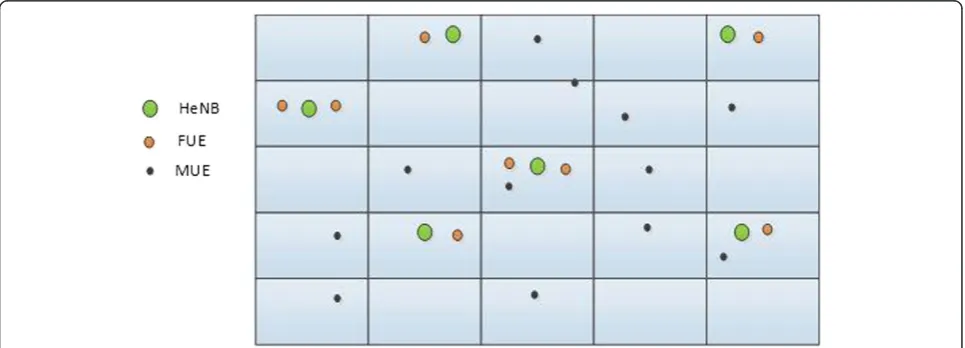
The 5 × 5 grid model is a simple model for HeNB urban deployment. It is composed of 25 apartments, as shown in Figure 2. Each apartment is of size 10 m × 10 m, and the apartments as placed next to each other. The number of HeNBs per grid depends upon the deployment ratio, while the percentage of an active HeNB in a single apartment is decided by the activation ratio [16]. MUEs are dropped randomly throughout the indoor and outdoor macro site areas using a uniform distribution pattern. Hence,
it is possible that some MUEs will be dropped into the HeNB area, as shown in Figure 2. It is assumed that at least one FUE is connected per HeNB. In this paper, we set all the HeNBs as active.
2.1.2 General notations
The general notations of the considered network are given below.
Mis the set of eNBs. Fis the set of HeNBs.
Uis the set of UEs separated into two subsetsUm andUf, where each subset represents MUE and FUE, respectively.
Nmis the set of PRBs used in eNBm. Each PRBnm, with 12 subcarriers, has an equal transmission power for each subcarrier.
Nfis the set of PRBs used in HeNBf. Each PRBnf, with 12 subcarriers, has an equal transmission power for each subcarrier.
Gnm
um is the channel gain between the eNBmand the MUEumon PRBnm.
Gnf
uf is the channel gain between the HeNBfand the FUEufon PRBnf.
Inm
um is the aggregate interference at MUEum, composed of interference from eNB and HeNB on PRBnm.
Inf
um is the aggregate interference at FUEuf composed of interference from eNB and HeNB on PRBnf.
ηis the thermal noise, including the UE noise figure, per PRB.
SINRnm
um is the received signal-to-interference-plus-noise ratio (SINR) observed by MUEumon PRBnm.
SINRnuff is the received SINR observed by FUEufon PRBnf.
The SINRs observed on PRBs nm and nf by MUEum
and FUEuf, respectively, are described as
SINRnmum ¼G
uf is the transmit power from eNB m
and HeNBfto MUEumand FUEufon PRBsnmandnf, respectively. The aggregate interferences Inm
um and I nf uf
re-ceived by MUEumand FUEuf, respectively, are given as
Inmum¼ X
Equation 2 describes the total interference received by MUE and FUE from their surrounding eNBs and HeNBs. The number of eNBs and HeNBs providing interference to MUE or FUE depends upon the specific frequency reuse scheme being used.
2.2 Channel model and antenna patterns
The channel model represents the propagation loss that occurs when the signal travels from the transmitter to the receiver. The general equation to model the channel gain is given as
Gð Þ ¼dB Antenna gain−Path loss−Shadowing
−Fading−Penetration:
ð3Þ
2.2.1 Path loss
To calculate the path loss (PL) of MUEs residing outside a building and connected to an eNB, the urban area model [17] is considered as
PL dBð Þ ¼40⋅110−3to 410−3⋅Dhb⋅log10ð ÞR −18⋅log10ðDhbÞ þ21⋅log10ð Þ þf 80;
ð4Þ
where R is the distance between the eNB and MUE in kilometers,fis the carrier frequency in MHz, and Dhb is the BS antenna height, in meters, measured from the aver-age rooftop level. For an MUE located inside a building and served by an eNB, the path loss calculation considers an additional attenuation factor of 20 dB due to the pres-ence of an external wall.
For FUEs connected to HeNBs, the indoor propagation model specified in the LTE-A evaluation methodology [16] for a dense urban deployment of HeNBs is consid-ered. This model is the simplified PL model, which avoids modeling any walls and considers only the distance R, expressed in meters, between the transmitter and receiver.
PL dBð Þ ¼127þ30⋅log10ðR=1000Þ: ð5Þ
2.2.2 Shadowing
Shadowing is caused by obstacles in the paths between the UEs and the BS. Shadowing is usually modeled by a log-normal distribution with a mean of 0 dB and stand-ard deviation of 4 dB for the link between the HeNB and UE [16]. For all other links, including interference links, the standard deviation is 10 dB. The concept of a correlated shadow fading map proposed by Claussen for eight neighbors [18] is used, and the inter-site correl-ation value of 0.5 is considered [17].
2.2.3 Fast fading
Fast fading is the result of the constructive and destruc-tive combination of randomly delayed, reflected, scattered, and diffracted signal components. This type of fading is relatively fast and is therefore responsible for the short-term signal variations that can occur when UEs or reflec-tors in an environment move short distances. In this paper, the fast-fading component of the signal is gener-ated according to the WINNER II channel model [19]. The WINNER II channel model is suitable for indoor and outdoor users and is an evolution of the 3GPP spatial channel model extended (SCME). WINNER II covers more scenarios than 3GPP SCME and intro-duces additional features such as support for arbitrary 3D antenna patterns, multidimensional channel model-ing for carrier frequencies between 2 and 6 GHz, and BWs up to 100 MHz. WINNER II is a more reliable and practical model for system-level simulations than the SCME model.
2.2.4 Antenna patterns
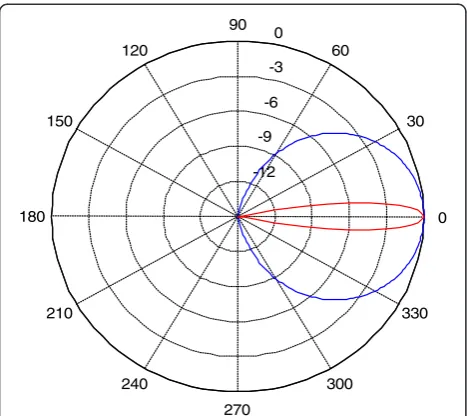
The 3D antenna patterns given by horizontal and verti-cal cuts are used for eNB as shown in Figure 3. The horizontal and vertical antenna patterns are modeled as
AHð Þ ¼φH −min 12
where AH andAVare the horizontal and vertical antenna patterns, respectively [17].φHandθVare the azimuth and
vertical orientation, respectively. φ3dB, θ3dB are the 3-dB
horizontal and vertical beam widths, respectively, andAm
and SLVvare the backward attenuation and side lobe
verti-cal attenuation, respectively.θetiltdescribes the downtilt of
the electrical antenna.
Typical values for these parameters are as follows:−180≤ φH≤180,−180≤θV≤180,φ3dB= 70°,θ3dB= 10°,Am= 25 dB,
the antenna gain is 15 dBi [17], which is suitable for an urban environment. Then, the 3D antenna patterns for eNB are represented as
Aðθ;φÞ ¼−min AVð Þθ vþAHð Þφ H;Am
: ð7Þ
The antenna patterns for UEs and HeNBs are assumed to be omnidirectional.
2.3 PHY layer
We abstract the PHY layer by considering the single-input single-output (SISO) antenna configurations, addi-tive white Gaussian noise (AWGN) channel, and turbo code of rate 1/3. In LTE-A, the channel quality indicator (CQI) index is defined in terms of a channel coding rate and modulation schemes such as quadrature phase shift keying (QPSK), 16 quadrature amplitude modulation (QAM), and 64QAM [20].
The higher layers are modeled by considering the multiple-input multiple-output (MIMO) antenna con-figurations and the parameters mentioned in Table 1. In system-level simulations, the PHY layer, including all signal processing, cannot be explicitly simulated due to prohibitive complexity. To avoid actual signal processing, in system-level simulations, a link-to-system interface composed of a suitable PHY layer abstraction is typically used. Because the parameters of the PHY abstraction models such as frequency, symbol duration, and error cor-recting codes do not depend on the channel models or the multi-antenna techniques employed, the SISO-abstracted PHY layer can be used for MIMO configura-tions in the system-level simulaconfigura-tions [21]. The goal of this PHY layer abstraction is essentially to obtain a block error rate (BLER) for a transport block (TB) without
having to carry out real signal processing. To assess the BLER of the received TBs, a set of AWGN link-level performance curves are employed. The SINR-to-BLER mapping then requires an effective SINR value, which is obtained from mapping the set of subcarrier SINRs assigned to the UE TB to an AWGN-equivalent SINR. The mutual information-based effective SINR mapping (MIESM) [22] is the method currently used to obtain a TB-effective SINR that can be used to map to the BLER obtained from the AWGN link-level simula-tion. The details regarding the PHY layer abstraction are provided in Section 5.2.
-12
Figure 33D antenna: horizontal and vertical patterns.
Table 1 Simulation parameters
Parameters Values
Link-level parameters
Frequency 2.19 GHz
Bandwidth (BTOT) 20 MHz
Channel model AWGN
AMC formats QPSK: 1/3, 1/2, 2/3, 4/5
16QAM: 1/2, 2/3, 4/5
64QAM: 2/3, 4/5
Channel coding Turbo code (1/3)
Number of antennas SISO (1 × 1)
System-level parameters
Number of eNBs 57 (two rings, 19 sites)
(only 21 inner cells are in the region of interest)
Inter-eNB distance 500 m
Initial FR zone radius (RFR) 0.65
Number of HeNBs 126 (6/grid)
HeNB deployment 5 × 5 grid
UEs per eNB and HeNB 10, 2
eNB frequency reuse 3
Minimum coupling loss 70 dB (eNB)
40 dB (HeNB)
Fading channel model WINNER II
Path loss model Urban (eNB)
Grid Model (HeNB)
Shadowing Claussen Fading Model
UE speed 3 km/h
Noise spectral density −175 dBm/Hz
Number of antennas 4 × 4
MIMO modes CLSM
Antenna pattern TS 36.942 3D (eNB)
Omnidirectional (HeNB)
UE receiver Zero Forcing (ZF)
3 QoS provisioning in LTE-A
In an LTE-A network, users have diverse QoS require-ments. The QoS differentiation enables communication service providers (CSPs) to manage the performance of mixed traffic flows. Hence, it is vital for CSPs to treat users based on their QoS requirements and service priorities. The bearer models and schedulers are used to meet the QoS requirements of the users. The bearer models dis-criminate the mixed traffic flows, while the schedulers allocate frequency bands to users. The frequency bands are allocated among users by considering metrics such as throughput, head-of-line (HOL) packet delays, prior-ities, and fairness.
3.1 Traffic models
To simulate typical traffic and network loading conditions, the realistic traffic models in [23] are used to assess the performance of the proposed QoS-DFFR scheme. The users are differentiated in terms of applications they use, e.g., VoIP, video, gaming, HTTP, and file transfer protocol (FTP). In this paper, to fully utilize the traffic models at a user level, the complete LTE protocol stack and bearer models are considered [24].
3.1.1 Voice over Internet Protocol traffic model
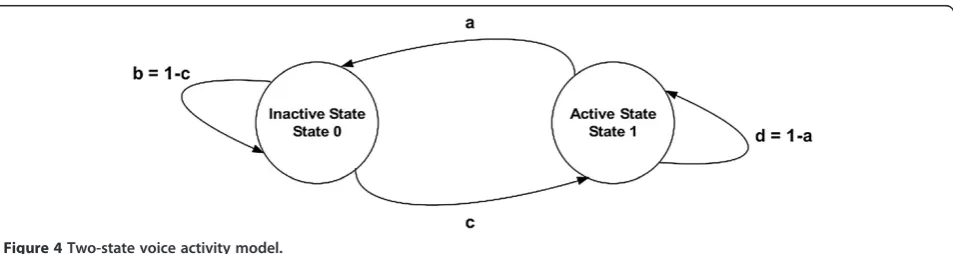
For voice over Internet Protocol (VoIP) applications, we use ‘on’and ‘off’ Markov models, as shown in Figure 4 [23]. In a VoIP model, the probability of transitioning from active state 1 to non-active state 0 is ‘a’, while the probability of transitioning from non-active state 0 to ac-tive state 1 is‘c’. At a voice source rate of 12.2 kbps, a voice frame consisting of 244 bits is generated every 20 ms. A si-lence insertion descriptor (SID) packet consists of 15 bytes, and a SID packet is transmitted every 160 ms during silent periods.
The probability of being in active state 1 and non-active state 0 is calculated by (8) and is represented by P1andP0, respectively:
P1¼ c aþc P0¼
a aþc
:
8 <
: ð8Þ
3.1.2 Video traffic model
In video traffic model, a source rate of 64 kbps is as-sumed. Each frame of video data arrives at a regular interval Tdetermined by the number of frames per sec-ond. Each frame is decomposed into a fixed number of slices; that is, the maximum eight slices per frame has been considered, and each is transmitted as a single packet. The size of these packets is modeled as a truncated Pareto distributionpxwith mean, maximum, location parameter (α), and shape parameter (k) values of 10 bytes, 250 bytes, 1.2 ms, and 20 bytes, respectively [23]:
px¼ α α k
αþ1; k≤x<m; ð9Þ
px¼ k m
α
; x¼m; ð10Þ
The video encoder introduces a delay between the packets of a frame. These delay intervals are also mod-eled by a truncated Pareto distributionpx, given in (9), with mean, maximum, location parameter (α), and shape par-ameter (k) values of 6 ms, 12.5 ms, 1.2 ms, and 2.5 ms, respectively.
3.1.3 Gaming traffic model
To simulate the random timing relationship between the arrival of a client traffic packet and the DL frame bound-ary, the starting time of a network gaming mobile is uni-formly distributed within the specified range of [0, 40] ms. The initial packet arrival of the game is described by the uniform distributionuxas
ux¼
1
b−a; fora≤x≤b where a¼0; b¼40 ms: ð11Þ
The packet size and the packet arrival time are de-scribed by the largest extreme value distributiongx, which is described as for the packet arrival time and packet size, respectively.
3.1.4 Web-browsing HTTP traffic model
For web browsing, a web page consists of a main object and embedded objects. After receiving the main page, the web browser will parse for the embedded objects. The main parameters to characterize web browsing are the main size of an object SM, the size of an embedded object SE, the
number of embedded objectsND, reading timeD, and
pars-ing time for the main pageTP. The main object sizeSMand
the embedded object sizeSE are generated by using
trun-cated lognormal distributionlxin (13) with the specific minimum, maximum, mean, and standard deviation values in [23]. The reading timeDand parsing timeTPare
calcu-lated by using exponential distribution ex in (14) with
λ= 0.033 andλ= 7.69, respectively:
3.1.5 Best effort (FTP) traffic model
An FTP is considered to be the best-effort traffic. An FTP session is a sequence of file transfers separated by reading timeD. The two main FTP session parameters are sizeSof a file to be transferred and reading time D, i.e., the time interval between the end of download of the previous file and the user request for the next file. The files of sizeSare also generated by using (13), while reading timeDis calcu-lated by using (14) with the specific minimum, maximum, mean,λ, and standard deviation values given in [23].
3.2 Bearer model
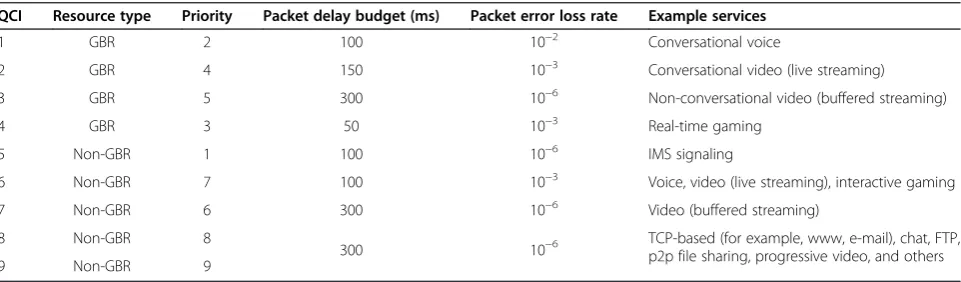
In LTE-A specifications [24], the evolved packet system (EPS) bearer has been introduced to provide QoS differen-tiation. The EPS bearer maps a flow into a logical channel established between the UE and the gateway (GW). More-over, a radio bearer is associated with each EPS bearer as a logical channel between UE and eNB. There are two types of bearers: the default bearer and the dedicated bearer. The default bearer is established when the UE is attached to the network, and it remains established during the life-time of the connection, providing basic connectivity and exchange of control messages. By contrast, the dedicated bearer is established when there is a need to provide QoS to specific services such as VoIP, video, and web browsing. Orthogonally, bearers can be also classified as guaranteed bit rate (GBR) or non-guaranteed bit rate (non-GBR), according to the QoS requirements of the flow they map. In particular, the default bearer is a non-GBR; a dedi-cated bearer can be GBR or non-GBR. A set of QoS pa-rameters is therefore associated with each bearer depending on the application data it carries, thus enabling differ-entiation among flows. Several classes of QoS have been identified through QoS class identifiers (QCIs), as given in Table 2 [25].
3.3 QoS-aware scheduling in LTE-A
To satisfy the users' QoS requirements during one trans-mission time interval (TTI) or subframe, which is the smal-lest scheduling interval in LTE-A, the frequency bands should be allocated efficiently among users. During sched-uling, the frequency bands are usually allocated to users who maximize a metric in (15):
mj;k¼ max mi;k
: i
ð15Þ
This metric can be considered as the transmission pri-ority of each user in a specific resource block. The value of the metric depends upon QCI values associated with each flow. The schedulers are used to differentiate the
Table 2 Standardized QCIs for LTE
QCI Resource type Priority Packet delay budget (ms) Packet error loss rate Example services
1 GBR 2 100 10−2 Conversational voice
2 GBR 4 150 10−3 Conversational video (live streaming)
3 GBR 5 300 10−6 Non-conversational video (buffered streaming)
4 GBR 3 50 10−3 Real-time gaming
5 Non-GBR 1 100 10−6 IMS signaling
6 Non-GBR 7 100 10−3 Voice, video (live streaming), interactive gaming
7 Non-GBR 6 300 10−6 Video (buffered streaming)
8 Non-GBR 8
300 10−6 TCP-based (for example, www, e-mail), chat, FTP,p2p file sharing, progressive video, and others
(a)
(b)
specific flows and to schedule the users based on their QoS requirements and service priorities. In this paper, we consider the exponential proportional fair (EXP/PF) scheduler [26] to separate the real-time (RT), non-real-time (NRT), and best-effort (BE) flows.
The EXP/PF scheduler gives priority to the real-time packets with respect to non-real-time packets when the packets' HOL delay is very close to the delay threshold. For real-time flows, the metric is given as
mi;j¼ exp βi
whereTi,jis the instantaneous available data rate for the
ith flow and thejth sub-channel,Ri is the available past data rate,DHOL,iis the HOL packet delay,δiis the
max-imum probability that the packet delay can increase
DHOL,i, and Nrt is the number of active DL real-time flows.
For non-real-time and BE flows, the metric will be based on a simple PF scheduler [27]. The PF scheduler metric is defined as the ratio between the instantaneous data rate and the past average data rate:
mi;j¼ Ti;j
Ri : ð
17Þ
4 Proposed QoS-based dynamic FFR scheme for load balancing and interference management in HetNets
The conventional and proposed QoS-DFFR scheme is based on dividing the cell area into two zones, i.e., center and edge zones. In the center zone, which is named an FR zone, the interference is lower and reuse-1 is employed. In edge zones, which are named as PR zones, the users have high co-channel interference, and therefore, reuse-3 is employed. The FR zone is represented asA, while the PR zones are labeled asB,C, andDin Figure 5a.
4.1 Conventional FFR scheme
In conventional FFR, the total BW is divided into center and cell-edge frequency bands:
BTOT¼ BFRþ3BPR; ð18Þ
whereBTOTis the total available BW, andBFRand BPR
denote the FR and PR BW, respectively. The normal-ized FR and PR BW are represented as βFR and αPR,
The FR and PR zones are separated by a partitioning boundaryρ, as shown in Figure 5a. The frequency bands allocated to the FR and PR zones depend on the size of each zone. The users are uniformly distributed in the sector; hence, by varying the partitioning boundary ρ, as described in [15], the number of frequency bands allo-cated to each sector also varies. Taking this into account, a normalized BW density (Hertz per unit of surface) is defined as zones, respectively. In a conventional FFR scheme, fre-quency bands are equally divided in the PR zones, but this division is valid only for constant network loading condi-tions. For mixed traffic flows, the QoS requirement of users per sector is different; i.e., some sectors need more BW, while others do not request the same amount of BW during the same TTI. Therefore, under the conventional FFR scheme, user capacity per sector is optimized without considering network loading conditions. The capacity for FR and PR zones in the conventional FFR scheme is described as
Hence, in the conventional FFR scheme, a significant amount of BW is wasted because the scheme does not consider the dynamic network loading conditions. This BW wastage results in a less spectrally efficient system.
4.2 Proposed QoS-based dynamic FFR scheme
we allocate all of the available BW to the BBW, then the main purpose of dividing the area into PR and FR zones, to avoid interference among users by utilizing the orthogonal frequency bands, would not be fulfilled. Hence, the system will behave more like the reuse-1 system than FFR with reuse-3. This increases the peak throughput at the cost of mean and edge throughput. Thus, in the proposed QoS-DFFR scheme, eNB initially partitions the BW into seven parts as
BTOT¼BWAþBWBþBWCþBWD
þðFBþFCþFDÞ; ð24Þ
Of the above seven BWs, four parts of the frequency bands are initially allocated to the FR zones. These parts include the BBW, i.e., BWA+FX, where FX is the BBW with X= {B, C, and D}, while the other three parts are equally divided in the PR zones according to (27). The number of BBW bands in the proposed scheme depends upon the number of PR zones. By considering BBW allo-cation, the tessellation property of FFR-3 will remain valid
because it always has one FR zone and three PR zones in the scenario.
The amount of dedicated BW and BBW is proportional to the size of the area. To optimize users' per-sector cap-acity according to the varying network loading conditions, the partitioning boundaryρis varied in every subframe, i.e., the BW allocated to each zone will be different per sub-frame. By considering the uniform distribution of the users over each cell, varying the partitioning boundary
ρ effectively alters the amount of physical resources that can be allocated to each user.
optimum average throughput in the FR zone, the FR zone radius (RFR) should be 0.65 of the normalized radius (R)
of the cell. Hence, we start our simulation by considering RFR= 0.65 and then vary it in steps ofΔRFR= 0.05 as the
demand in the PR zone varies due to dynamic FFR con-ditions. Thus, the exact values of the FR zone, PR zone, and BBW in each subframe duration can be calculated as follows:
BFRð Þ ¼i BTOT
RFRð Þi
R
2
¼BWAð Þ þi FXð Þi;
where RFRð Þi : radius of FR zone in sub‐frame TTIð Þi R: radius of the cell
ð25Þ
BWA>BWX: ð26Þ
BPRð Þ ¼i
BTOT−BFRð Þi
3
¼BWX:
ð27Þ
FXð Þ ¼i BTot
RFRði−1Þ R
−BTot RFRð Þi
R
;
where RFRð Þi : the radius of FR zone in
current sub‐frame TTIð Þi; RFRði−1Þ:the radius of FR zone in
previous sub‐frame TTIð Þi ð28Þ
The constraint in (26) is reasonable because all users in the macrocell are uniformly distributed, and a larger area contains a higher number of users.
To allocate the dedicated FR bands, PR bands, and the BBW, the main steps are as follows:
Initially, the eNB will allocate the dedicated bands and BBW in the FR zone. As soon as the dedicated bands are assigned, available BBW is dynamically assigned to more demanding PR zones. Next, HeNBs (while allocat-ing the dedicated BWs to FUEs) will start to allocate or-thogonal frequency bands alternatively to MUEs in order to avoid co-channel interference. To avoid interference be-tween the MUEs and FUEs, the orthogonal frequency bands are allocated between the eNB and HeNBs by using the orthogonal frequency band allocation algorithm pro-posed in [28].
The main steps involved in that algorithm to allocate the orthogonal resources for HeNBs are as follows: First, the set of usable frequency sub-bandsJUfor the HeNB is initialized to the set of all available frequency sub-bands Jin a macrocell. When HeNB is turned on, it senses the neighboring macrocell signals and estimates the received signal strength indication (RSSI) value (Rj) for each fre-quency sub-band. Let T denote the set of RSSI values for all available frequency sub-bands in the macrocell, and let Rj* denote the highest RSSI value. If the RSSI value of sub-bandAmatches the highest value, then the HeNB is located in the FR zone. Otherwise, the HeNB is located in one of the PR zones. In this case, the HeNB will avoid using sub-band Aand can use the other sub-bands B, C, and D of the PR zones. Finally, the same procedure is adopted by the HeNBs to avoid using the same frequency bands as the eNBs in the PR zones.
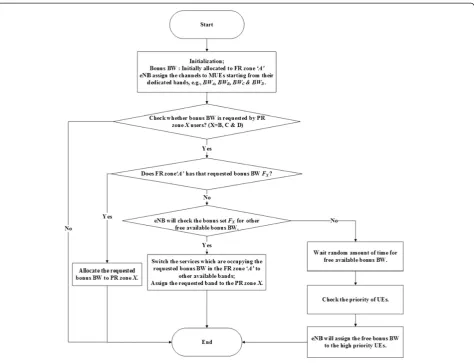
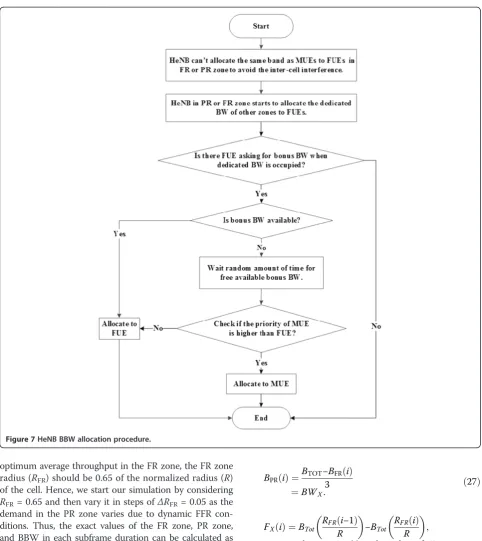
In every subframe to allocate the BBW, the eNB and the HeNB will check on the demand raised for BBW in PR zones X by MUEs and FUEs, respectively. If MUEs or FUEs in PR zoneX demand the BBW, then the eNB or HeNB will check whether the requested BBW has been occupied by the UEs in the FR zone. If BBW is available, the eNB or HeNB will allocate it to PR zoneX; otherwise, the eNB or HeNB will switch the FR zone users to other available frequency bands and will allocate the requested frequency bands to PR zoneX. If no free frequency band is available in FR zone and there is still demand from PR zone users, the users will wait a random amount of time for free available BBW. If BBW is available, it will be allo-cated to users by comparing priorities and QoS re-quirements of users in PR zones by using Table 2. The
flowcharts of the proposed eNB and HeNB BBW alloca-tion procedures are shown in Figures 6 and 7, respectively. The QoS-DFFR scheme is implemented independently in each cell to dynamically allocate the BBW based on the service priorities of the users. Therefore, the BBW alloca-tion will not break the orthogonality of FFR-3 as it con-siders the orthogonal frequency-band allocation algorithm [28]. Similarly, BBW allocation in the center cell will not interfere with the cells in the first and second tiers because the cell is partitioned into FR and PR zones, as shown in Figure 5. This partitioning helps to avoid cell inter-ference. After BBW is allocated to one of the PR zones, the remaining BW in the FR zone is described as
BƛFR¼BWA−FX: ð29Þ
(a)
(b)
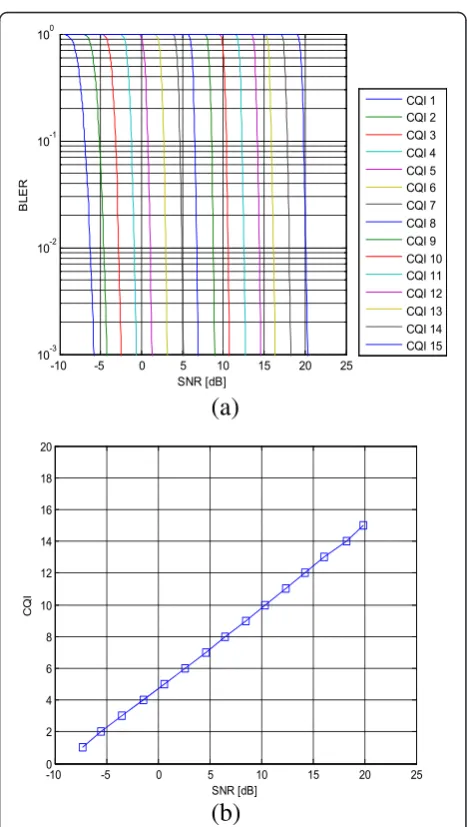
Figure 8BLER curves. (a)BLER curves under SISO AWGN channel for 15 CQI values and(b)SINR-to-CQI mapping at 10% BLER. Table 3 User percentages for different traffic categories
Application Traffic category Percentage of users
FTP Best Effort 10%
Web browsing/HTTP Non-real time 20%
Video Real time 20%
VoIP Real time 30%
Therefore, after BBW allocation, the ratio of BW allo-cated to each of the FR and PR zones can be given as
βƛ
FRð Þ ¼ρ BƛFRð Þρ =BTOT;with βƛFRð Þ∈ρ ½0;1; ð30Þ
αXƛPRð Þ ¼ρ 1 3 1‐β
ƛ
FRð Þρ
þ FX
BTOT;
with αBƛPRð Þ≠ρ αCƛPRð Þ ¼ρ αDƛPRð Þρ; ð31Þ
where βƛFRð Þρ is the ratio of the BW allocated to the FR zone andαXƛPRð Þρ is the ratio of the BW allocated to each
of the PR zonesXafter BBW allocation. In (31), FX BTOTis the
normalized BBW allocated to one of the PR zonesX. As a zone changes its size, the resources that can be allocated to users also changes. Thus, to consider this effect, the normalized BW density is defined in (32) as a function of partitioning boundaryρ:
NBW densityð Þ ¼ρ while the other parameters are as described in (21).
Thus, in the proposed QoS-DFFR scheme, users-per-sector capacity is optimized by considering network loading conditions. Hence, users-per-sector capacity after allocating the BBW can be calculated for the FR and PR zones as
CƛAð Þ;FR ρ;βƛ
acities in the FR and PR zones after BBW allocation. Hence, due to the allocation of BBW to the most de-manding and high-priority PR zone, users-per-sector capacity is optimized.
4.3 Inter-zone scheduling
To efficiently allocate the frequency bands and BBW be-tween users in each sector, the EXP/PF rule scheduler is employed. (The details of the scheduler were discussed in Section 3). These schedulers distribute the frequency bands by maintaining fairness, HOL delays, and prior-ities between users. Hence, the scheduler optimizes per-user throughput and results in an increase in system throughput.
Thus, the proposed QoS-DFFR scheme reduces co-channel interference and optimizes the sector, per-user, and system throughput by satisfying network loading conditions.
5 Performance evaluation 5.1 Simulation environment
To evaluate the performance of the proposed QoS-DFFR scheme, system-level simulations [29] are performed under the network scenario described in the section that reviewed the system model. The performance is evaluated with a 4 × 4 MIMO antenna configuration, employing a closed-loop spatial multiplexing (CLSM) mode. In addition, instead of full-queue case simulations, the realistic traffic models are considered to assess performance under typical traffic and network loading conditions.
Users with different QoS requirements are randomly distributed with applications according to the percentage
outlined in Table 3 [23]. The simulations are performed while considering the practical simulation parameters listed in Table 1.
5.2 Link-level abstraction
In LTE-A, the user measures the DL received signal qual-ity by using the reference signals and reports to eNB the preferred modulation and coding schemes (MCS). This re-port is signaled using a CQI index. For LTE, 15 different MCSs are defined to keep the BLER below 10%.
To evaluate the BLER of the received TBs, a set of AWGN link performance curves [30] for a 20-MHz BW are considered, as shown in Figure 8a. Then, according to the proper BLER-SINR curve, i.e., depending on the ap-plied MCS, it will be decided whether the packet has been correctly received or not. If the packet is not received cor-rectly, then the packet is considered erroneous and is dis-carded. The SINR-to-BLER mapping requires an effective SINR, i.e., SINReff. SINReffis obtained by mapping the set
0
of subcarriers SINR assigned to users TB to the AWGN-equivalent SINR. We use the MIESM [21] to do averaging, which is described as
SINReff ¼α1⋅I−1
1
N
XN
k¼1
I SINRk
α2
!
; ð35Þ
where the parametersα1andα2adapt to different MCSs
and are calibrated by means of link-level simulations to fit the compression function to the AWGN-BLER results.N
is the number of samples and the functionI(.) is the mu-tual information.
5.3 Simulation results
We compare the performance of the conventional FFR schemes (i.e., reuse-1 and reuse-3) with the proposed QoS-DFFR scheme under the HetNet scenario in terms of the user's average throughput, packet loss rate, inter-ference, and cell-edge and peak throughputs.
5.3.1 UE throughput enhancement by the QoS-based dynamic FFR scheme
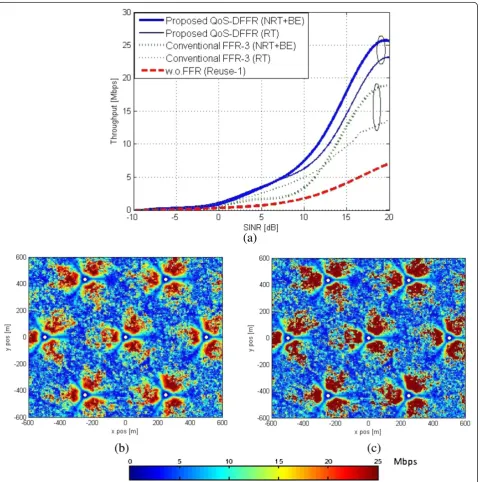
Users with different QoS requirements are dropped in the simulation environment, and the comparison is carried out by considering three different frequency reuse schemes: reuse-1, reuse-3, and the proposed QoS-DFFR scheme. For all of the aforementioned frequency resource configura-tions, we compare the UE average throughput in Figure 9a at a SINR of 15 dB in which reuse-1 shows the worst performance owing to the full reuse of the entire
frequency band. This results in high co-channel interfer-ence between the users. The UE throughput increases for mixed traffic by using reuse-3 because the co-channel interference decreases by partitioning the frequency bands into FR and PR zones. Thus, the throughput reaches 9 Mbps for real-time traffic and 13 Mbps for non-real-time-plus-BE traffic. The real-time flows have low throughput peak values compared to non-real-time-plus-BE flows because real-time users are not always in an active state. However, using the proposed QoS-DFFR scheme, UE throughput increases and shows approximately 40% and 28% throughout improvement compared with the conventional FFR for real-time and non-real-time flows, respectively.
The reason for this improvement is the per-sector cap-acity optimization and user priority consideration for BBW allocation. The effect of allocating the BBW by the pro-posed scheme over the entire HetNet system can be clearly seen in the throughput color map in Figure 9. The map shows high-intensity red areas when the BBW is allocated in (c) as compared to (b). The increase in intensity of the red color indicates that the throughput of the users increased in that region.
5.3.2 Packet loss rate of real-time users
The packet loss rate (PLR) is calculated as the ratio oft packets discarded for not meeting the delay budget to the sum of packets arriving at the eNB station buffer. Thus, PLR is given as
-1000 -90 -80 -70 -60 -50
0.1 0.2 0.3 0.4 0.5 0.6 0.7 0.8 0.9 1
UE Rx Interference [dBm]
CDF
Proposed QoS-DFFR Conventional FFR-3 Reuse-1
PLR¼
where pdiscardi is the discarded packets of user i andK
is the total number of active users in the system. In par-ticular, network performance of non-real-time and BE flows is evaluated by throughput, while for the real-time traffic (i.e., video and VoIP), the PLR is usually used as a metric. The PLR for video and VoIP flows is plotted using a bar chart for different frequency-reuse schemes, as shown in Figure 10. The PLR of video and VoIP flows shows that the proposed QoS-DFFR is able to provide the best QoS owing to less packet loss compared to the conventional schemes. There are two main reasons behind the reduction in PLR: the per-sector capacity optimization by dynamically assigning BBW, and the use of the EXP/PF rule scheduler, which gives priority to users with high HOL packet delay.
From Figure 10, it is clear that in the proposed QoS-DFFR scheme, the PLR for video and VoIP is reduced noticeably from the baseline configuration schemes by approximately 25% and 4.5%, respectively. The above discussion concludes that the proposed QoS-DFFR scheme is highly effective in interference-limited scenar-ios and in QoS-demanding conditions such as a LTE-A scenario.
5.3.3 DL interference reduction by the proposed QoS-DFFR scheme
In a HetNet environment, MUEs near HeNBs suffer from high interference because eNBs and HeNBs are operating on the same frequency bands. By using FFR schemes (i.e., frequency bands), partitioning the interfer-ence is reduced as compared with the reuse-1 scheme. The interference received by MUEs is compared at very low interference range (e.g., between−100 and−90 dBm) for the proposed QoS-DFFR and other conventional schemes.
The results in Figure 11 clearly demonstrate that ap-proximately 50% of users using the proposed QoS-DFFR scheme lie in the specified range of low interference, while for standard schemes, only 20% to 30% of users are in this range. There are two main reasons behind the interference reduction using the proposed QoS-DFFR scheme: 1) FUEs use orthogonal frequency bands as compared to MUEs, and 2) the BBW allocation based on the service priority of users reduces contention in the frequency bands. Hence, by using the proposed QoS-DFFR scheme, the interfer-ence received by MUEs is reduced as compared with the conventional schemes.
Figure 12Throughput comparison. (a)Mean vs. edge
5.3.4 Edge and peak throughput gains
Here, we discuss three key performance indicators (KPIs), which are typically derived from the throughput empirical cumulative distribution function (ecdf ) related to FFR. The KPIs consist of mean throughput, edge throughput, and peak throughput. The terms‘edge’and‘peak’ refer to the 5% and 95% points of the users' throughput ecdf, respectively. These can be interpreted as the perform-ance of a user at the cell edge and cell center, respect-ively. Figure 12a shows that to maintain the same mean throughput (i.e., around 6.3 Mbps for users), the cell-edge throughput of the proposed QoS-DFFR scheme is best because it reaches approximately 6.2 Mbps of cell-edge throughput, while the other conventional schemes reach between 3 and 5 Mbps. Thus, the cell-edge throughput shows twice the improvement as the conventional schemes. The improvement in cell-edge throughput performance is more visible in Figure 12c, where bar charts are plotted at the fixed mean throughput value of 6.3 Mbps compared to the proposed QoS-DFFR scheme performance with the other schemes. In the case of peak throughput, the results are quite different from the case of cell-edge throughput. The peak performance is best for reuse-1 and worst for the conventional FFR-3, while the proposed scheme lies be-tween the two schemes. The proposed QoS-DFFR scheme's peak throughput performance is better than that of the reuse-3 scheme because the former manages the frequency bands dynamically and more efficiently by considering QoS requirements and service priorities of users.
Degradation of peak throughput performance occurs in the reuse-3 case because the frequency bands are par-titioned into FR and PR zones. Hence, there is a trade-off between the peak throughput performance degrad-ation and interference reduction when using the reuse-1 and reuse-3 schemes.
Interference is a more serious problem in the current LTE-A system, which in turn makes this trade-off as a prominent criterion to efficiently operate LTE systems. Therefore, the proposed QoS-DFFR scheme is well suited to improve the cell-edge user's throughput performance, at the cost of a very small peak throughput degradation of the system. On the other hand, this peak throughput deg-radation is balanced by interference reduction achieved by partitioning the frequency resources between the FR and PR zones in the HetNet scenario.
6 Conclusions
FFR is an effective and straightforward scheme for inter-ference management under the HetNet scenario. In this paper, a novel QoS-DFFR scheme was proposed for a two-tier HetNet scenario in LTE-A systems. The proposed QoS-DFFR scheme efficiently allocates the non-occupied FR zone frequency bands, i.e., BBW, to cell-edge users by considering QoS requirements and service priorities of
users. Furthermore, the proposed scheme optimizes the capacity of each PR zone according to dynamic traffic load conditions by allocating BBW to the most demanding and high-priority PR zone. The proposed scheme was vali-dated by system-level simulations. The simulation re-sults showed a remarkable reduction in packet loss rate, i.e., a reduction of approximately 25% and 5% for video and VoIP services, respectively. Moreover, the throughput of cell-edge users almost doubled when compared to that of conventional static frequency allocation schemes such as reuse-1 and reuse-3. Hence, the proposed QoS-DFFR scheme exploits limited spectral resources more efficiently and thus reduces the blocking probability of users. This results in a reduction in packet loss rate and an increase in average throughput, cell-edge users' throughput, and system efficiency of the users in the network.
Competing interests
The authors declare that they have no competing interests.
Acknowledgements
This research was supported by the Industrial Strategic Technology Development Program of MSIP/IITP, Republic of Korea (10044540, Development of small cell base station supporting IMT-Advanced TDD radio technology for evolution of TDD network), and was funded by the MSIP (Ministry of Science, ICT and Future Planning), Korea in the ICT R&D Program 2014. This work was also supported by an Inha University research grant.
Received: 8 January 2014 Accepted: 30 October 2014 Published: 12 November 2014
References
1. Qualcomm Document Center, LTE Advanced: heterogeneous networks, 2011. https://www.qualcomm.com/media/documents/files/lte-heterogeneous-networks.pdf. Accessed 20 Dec 2013
2. R Bendlin, V Chandrasekhar, R Chen, A Ekpenyong, E Onggosanus, From homogeneous to heterogeneous networks: a 3GPP Long Term Evolution rel. 8/9 case study, inProceedings of the 45th Annual Conference on Information Sciences and Systems(Baltimore, MD, 2011), pp. 1–5 3. Qualcomm Document Center, 1000× data challenge: more small cells
taking HetNets to the next level, http://www.qualcomm.com/1000x. Accessed 01 Jan 2014
4. Small Cell Forum Ltd, http://www.smallcellforum.org. Accessed 05 Jan 2014 5. ME Sahin, I Guvenc, MR Jeong, H Arslan, Handling CCI and ICI in OFDMA
femtocell networks through frequency scheduling. IEEE Trans. Consum. Electron.55(4), 1936–1944 (2009)
6. H Li, X Xu, D Hu, X Qu, X Tao, P Zhang, Graph method based clustering strategy for femtocell interference management and spectrum efficiency improvement, inProceedings of the IEEE 6th International Conference on Wireless Communications Networking and Mobile Computing(Chengdu, China, 2010), pp. 1–5
7. Y Yang, L Ling, P Zhao, W Wang, Cognitive adaptive power ratio updating algorithm in soft frequency reuse scheme, inProceedings of the IEEE 78th Vehicular Technology Conference(Las Vegas, USA, 2013), pp. 1–5 8. S Park, W Seo, Y Kim, S Lim, D Hong, Beam subset selection strategy for
interference reduction in two-tier femtocell networks. IEEE Trans. Wireless Commun.9(11), 3440–3449 (2010)
9. 3GPP, R1-106052: per cluster based opportunistic power control, in3GPP TSG RAN WG1 Meeting 63(Jacksonville, FL, USA, 2010)
10. W Pramudito, E Alsusa, Enhancing a hybrid resource management technique for energy and QoS optimization in fractional frequency reuse based cellular networks. IEEE Trans. Commun.61(12), 4948–4960 (2013) 11. L Zhang, L Yang, T Yang, Cognitive interference management for LTE-A
12. M Rahman, H Yanikomeroglu, Enhancing cell-edge performance: a downlink dynamic interference avoidance scheme with inter-cell coordination. IEEE Trans. Wireless Commun.9(4), 1414–1425 (2010)
13. M Assaad, Optimal fractional frequency reuse (FFR) in multicellular OFDMA system, inProceedings of the IEEE 68th Vehicular Technology Conference (Calgary, Canada, 2008), pp. 1–5
14. N Saquib, E Hossain, DI Kim, Fractional frequency reuse for interference management in LTE-advanced HetNets. IEEE Commun. Mag. 20(2), 113–122 (2013)
15. M Taranetz, JC Ikuno, M Rupp, Capacity density optimization by fractional frequency partitioning, inProceedings of the 45th Annual Asilomar
Conference on Signals, Systems, and Computers(Pacific Grove, California, 2011), pp. 1398–1402
16. 3GPP, R4-092042: simulation assumptions and parameters for FDD HeNB RF requirements, in3GPP TSG RAN WG4 Meeting 51(San Francisco, CA, USA, 2009) 17. ETSI 3rd Generation Partnership Project (3GPP),Evolved Universal Terrestrial
Radio Access (E-UTRA); Radio Frequency (RF) System Scenarios (release 8), 3GPP TR 36.942(ETSI, Sophia Antipolis, 2009)
18. H Claussen, Efficient modeling of channel maps with correlated shadow fading in mobile radio systems, inProceedings of the IEEE 16th International Symposium on Personal, Indoor and Mobile Radio Communications (Berlin, Germany, 2005), pp. 512–516
19. L Hentila, P Kyosti, M Kaske, M Narandzic, M Alatossava,MATLAB implementation of the WINNER phase II channel model ver1.1, 2007. http://www.ist-winner.org/phase_2_model.html. Accessed 10 Jan 2014 20. ETSI 3rd Generation Partnership Project (3GPP),Evolved Universal Terrestrial
Radio Access (E-UTRA), Physical Layer Procedures (Release 8), 3GPP TS 36.213 (ETSI, Sophia Antipolis, 2008)
21. F Kaltenberger, I Latif, R Knopp, On scalability, robustness and accuracy of physical layer abstraction for large-scale system-level evaluations of LTE networks, inProceedings of the 47th Annual Asilomar Conference on Signals, Systems, and Computers(Pacific Grove, USA, 2013), pp. 1644–1648 22. X He, K Niu, Z He, J Lin, Link layer abstraction in MIMO-OFDM system,
inProceedings of the International Workshop on Cross Layer Design (Jinan, China, 2007), pp. 41–44
23. 3GPP, R1-070674, LTE physical layer framework for performance verification, in3GPP TSG-RAN Meeting 48(St Louis, MO, USA, 2007)
24. ETSI 3rd Generation Partnership Project (3GPP),Evolved Universal Terrestrial Radio Access (E-UTRA) and Evolved Universal Terrestrial Radio Access Network (E-UTRAN), 3GPP TS 36.300(ETSI, Sophia Antipolis, 2013)
25. ETSI 3rd Generation Partnership Project (3GPP),Group Services and System Aspects, Policy and Charging Control Architecture, TS 23.203 V8.9.0 (ETSI, Sophia Antipolis, 2008)
26. JH Rhee, JM Holtzman, DK Kim, Scheduling of real/non-real time services: adaptive EXP/PF algorithm, inProceedings of the 57th IEEE Semiannual Vehicular Technology Conference(Jeju, Korea, 2003), pp. 462–466 27. JG Choi, S Bahk, Cell-throughput analysis of the proportional fair scheduler
in the single-cell environment. IEEE Trans. Veh. Technol.56(2), 766–778 (2007) 28. TH Kim, TJ Lee, Throughput enhancement of macro and femto networks by
frequency reuse and pilot sensing, inProceedings of the IEEE Performance, Computing and Communications Conference(Austin, TX, USA, 2008), pp. 390–394
29. C Mehlfuhrer, JC Ikuno, M Simko, S Schwarz, M Wrulich, M Rupp, The Vienna LTE simulators–enabling reproducibility in wireless communications research. EURASIP J. Adv. Signal. Process.2011, 29 (2011)
30. M Wrulich, JC Ikuno, D Bosanska, M Rupp, Simulating the long term evolution physical layer, inProceedings of the European Signal Processing Conference (EUSIPCO)(Glasgow, Scotland, 2009), pp. 1472–1478
doi:10.1186/1687-1499-2014-185
Cite this article as:Kaleemet al.:QoS priority-based dynamic frequency band allocation algorithm for load balancing and interference avoidance in 3GPP LTE HetNet.EURASIP Journal on Wireless Communications and Networking20142014:185.
Submit your manuscript to a
journal and benefi t from:
7Convenient online submission
7Rigorous peer review
7Immediate publication on acceptance
7Open access: articles freely available online
7High visibility within the fi eld
7Retaining the copyright to your article