Journal of Chemical and Pharmaceutical Research, 2014, 6(3):1002-1007
Research Article
ISSN : 0975-7384
CODEN(USA) : JCPRC5
Python in ChIP-Seq data analysis
Li Zhang, Yuansen Hu, Jinshui Wang and Guangle Zhang*
College of Biological Engineering, Henan University of Technology, Zhengzhou, Henan,
People’s Republic of China
_____________________________________________________________________________________________
ABSTRACT
Python is an interpreted programming language that is simple, clear and powerful. To many scientists in life sciences, Python has become their favorite choice to perform routine work, such as text processing, image plotting, basic statistics, GUI programming and even prototype development. In order to introduce Python to more scientists, here, we present some Python experiences and examples in Illumina ChIP-Seq data analysis. Five in-house Python scripts were written to illustrate the simplicity and clarity of Python usages in data analysis and results presentation: Illumina Q30 analysis, reads distribution around TSS, reads intensity plot, reads distribution along chromosomes and sequence retrieval from genome FASTA files. Finally, we show three programs written in Python for ChIP-Seq data analysis: MACS, SICER and CEAS.
Keywords: Python;ChIP-Seq;bioinformatics
Availability: Source codes are freely available at http://code.google.com/chipseq.
_____________________________________________________________________________________________
INTRODUCTION
With life sciences becoming data-intensive, especially the completion of human genome project and the availability of next generation sequencing, many scientists in life sciences are now learning program languages and using them in their daily work. With different languages, such as C, C++, Java, Perl, Python, Ruby and so many more, lab scientists face a problem choosing the most suitable one for their work, since each language has its own advantages and disadvantages. However, as non-programmer scientists, we do not have much time to master a sophisticated language. We simply want to deal with our data and clearly demonstrate our results. Therefore, script languages are preferred over low level compiled languages. Here, we recommend Python to life scientists as it’s simple, clear and powerful.
Python was designed by Guide van Rossom in late 1989 [1]. Generally, Python is recognized as glue language, meaning it can easily ‘glue’ pieces of programs written in other (or its own) languages. Python is famous for its clarity and simplicity in programming compared to other programming languages.
Rpy
Rpy is a robust Python interface for R -- a programming language with powerful statistical analyses capability. Rpy can manage all kinds of R objects and execute arbitrary R functions (including graphic functions). Any module installed for R can be called from Rpy with Python[5]. This package combines the powerful statistical ability in R and the simple and agile prototype development in Python. rpy is available at: http://rpy.sourceforge.net/.
Scipy
Scipy is similar to Numpy, but contains more scientific calculation functions, such as optimal analysis, statistics and others [6]. Scipy is often used in statistical analysis, from the basic t-test to the more sophisticated Possion model. Scipy is available at: http://www.scipy.org/
MySQLdb
MySQLdb is a package that was designed to programmatically access data stored in biological database systems[7]. With MySQLdb, scientists can easily retrieve data from a remote database and manipulate data stored in local MySQL databases. MySQLdb is available at: http://sourceforge.net/projects/mysql-python/
More and more packages related to life sciences are under development, for a list of these packages, please visit: http://www.python.org for details.
3 Python for ChIP-Seq data analysis
With the advent of next generation sequencing, more and more data is being generated every day[8]. In this section, we will give the users five examples written in Python for analysing Illumina Solexa ChIP-Seq data.
A. Illumina Q30 Quality Control analysis.
Illumina Solexa sequence platform generates millions of reads in a single run. After image analysis, base calling and low quality reads filtered by CASAVA (Python is also used in this software), FASTQ format files were generated which contain the identified sequences and corresponding quality values[7]. The quality values are similar to Phred values. Q30 is a kind of control value for base calling, meaning the base was called correctly 1 out of 1000 probability[8]. At this stage, we will calculate the Q30 distribution among every base position using Q30.py script.
The input files are FASTQ format files with every 4th line being a quality value line. We first used Python to change every ASCII character into numbers then minus 64 for Solexa 1.5. In Python, it was written as:
[ord(i)-64 for i in line.strip()]
Fig 1. Q30 distribution of Illumina quality values X-axis represents the reads position, and Y-axis represents the quality
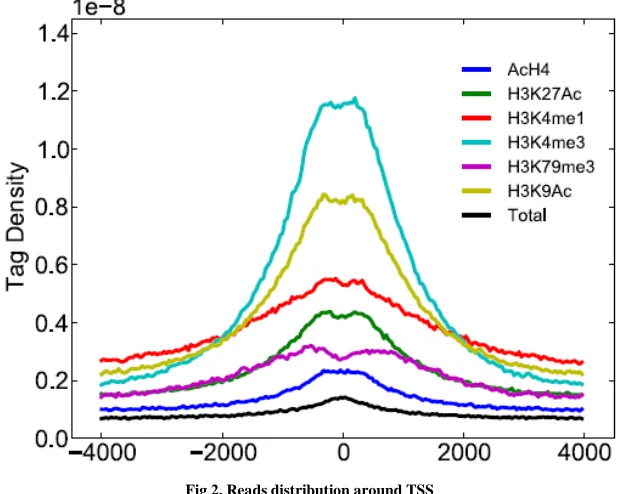
B. Reads distribution around TSS
After base calling and mapping to reference genome, reads with certain positions were generated. Generally for transcript factors, they are always binding to the TSS. So in this stage, we used Python to draw a read density plot around TSS.
As shown in the reads_around_TSS.py script, we recognized the middle position of an extended read (extended to its 5’ direction) as the read. After the position of all reads (in one chromosome) were calculated, sort function was used to rank these reads. Then Python module insect was imported to calculate the reads counts between two positions (here 40 bp bins were used to plot the read counts against the [TSS-2000bp, TSS+2000bp) using:
Start = insect.leftinsect(start, sorted_reads_position) End = insect.leftinsect(end, sorted_reads_position) Reads counts in regions = end – start
Fig 2. Reads distribution around TSS
[image:3.595.143.454.473.720.2]Fig 3. Reads intensity around SPI1 gene X-axis represents the genomic positions
Y-axis represents the number of reads (1kb transformed). Upper plot is control sample and lower plot is treat sample. The yellow lines are TSS and TES positions. The left arrow shows the direction of transcription.
D. Sequence retrieval from genomic FASTA files
After peak detection, some peaks were generated which represent the protein binding sites. Then we needed the sequence information of all these genomic positions to perform various analyses, such as motif discovery[10]. In this stage, we wrote a script retrieve_seq.py to retrieve FASTA sequence files from genomic FASTA files.
The main method is to use seek function in Python. Seek function seeks a certain position of a file and moves between different positions to retrieve the content between the two positions. We used line-based method rather than character-based method to retrieve sequences. This greatly reduced the retrieval time. It runs much faster and can retrieve more than 10000 sequences from genomic FASTA files per minute.
The input file is a genomic regions bed format file[11], and the path of a directory that contains all the sequence files for each chromosome in FASTA format[12].
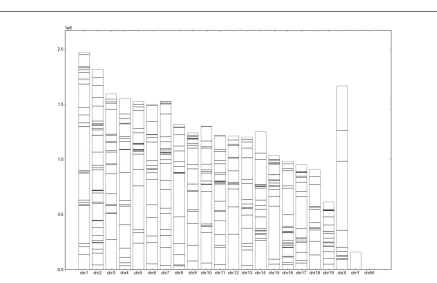
E. Genomic distribution along genome
Fig 4. The distribution of regions along genome
The bars represent the chromosomes and the horizontal lines represent the genomic regions. X-axis represents chromosomes and Y-axis represents positions in each chromosome.
Five Python code snippets are illustrated for ChIP-Seq data analyses. These samples are available for free at: http://code.google.com/chipseq.They can be easily integrated into your own programs as modules.
4 Three ChIP-Seq data analysis software written in Python
There are several ChIP-Seq data analysis tools written in Python. They are easy to use and powerful. We suggest three of them in this section.
MACS
MACS (model-based ChIP-Seq analysis) is a command-line ChIP-Seq peak detection software written in Python by X. Shirley Liu and her colleagues[13]. It can be used to identify transcription factor binding sites. This software supports many input format files, such as bed and sam formats. Users could write a Python script to execute this software and get statistical features of the detected peaks. For advanced users, the source code is open for modifications. The software is available at: http://liulab.dfci.harvard.edu/MACS/
SICER
SICER is a clustering approach for identification of enriched domains from histone modification ChIP-Seq data[14]. It pools enrichment information from neighboring nucleosomes to increase sensitivity and specificity, thus being widely used in histone modification profile analysis. It was designed by Chongzhi Zang and his colleagues. The tool is available at: http://home.gwu.edu/~wpeng/Software.htm
CEAS
[3]http://numpy.scipy.org/
[4]Matplotlib: A 2D Graphics Environment [10.1109/MCSE.2007.55] [5]Gautier, L. BMC Bioinformatics 11 Suppl 12: S11.
[6]http://www.scipy.org/
[7]http://sourceforge.net/projects/mysql-python/
[8]Cock, P. J., C. J. Fields, et al. Nucleic Acids Res 38(6): 1767-71. [9]http://www.bioinformatics.bbsrc.ac.uk/projects/fastqc/
[10]“The value of prior knowledge in discovering motifs in MEME” Timothy L. Bailey and Charles Elkan In Proceedings of the Third International Conference on Interlligent Systems for Molecula Biology, pages 21-29, Menlo Park, CA, 1995. AAAI Press.
[11]“ChromoScan:A Scan Statistic Application for Identifying Chromosomal Regions in Genomic Studies” Yan V.Sun,Douglas M.Jacobsen and Sharon L.R.Kardia Bioinformatics Advance Access published October 10,2006 [12]Bradley.Arshinoff,Garret Suen,et al Nucleic Acids Research,2007,Vol.35
[13]Zhang, Yong; Liu, Tao; et al. Genome Biol. 2008;9(9):R137. Epub 2008 Sep 17. [14]Zang, C., D. E. Schones, et al. (2009). Bioinformatics 25(15): 1952-8.