Terrestrial Laser Scanning in Building Documentation
Aikaterini Karagianni
Laboratory of Photogrammetry-Remote Sensing, School of Civil Engineering, Faculty of Engineering, Aristotle University of Thessaloniki, Greece
Copyright©2017 by authors, all rights reserved. Authors agree that this article remains permanently open access under the terms of the Creative Commons Attribution License 4.0 International License
Abstract
During the last decades, documentation of buildings has proven to be a valuable tool for a variety of civil engineering issues, such as urban planning, preservation and restoration of cultural heritage buildings, as well as monitoring during the construction phase. Several techniques have been developed for this purpose including topographic, photogrammetric and ground-based remote sensing techniques or a combination of them. The increasing interest in the generation of 3D facade models for documentation of built environment has made laser scanning a valuable tool for 3D data collection. Regarding civil engineering, terrestrial laser scanning could be considered an efficient method for digitizing buildings facades, generating dense 3D point clouds available for further processing. This paper presents the study of a mansion house of cultural significance built in the middle of the 18th century, using terrestrial laser scanning techniques for facade documentation. Scanning process included multiple external scans of the main facade of the building which were registered using artificial targets and appropriate software to form a single colored 3D model. Further process resulted in a model that offers measurement possibilities valuable to future plans and designs for preservation and restoration. High resolution satellite data were also used to gain detailed information about the physiognomy of building’s surrounding area.Keywords
Terrestrial Laser Scanning, Civil Engineering, Buildings, Facades, Remote Sensing, Cultural Heritage1. Introduction
Technological developments in the field of information acquisition have led to the progress of various techniques. Terrestrial Laser Scanning (TLS) techniques may be effective in several civil engineering issues such as studies of structures (buildings, bridges, dams, tunnels) and deformation studies, natural hazard studies (landslides, earthquakes) and cultural heritage [1-4].
Particularly during the last decades, documentation of buildings has proven to be a valuable tool for a variety of civil engineering issues including: protection and preservation, restoration and conservation, monitoring and management, identification and interpretation of buildings, sites and cultural landscapes [5].
Several techniques have been developed for building documentation [6-8]. In general, remote sensing techniques may contribute in monitoring and interpretation of the site. Other conventional techniques such as topographic surveys and measurements, photogrammetric methodologies or even their combination, are also used in structural monitoring [8]. Regarding 3D data collection for documentation of built environment, terrestrial laser scanners face an increasingly wider use due to the speed of acquiring high density data and the automated processing offering high accuracy [9-11].
In civil engineering domain, TLS could be considered an efficient method for digitizing large objects and entire scenes (three-dimensional spatial information) following three main steps: data acquisition, data process and data visualization [12]. These systems can accurately reconstruct scanned buildings, generating millions of 3D points (3D point clouds) and provide higher resolution and accuracy on building facades and low sloped roofs [13]. Each point has location coordinates in space and color information and it is placed into a local coordinate system forming a 3D point cloud that represents the building being scanned [8].
Scanning process includes inclination of laser pulses changed by a reflecting mirror, reflection of laser pulses on the surface of objects and reception of reflecting laser signals leading to an effect. Through this process dense 3D coordinate information is acquired effectively and precisely over the entire surfaces [1]. The generated point cloud can be imported in several software programs for further processing as it carries highly detailed spatial information about the surveyed building.
scans which were registered using artificial targets and appropriate software to form a single contiguous 3D model. Further process resulted in a model that offers measurement possibilities valuable to future plans and designs for preservation and restoration. High resolution satellite imagery was also used to gain detailed information about the physiognomy of building’s surrounding area.
2. Tsiatsiapa Mansion Case Study
The mansion House of Tsiatsiapa is the oldest mansion of Kastoria and is situated along the coastal road of the north side of the city, in the traditional district of Apozari (Figure 1). The mansion is a brilliant example of urban architecture of the 18th century, which reflects the financial strength of the traders’ caste which flourished due to the social and economic conditions prevailing at the time [14].
[image:2.595.313.551.287.482.2]It is the only three-story grand mansion in the city of Kastoria with a rectangular ground plan moving on a horizontal axis. The interiors are richly decorated, although in some places have suffered irreparable damage. The building opened its door to the public as a visiting monument on 30 June 2017 after restoration/maintenance works by the Ephorate of Antiquities of Kastoria [14].
Figure 1. Tsiatsiapa Mansion and small yard house
3. Materials and Methods
To extract information regarding the building’s facades, high resolution satellite data and a terrestrial laser scanner were used. The satellite image was used to locate the building and interpret the physiognomy of its surrounding area while the terrestrial laser scanner was used to obtain 3D colored point clouds to give a realistic impression of the structure and provide the ability to create highly detailed plans and designs.
3.1. Satellite Data
To get detailed information about the city of Kastoria and the area where the mansion House of Tsiatsiapa is located high resolution Quickbird satellite imagery was used (Figures 2 and 3).
Quickbird satellite was launched on October 18 of 2001. The sensor has 4 multispectral bands with resolutions of 2.44m at nadir: Band 1 - Blue (0.450-0.520 µm), Band 2 - Green (0.520-0.600 µm), Band 3 - Red (0.630-0.690 µm), Band 4 – Near Infrared (0.760-0.900 µm) [15].
For this study a multispectral Quickbird image was used that was acquired from DigitalGlobe on 2010-07-29. It is standard ortho-ready Level-2A (radiometrically and geometrically corrected) product. Its projection information is: UTM, zone 34, spheroid& datum WGS 84, and it is cloud-free.
Figure 2. Subset ofQuickbird image demonstrating the main part of the city of Kastoria and position of Tsiatsiapa Mansion (yellow square) in the smaller subset image (red square)
[image:2.595.58.297.387.579.2] [image:2.595.313.551.530.722.2]The building is located in the north side of the city (traditional district of Apozari) near the lake of Kastoria. The main entrance is in the north and faces the main road. Further digital processing of the image offered an easier interpretation. Erdas Imagine software was used to enhance the original image applying tasseled cap and decorrelation stretch algorithms (Figures 4 and 5). Tasseled cap computes derivative layers which represent scene brightness, greenness and wetness, while decorrelation stretch performs a contrast stretch on the imagery to decorrelate the bands and produce a more “contrasty” and strongly colored output image using the Principal Components transformation [16].
Figure 4. Subset after tasseled cap transformation
Figure 5. Subset after decorrelation stretch transformation
As it is evident from the enhanced satellite images, the mansion has a rectangular ground plan and is framed by newer buildings (their roofs appear in more intense shades of red or light green respectively). Additionally, changes in the yard of the mansion are detected (presence of thicker vegetation and trees in 2010-small yard house is not visible).
3.2. Terrestrial Laser Scanner Data
As already mentioned in the introduction, terrestrial (ground-based) 3D laser scanner is a recently developed instrument that uses advanced laser measurement technology capable of obtaining thousands of point measurements per second. It is an active device emitting its own radiation. The result of the scanning process is a dense point cloud laying on the surface of the scanning object.
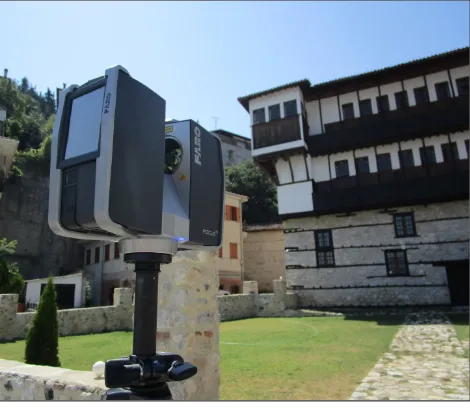
In this study FARO Focus 3D S120 phase-based laser scanner was used and it was provided by the Lab. of Photogrammetry-Remote Sensing of the School of Civil Engineering in AUTH (Figure 6). The Focus 3D is a high-speed 3D laser scanner for detailed measurement and documentation. It is an autonomous portable system able to acquire 3D point clouds of objects, producing an invisible laser beam with a wavelength of 905nm. The system uses class 3R laser and constructor recommendation is to avoid direct eye exposure. Its range focus is between 0.60 m - 120 m, vertical field of view 305o and horizontal 360o. It is characterized by a high measuring speed at a maximum of 976.000 measuring points per second and has distance accuracy up to ±2mm. The scanner is equipped with an internal color camera giving the ability to produce photorealistic 3D color scans (color overlay). The captured point clouds and images are saved on the inserted SD memory card and thus can be easily transferred to a PC [14].
Figure 6. FARO Laser Scanner
[image:3.595.315.550.420.624.2] [image:3.595.59.295.459.655.2]A total number of four external scans were acquired in order to create the cloud of the main building facade. The scans were acquired consecutively and continuously in order to achieve the same external lighting conditions. The duration of each scan was approximately 8 minutes (expected scan time is according to the chosen resolution, quality value and scan range).
In order to extract distinct points, artificial targets can be placed in the scene (spheres of a bright material, cylinders of retro-reflective material, flat targets with two black and two white rectangular fields or with circles with good contrast) [9].
[image:4.595.312.552.78.320.2]To ensure in our study that the system generates reference points and registers signal contacts, five reference spheres were placed in the scene around the scanner (including at the full horizontal and vertical scan-range points) as well at different heights (including high and low) and were completely visible in all scans (Figure 7).
Figure 7. Reference spheres
4. Results
Data processing for point cloud visualization was done using SCENE and Pointools Edit software. A unified point cloud was achieved using the control points whose coordinates guide the registration of the adjacent four point clouds. The transformation of raw point clouds into a unified coordinate system uses scanned targets in a local coordinate system to solve the transformation parameters. After registration of the scans using corresponding points, the software constructs a non-redundant surface representation, where each part of the measured object is only described once.
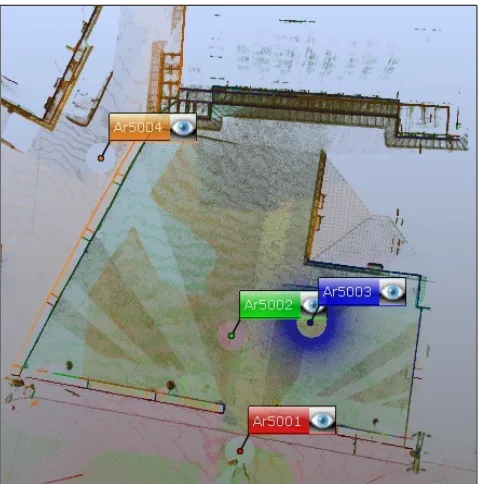
The position of the scanner in all four scans is presented in Figure 8. The scanned building in 3D along with its surrounding landscape is presented in Figure 9, while Table 1 contains the Scan Point Statistics and Figure 10 shows the thresholds for point error and overlap according to SCENE software manual [18]. Point error values and overlap value in this study are within the accepted thresholds.
Figure 8. Position of the four scans
Figure 9. Scanned mansion in 3D and surrounding landscape
Table 1. Scan Point Statistics Maximum Point Error 5.5 mm
[image:4.595.58.296.305.409.2] [image:4.595.313.550.360.533.2]Figure 10. Thresholds for point error and overlap in SCENE software
[image:5.595.100.259.78.133.2] [image:5.595.58.297.205.396.2]The main facade of Tsiatsiapa Mansion is presented in Figure 11 and Table 2 contains image’s details derived from Pointools Edit software.
[image:5.595.61.297.451.535.2]Figure 11. Tsiatsiapa Mansion facade
Table 2. Details of facade image of Tsiatsiapa Mansion Image Size 33.6099m x 17.7703m Image Scale 27.968 pixels per metre Camera at -8.63384, 53.7936, 5.98276
Direction 0.0956721, -0.995413, -2.11927e-008
The generated model can be used for measuring distances and angles by clicking onto distinct points. Employing facade's ortho-projection, measurements of basic elements can be done directly onto the image. For example the total height of the building is approximately 13,56 m and its width is approximately 19,54 m. The dimensions of a typical window at the second or the third floor are 1,08 m x 0,88 m.
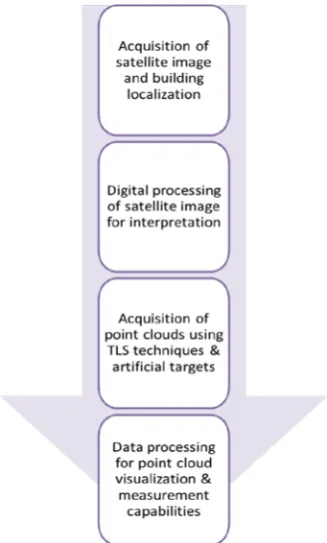
The measurement capabilities of the building, in combination with the detection and monitoring capabilities offered by enhanced satellite images of the area could provide useful information in mansion’s restoration and preservation in the future. The flowchart in Figure 12 summarizes the general procedure, from acquiring the satellite data to the final documentation.
Figure 12. Flowchart of the overall study
5. Discussion-Conclusions
Technological developments in the field of information acquisition have offered useful tools in civil engineering domain. TLS techniques have proven to be effective in structure documentation, structural deformation studies, natural hazard studies and cultural heritage.
Particularly, building documentation may offer valuable information in a variety of civil engineering issues (urban planning, reconstruction, monitoring, preservation and restoration of cultural heritage buildings).
New digital technologies, developed in recent years can provide fast and accurate documentation using innovative techniques compared to conventional survey techniques. Laser scanning over the last decade has fast become the leading technology for 3D documentation and measurement of space and structures due to acquisition of dense data sampling with high accuracy, high speed and flexibility in 3D digital data format. TLS technique, as a non-invasive surveying technique, can allow continuous monitoring without coming into physical contact with the interested object (especially useful in unreachable places).
In this paper the study of a mansion house of cultural significance using TLS techniques for facade documentation is presented. The 3D point clouds of the main facade generated with FARO Focus 3D laser were connected to each other through the overlapping areas acquired from several different station points, using software that performs point cloud registration.
Additional satellite data were used to understand the physiognomy of the building’s environment. For easier interpretation of the image further digital processing was applied. The spectral enhancement techniques that were considered effective for this study were tasseled cap and decorrelation stretch.
Using satellite images to locate the building and interpret its surrounding area could offer complementary but necessary information to the overall study. The constantly evolving technologies in Earth observation (new satellites-sensors with various capabilities, high spatial resolution imagery, policy of free data, etc.) provide continuous information on the field of interest, enabling the monitoring of changes in the surrounding area of the building being studied. Specifically in the case of cultural heritage buildings and the constraints related to the preservation of their physiognomy, exploiting satellite data for their study can provide useful information on this subject through the continuous remote monitoring. Additionally, satellite data along with TLS techniques can contribute in building extraction and 3D city modeling.
The point clouds acquired contained only geometric information (X, Y, Z) and the reflectivity of the surface. To get information about the color of the surface and link it to the points, a series of images were captured after laser scanning through the built in digital camera of the laser. The resulted point cloud offered the ability of effective and dense measurement of surface geometry, but the number of applications is not limited to this. The scanned data, if additional scans be generated to include the entire building, can also be used for GIS or spatial statistical analysis, Building Information Modeling, etc. Furthermore, the scanned object can be presented in a navigable 3D mode making the observation and interpretation of the building easier or generating a navigable model (virtual building visualization) that could be used for virtual tourism purposes.
Along with the advantages of this method of documentation however, some restrictions and obstacles may appear, such as: difficulties in obtaining all the perimetrical facades of a building due to other buildings or obstacles, errors due to incorrect artificial target placement and poor registration (most targets at the horizon or down low), unsuitability of TLS techniques for documentation extraction of buildings with high or sloped roofs, missing information for areas that could not be scanned from any station point.
As is evident in Figure 11, in the specific study there is luck of documentation regarding the area behind the small
auxiliary house in the courtyard and the areas behind the wooden railings on the balconies. This occurs due to insufficient acquisition of data during the scanning process (the specific areas were not included in any of the four scans). One possible solution would be to increase the number of scans or/and select scan positions inside the building. Regarding difficulties in scanning procedure that appear due to existing buildings or obstacles in close proximity to the scanned building, these could be overcome using a combination of traditional terrestrial techniques and structure-from-motion (SFM) photogrammetry.
In conclusion, Terrestrial Laser Scanning could be considered an efficient data collecting tool towards the recording of structures and sites for heritage preservation purposes, scientific research and built environment applications, tending to become a dominant approach for the generation of 3D building documentation.
Acknowledgements
The author wishes to thank Ephorate of Antiquities of Kastoria for providing permission to acquire the necessary data. The author wishes also to acknowledge the support of the surveying engineer Andreas Sidiropoulos for his valuable help in data collection.
REFERENCES
[1] H. Yang, X. Xu, and I. Neumann, The Benefit of 3D Laser Scanning Technology in the Generation and Calibration of FEM Models for Health Assessment of Concrete Structures, Sensors 2014, Vol. 14, 21889–21904, 2014.
[2] J. Valença, I. Puente, E. Júlio, H. González-Jorge and P. Arias-Sánchez. Assessment of cracks on concrete bridges using image processing supported by laser scanning survey, Construction and Building Materials, Vol. 146, 668–678, 2017.
[3] W. Wang, W. Zhao, L. Huang, V. Vimarlund and Z. Wang, Applications of terrestrial laser scanning for tunnels: a review, Journal of Traffic and Transportation Engineering (English Ed.), Vol. 1, No. 5, 325–337, 2014.
[4] G. Bitelli, M. Dubbini and A. Zanutta, Terrestrial laser scanning and digital photogrammetry techniques to monitor landslide bodies, XXth ISPRS Congress: Proceedings of Commission V, 246–251, 2004.
[5] N.A. Haddad. From ground surveying to 3D laser scanner : A review of techniques used for spatial documentation of historic sites, Journal of King Saud University–Engineering Sciences, Vol. 23, No. 2, 109-118, 2011.
[6] Y. Alshawabkeh. Integration of Laser Scanning and Photogrammetry for Heritage Documentation, PhD Thesis, Institute of Photogrammetry, University of Stuttgart, 2006.
Integrating radar and laser-based remote sensing techniques for monitoring structural deformation of archaeological monuments, Journal of Archaeological Science, Vol. 40, No. 1, 176–189, 2013.
[8] E. Tournas, M. Tsakiri and I. Efessiou. The use of Terrestrial Laser Scanning in the renovation of historic buildings, TEE Digital Library, 1–13, Online available from http://library.tee.gr/digital/m2616/m2616_tournas.pdf
[9] N. Pfeifer, C. Briese. Laser Scanning-Principles and Applications. 3rd International Exhibition and Scientific Congress Geo-Siberia, Novosibirsk, Russia, 25–27, 2007.
[10]Y. Arayici. An approach for real world data modelling with the 3D terrestrial laser scanner for built environment, Automation in Construction , Vol. 16, 816–829, 2007.
[11]M. Sgrenzaroli. Cultural Heritage 3D Reconstruction Using High Resolution Laser Scanner: New Frontiers Data Processing, CIPA 2005 XX International Symposium, Torino, Italy, 2005.
[12]R. Staiger. Terrestrial Laser Scanning Technology, Systems
and Applications, 2nd FIG Regional Conference Marrakech, Morocco, Vol. 1, pp. 1–10, 2003.
[13]S. Pu. Generating building outlines from terrestrial laser scanning, International Archives of Photogrammetry, Remote Sensing and Spatial Information Sciences, Vol.37 (PartB5), 451–456, 2008.
[14]Information about Tsiatsiapa Mansion, Ephorate of Antiquities of Kastoria Documentation and Online available: http://www.macedonian-heritage.gr/HellenicMacedonia/en/C 3.4.1.1.html
[15]Quickbird Information, Online available from
http://www.digitalglobe.com/about-us/content-collection#qui ckbird
[16]ERDAS Field Guide™, Intergraph Corporation, Erdas Inc. U.S.A, 2013, 445-446.
[17]Faro Laser Scanner Focus3D User Manual, FARO
Technologies Inc., 2013.