2016 3rd International Conference on Information and Communication Technology for Education (ICTE 2016) ISBN: 978-1-60595-372-4
1 GENERAL INSTRUCTIONS
To improve the economic efficiency of the power plant, power plant units should be maintained in the best condition to run. However, in the actual power production process, there are some situations, such as operation of the plant management level uneven, unit features of the operating personnel is not sufficient to grasp, run unreasonable power plant units, changing external environment of power station, various problems of their own respective electric power plant equipment, and generator set during operation in the actual existence of issues. These issues can be include in three aspect, like multiple types of coal, big changes in coal quality and the wide range of load change unit because of the peak shaving. All the reasons ultimately will make the above reasons cannot be run in real-time power plant units has been maintained in efficient operation status [1,2].
To show the operating efficiency of the power plant units, boiler efficiency is used to define as the main parameter characterizing. Boiler efficiency is decided by combustion characteristics of coal,
external load bearing plants, the ambient
temperature, amount of oxygen in the exhaust, the exhaust gas temperature and other parameters joint decision [3].The parameters such as the oxygen
content of smoke and the temperature of exhaust gas are controllable, which are also called the internal constraints of the unit; and the unit carried by external load, the external environment temperature and coal quality characteristics are uncontrollable, these can be called the crew external constraint working conditions. In the actual production process, the external operating conditions of unit are often or always largely variable. It causes the different boiler efficiency under different external operation conditions. Therefore, it is significant to study unit operation optimal external constraint condition. Furthermore, it can provide the necessary conditions for further improving the efficiency of mining unit adjustable parameters operating range.
The traditional external conditions mainly include the load of the unit, the temperature of the external environment and the characteristics of the coal quality [4].The unit load usually adopts typical load point, namely 50%, 60%, 70%, 80, 90%, 100%load as the running parameters. However, today’s unit load is no longer adopting typical load point. Due to running environmental constraints and AGC constraints change situation, the typical load in addition to thermal testing and design operating condition may maintain or reproduce some conditions almost no repetition. So the classification method of typical load point of the traditional
Plant Operation Working Condition of the Optimal Combination of
External Research Division
Qiuping Wang, Zhiqiang Chen, Xiaoyu Bai, Hao Wei, Pingzhong Shen
School of Automation Engineering, Northeast Dianli University, Jilin 132012, P.R. China
ABSTRACT: On the basis of problems which is based on external power station power plant operating conditions partitioning historical operational data analysis, it points out the key of data mining results will depend on the adaptability of the data mining algorithms. To solve the above problems, the new k-mean algorithms and equal width method which are suitable for power plant historical operating data divided external conditions are proposed. First of all, two methods are study. One is calculation method combines statistical theory of k-means clustering algorithm for the initial number of cluster centers. And another is the equal width method determination of the number of clusters and the interval size. Secondly, new K-means algorithm is to apply the history running data of the power stations in order to mine the unit load, the external condition of coal quality characteristics. Meaning while, the way to mine the external environmental temperature condition is the proposed method of equal width. Finally, to provide data for the reference site operating personnel, by combining obtain the optimal combination of external operating conditions described unit operation.
classification method isn’t suitable to analyze optimal external operating conditions of unit. Meaning while, there is no specific determining parameters for the coal quality characteristics in the actual production of the power plant. The reason is that coal quality of boiler combustion is far away from the designed coal quality. Also, ambient temperature is usually divided by equal width method since the ambient temperature is generally uniform changes with the seasons and time [5].However, due to different geographical location of different ambient temperature, there are no established uniform ambient temperature parameters. On the other hand, a large number of unit operation data which is stored in SIS real-time/historical database contains a wealth of laws governing the operation of the unit. It has been an effective way to mine optimization operation status from unit historical operating data by clustering algorithm. And it is a hot research topic in power plant operation optimization based on data mining [6].
K-means algorithm has become atypical
clustering algorithm because it has the advantages of simple calculation process, high efficiency and good scalability characteristics[7]. But the traditional K-means clustering accuracy depends on the initial cluster centers and selection of cluster number especially when it comes to determine the power optimal external operating problems. If using the conventional initial cluster centers and the number of clusters randomly selected method, it will result in slow operation, irrational clustering, and so on, due to the historical data of unit operation with large amount of data, strong interference, multi type and strong correlation characteristics. Equal width method is one of the most simple and effective method for uniform data clustering. Because the interval number and interval size directly determine rationality of clustering results. In the application of the optimal external operating conditions of the power station, direct selection method based on geographical position and the results cannot be a
reasonable characterization of the operating
conditions. Therefore, the key of the effective data mining results of the optimal operating conditions of power station depends on the adaptability of the mining algorithm to the data.
In view of the above problems, first and foremost, this paper studies on the correct method to solve two issues. One is to calculate the initial cluster centers and cluster number of K-means. Another is to determine the number of clustering interval and the size of the interval. Secondly, the method is applied to determine the combination conditions of external constraint operating conditions to achieve the purpose which is detailed cluster of full range operating conditions of the power station. Meaning while, the independent external operation condition from historical working data recording is mined.
Finally, the practical example shows the cluster accuracy and the mining speed can be significantly improved by the new method.
2 TO DETERMINE THE INITIAL CLUSTER
CENTERS AND THE NUMBER OF
CLUSTERS IN THE K-MEANS ALGORITHM
The traditional K-means algorithm is the method
that it determined the target function E of the
smallest K class data based on the random selection of the cluster number and the initial cluster center. The usual objective function E is the squared error criterion function:
2 1 1
= i
n k
j j i j
E x m
= = −
∑∑
(1)
The above equation, xi is the data record and is mi
cluster centers between different classes. So the
initial cluster centers mi and the number of cluster k
direct affection the results and the process of clustering.
2.1 Effect of k and mi that solve in optimal external operating conditions on clustering results
The determine substance of the optimal operating conditions of the power station is to divide a working parameter into several different working
conditions. If k is too small in mining, then the
scope of each working interval is relatively large, and it is easy to lead to the best working range too large in mining that it makes no significance of guiding the operation of power station. Or it leads to the failure in mining of no minimum support and minimum feasible working conditions in mining
results. Conversely, k is too large, and then it will
due to the careful division of the operating intervals of each parameter, so that the dimension of the parameter increases, the mining process is increased of the data in the middle, resulting in a reduction in the rate of mining. If it not sure the initial cluster center which is the most consistent with the recorded data of the power station , then since the increase of iteration number of clustering algorithm makes the mining speed reduced.
2.2 Determination the k of optimal clustering number
The essence of K-means cluster is to calculate the distance between the data and the cluster center, and after several iterations ,then the smallest data of the square error function is the same data which the data in the same kind has the biggest similarity. So the k of the optimal clustering number indicates that the data distribution in the same kind is centralized. And it has the biggest similarity. The data distribution of
optimal clustering number can be determined according to the similarity degree between the class data. In order to evaluate the similarity degree of the class data, the ratio between the similarity of the same kind and the dissimilarity of different classes is used as the evaluation criterion. For a given data set
T={xi|i=1,2,…t;xi∈Rn},The evaluation criterion
function for the optimal number of clusters is
( )
(
)
(
)
2 1
2 1
1, 1 nj
ij j k
i k nl j
hl j l l j h
x m
G k
x m
=
=
= ≠ = − =
−
∑
∑
∑ ∑
(2)
Type: K is the number of clusters, mi is the data
center of the j category, xij is the data which is
arrayed the i of the j category .nj is the number of
internal data of the j category. xij is the data which is
arrayed the h of the l category nl is the number of
internal data of the l category. Member indicate the
data which is a certain class to such a certain class central square that the dissimilarity of different kinds of data. The ratio of the numerator and denominator indicates the specific quantitative value which is the close degree of similar data and the degree of dispersion between different classes of data. The smaller the ratio indicates the more centralized data within the same class and the more dispersed the data between different classes. The
optimal value of k is given in the initial cluster
number and the initial cluster center and it can be
through iterative calculation the minimum G(k)
value determined.
For data sets T={xi|i=1,2,…t;xi∈Rn}.The specific
iterative steps of the optimal value k are as follows: 1) Selected initial value k=N;
2) Point at T that the data set and clustering,
identify various types of cluster centers mj,j=1,2,…k
and various types of data xij, j=1,2,…k;i=1,2,…nj.
3) The value which is G1(k) calculated by the
formula (2).
4) k=k+1,clustering the data set T and clustering ,identify various types of cluster centers mj,j=1,2,…k and various types of data xij, j=1,2,…k; i=1,2,…nj, and the value which is G2(k) calculated
by the formula (2).
5) If G1(k)>G2(k), then repeat steps 3 to 5;
otherwise the iteration is over.
2.3 Determination of optimal initial clustering center K
The objective function E can be seen by the
K-means algorithm:1) the selection of mi directly
affects the convergence of the algorithm. If the arbitrary selection of is not reasonable, the algorithm converges slowly, the number of iterations is increased, and the operation speed is also reduced; if the average value of the data is selected, the
algorithm converges fast, the number of iteration is reduced, and the operation speed is improved. The
mean value of this type of data that is mi is selected,
the number of iteration is reduced, and the operation speed is improved. According to statistical theory,
the standard deviation can be determined by mi and
clustering data of the mean of the close degree, the
smaller the standard deviation, mi and the average is
to be closed. For the variance σ is and the mean
value u a normal distribution of data of which 95.4% of the data is mainly concentrated in the
[u-2σ,u+2σ].If the initial clustering center for k
classification [u-2σ,u+2σ] is selected with interval
bisection ,then the initial cluster center mi for:
4
u 2 , 1, 2 ;
1
mi i i k
n
σ σ
= − + =
+
(3)
As can be seen that mi depends on clustering data
of the prior knowledge which is easy to lead to the
initial calculation of mi does not necessarily exist in
the original data set. In this paper, first by the
formula (3) calculating mi, then find out the initial
cluster center that is the nearest of it. European distance, it makes up for the lack of a priori
knowledge of the raw data to impacting mi.
3 TEXTKCM MINING OF THE EXTERNAL
OPERATING CONDITIONS OF THE UNIT
The operating conditions of the unit include the load of the unit, the temperature of the external environment and the characteristics of the coal. By digging the historical operation data of the power station, the best record of the external running condition record can be obtained which can provide guidance for the actual operation of the power station. According to the Shanghai a 325MW power plant DCS system stability of the unit operation a week's data, by using the improved KCM algorithm, mining unit load and coal quality characteristics, the method of broadband method was used to excavate the temperature condition of the historical running environment. In the end, the optimal operation conditions of the unit operation are determined.
3.1 Mining of unit load operating conditions
results obtained from the load conditions are shown in Figure 3.
Figure 1. Scatter plots of power station.
Figure 2. K value curve.
Figure 3. Interval pie chart of load condition.
Fig 3 shows that divided by 10 load conditions, the load range of each condition is very different, the range of the minimum range for the working condition 1, 13.6MW, the maximum for the working condition 10, 23.96MW. Meanwhile, the range of data points in each working condition is not proportional to the range of data points, for example condition 1 included the data points are the entire data set of 20%. According to the data points of each load range, the total data percentage can be determined, and the operating load condition of the unit is 1, 2 and 10.And by the intermediate value of the load range can be seen, working conditions 1 shows that the unit running in the total load of 46%; 2 of the operating conditions in the total load of 50%, 10 of the operating conditions in the total load of 95%.It can be seen that the unit has not been running under the typical load.
3.2 Mining of operating conditions of coal quality characteristics
At present, the quality characteristics of the furnace into the furnace is not widely used because of the coal quality on-line analyzer and so on. It has not been monitored in real time [2] and [3].Coal quality characteristics are obtained by off-line sampling. In order to obtain the operating conditions of the coal quality characteristics of the unit,firstly, this paper use the method of literature [8], according to the operation data of the unit, by formula (4) construct coal power coefficient. Then the improved K-means algorithm is used to carry out the natural division of the coefficient of the coal quality, and determine the operating conditions of the coal quality. The classification results are as table 1.
*1000 *
f x
e s
F C
N B
= (4)
Type: Ff for the amount of coal into the boiler, t/h.
Ne external load for the same time unit commitment,
[image:4.612.316.532.349.538.2]MW. Bs for coal consumption, g/kWh.
Table 1. Results of Classification of Coal Quality Coefficient.
______________________________________________
High Medium Poor
quality quality quality
coal coal coal
______________________________________________ Coal
coefficient 1.0367 1.3197 1.7145
lower boundary
______________________________________________ Coal
coefficient 1.3186 1.7083 2.2075
upper boundary
______________________________________________
Interval size 0.2819 0.3886 0.4930
______________________________________________ Number of
data points 2279 388 1653
______________________________________________
Percentage 0.52755 0.089815 0.38264
_____________________________________________
3.3 Operating conditions of the external environment of the unit
The ambient temperature of the unit is changed with seasons and time, and the method of equal width is used. The ambient temperature is divided into an interval of 10, roughly the same number of samples of the N interval. For example ,the minimum temperature of Xinjiang power plant can be about -40 degrees, the maximum temperature of about 40 degrees Celsius, N value is 8~9.Hainan power plant minimum temperature of about 0 degrees Celsius, the lowest temperature is about 40 degrees Celsius, N value is 4~5.
It can be seen that the size of the N value is related to the location of the power plant. But only according to the geographical location of the temperature range determined values and cannot be 0
0.005 0.01 0.015 0.02 0.025 0.03 0.035
a reasonable characterization of the external environment of the unit temperature. Therefore, this paper studies the historical data according to the operation of the unit, according to the data recorded in the minimum temperature, maximum temperature and average temperature and calculating method for determining the value of N, such as (5).
1 2
min max
10 10
N N N
meanT T T meanT
f f
= +
− −
= +
(5)
Type: N is divided interval number; maxT is the
highest temperature record value; minT is the lowest
temperature record value; meanT is the average
temperature record value; f() is rounding function.
The temperature range is divided:
(
)
]
12
5 10 * 10 * 1 ,
5 10 * 10 * 1, 2
meanT N j
meanT N j j N
+ − + −
+ + + =
According to this method, the temperature range
of a certain power plant in Shanghai N=6, the
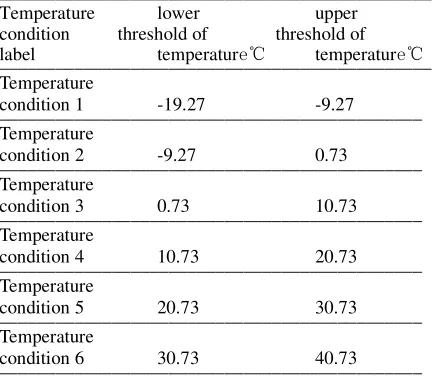
[image:5.612.317.532.85.190.2]temperature range of the results as shown in Table 2. As can be seen from table 2, this method of division with traditional method of [10, 20], [0, 10]... [*, max (Temperature)] of integer partition temperature interval completely different, the interval partitioning results can be more accurate that unit outside the work temperature and temperature information.
Table 2. Properties Interval Of Temperature.
______________________________________________
Temperature lower upper
condition threshold of threshold of
label temperature℃ temperature℃
______________________________________________ Temperature
condition 1 -19.27 -9.27
_____________________________________________ Temperature
condition 2 -9.27 0.73
_____________________________________________ Temperature
condition 3 0.73 10.73
_____________________________________________ Temperature
condition 4 10.73 20.73
_____________________________________________ Temperature
condition 5 20.73 30.73
_____________________________________________ Temperature
condition 6 30.73 40.73
_____________________________________________
3.4 Optimal combined operating conditions of unit operation
According to the above mentioned the mining of unit load, coal quality coefficient and working conditions temperature, combining the operating conditions of these three kinds of external units, and using the method of individual marking for each combination condition. Then the optimal operating conditions of the units are divided, and the results
[image:5.612.57.274.430.618.2]are shown in Table 3.
Table 3. Operating Conditions Of The Unit To Run The Optimal Combination Of External Conditions.
______________________________________________ Condition load coefficient coal temperature
label of quality
______________________________________________ condition 1 load 1 high quality coal temperature
condition 1 condition 2 load 1 high quality coal temperature
condition 2
…… ………
condition m load 10 high quality coal temperature condition n _____________________________________________
According to table 3, as well as the unit operating records can determine the unit operation of optimal external load combinations. Such as the historical operation data of a power plant in Shanghai:150MW unit load, coal quality coefficient of 1.3, temperature
-10℃ and calculation of boiler efficiency of 90%,
condition 1.According to this result, can continue to use data mining methods to explore other units operation adjustable parameters, such as excess air coefficient, so as to achieve the purpose of improving the efficiency of the unit by adjusting the operating parameters, in order to guide the actual operation of the power plant to provide data reference.
4 CONCLUSIONS
In this paper, the operating conditions of the units are divided based on the historical operating data of the unit. An improved K-means algorithm is proposed to solve the problem of load and coal quality characteristics, overcome the traditional K-means algorithm to set the initial clustering center and the number of clusters of defects; At the same time, the improvement of broadband method to realize partition of unit operation of external temperature and according to the historical operation data of a certain unit in Shanghai. Finally, the optimal operation condition of the unit is determined, which provides the reference data for the actual operation of the power station.
5 ACKNOWLEDGEMENTS
REFERENCES
[1]J. Li, J. Liu, L. Zhang, and C. Niu, The Research and
Application of Fuzzy Association Rule Mining in Power Plant Operation Optiminzation[J], Chin. Soc. for Elec Eng, 2006, 26(20):118-123.
[2]G. Qiu, S. Wang, and W. Wang, Data Mining in
Optimization of the Targeted Value for Thermal Power
Plant[J], Control Theory and Applications,2006,
25(3):118-123.
[3]Y. Gu, W. Zhao, and Z. Wu, An Optimal MVs Decision
model for Boiler Combustion Optimization[J],China Soc. for Elec.Eng,2012, 32(2):39-44.
[4]S. Zhai and X. Huang, On Application of Data-mining in
Power Stations[J], Control Engineering of China, 2007, 14(S1):174-177.
[5]Q. Wang, Z. Chen, and H. Wei, The Summary of Optimal
Operation Parameters in Power Station Based on the Data Mining[J], Electric Power Science and Engineering, 2015, 31(7):19-24.
[6]Y. Lu, X. Xu, and M. Chen, Use of Data Mining
Techniques in Process Control and Optimization of Thermal Power Plant[J], Power System Engineering, 2003, 19(2): 48-50.
[7]M. Malek and H. Kadima, Searching frequent item sets by
clustering data: towards a parallel approach using map reduce[J], Lecture Notes in Computer Science, 2013: 251-258.
[8]T. Yang, D. Zeng, and J. Liu, Real-time Coal Quality