Amplification Tests for Detection of
Chlamydia trachomatis
and
Neisseria gonorrhoeae
on Urine Samples from Female Subjects and
Self-Collected Vaginal Swabs
Max Chernesky,aDan Jang,aJodi Gilchrist,aTodd Hatchette,bAndré Poirier,cJean-Frederic Flandin,dMarek Smieja,aSam Ratname,f
St. Joseph’s Healthcare/McMaster University, Hamilton, Ontario, Canadaa; Queen Elizabeth II Health Sciences Centre, Dalhousie University, Halifax, Nova Scotia, Canadab; Centre de santé et de services sociaux de Trois-Rivières, Trois-Rivières, Quebec, Canadac; Public Health Laboratory, St. John’s, Newfoundland and Labrador, Canadad; Division of Community Health and Humanities, Memorial University, St. John’s, Newfoundland and Labrador, Canadae; Department of Oncology, McGill University, Montreal, Quebec, Canadaf
In a comparison of 4 second-generation nucleic acid amplification tests performed with self-collected vaginal swab (SCVS) and first-void urine (FVU) specimens from 575 women, SCVS specimens indicated more infections than did FVU specimens in all assays. The prevalence rates were 9% (53/575 patients) forChlamydia trachomatisand 2% (11/575 patients) forNeisseria gonor-rhoeae. The clinical sensitivities for testing SCVS specimens forC. trachomatiswere 98.1% on a Tigris system and 96.2% on a Panther system for the Aptima Combo 2 assay (Hologic Gen-Probe), 98.0% for the RealTime CT/NG assay on an m2000 instru-ment (Abbott), 90.6% for the ProbeTec CT/GC Qxassay on the Viper system (Becton Dickinson), and 84.6% for the cobas
CT/NG assay on the cobas 4800 platform (Roche). Clinical sensitivities forC. trachomatisin FVU specimens were 88.7% (Tigris) and 88.0% (Panther) for the Aptima Combo 2 assay, 76.9% for the RealTime CT/NG assay, 75.5% for the ProbeTec CT/GC Qx assay, and 81.1% for the cobas CT/NG assay. Clinical sensitivities of the assays forN. gonorrhoeae, with limited positive results, ranged from 63.6% to 100%. Specificities for both infections ranged from 98.4 to 100%. Differences in analytical sensitivities and levels of molecular targets in clinical samples but not inhibitors of amplification may explain the differences in clinical
sensitivities.
C
hlamydia trachomatisandNeisseria gonorrhoeaeinfections of the female genital tract present a diagnostic challenge becausemany patients are asymptomatic (1,2). This has led to
implemen-tation of screening strategies using less-invasive sampling
proce-dures (3,4), and screening programs often increase the number of
samples received in the laboratory (5). Nucleic acid amplification
tests (NAATs) forC. trachomatisandN. gonorrhoeae diagnosis
have been available from commercial sources for over 15 years. The first PCR assay from Roche was the semiautomated Amplicor
CT/NG test (6), which evolved into the automated cobas
Ampli-cor assay. The ligase chain reaction assay (Abbott LCX) was the second NAAT to be used extensively but was withdrawn globally in 2003. A first-generation strand-displacement assay called ProbeTec ET, from Becton Dickinson, became available for eval-uation in 1999. During the same time frame, a first-generation transcription-mediated amplification test was developed by Gen-Probe and evolved into the second-generation Gen-Gen-Probe Aptima Combo 2 (AC2) assay, which was evaluated with female
speci-mens and was reported in 2003 (7). More recently, the U.S. Food
and Drug Administration (FDA) cleared three additional second-generation assays and automated instruments, namely, the Abbott
Molecular RealTime CT/NG assay on the m2000 instrument, the
Becton Dickinson ProbeTec CT/GC Qxassay on the Viper XTR
instrument, and the Roche Diagnostics cobas CT/NG assay on the cobas 4800 instrument.
Examination of the package inserts for these newer second-generation assays indicated that FDA clearance was granted by comparing the new assays with patient-infected status (PIS) re-sults, with infection being based on positive results from at least two cleared assays when 2 different specimen types were tested.
The cobas CT/NG assay was compared with two other
second-generation assays (AC2 and ProbeTec CT/GC Qxassays) (8,9).
The AC2 test and the first-generation ProbeTec ET assay were
chosen for the RealTime CT/NG performance studies (10) and the
ProbeTec CT/GC Qxclinical evaluations (11). Since the AC2 test is
clinically more sensitive than the first-generation ProbeTec ET
assay (12), comparisons that include it in PIS analyses may result
in misleading performance estimates for the investigational assay, because the extra positive results detected by the more-sensitive AC2 reference test are classified as false-positive results. Head-to-head comparisons of several assays with more than one sample type have yielded more-accurate reflections of sensitivity and
specificity (12,13). The objectives of this study were to compare
the performance of the four second-generation assays with first-void urine (FVU) samples and self-collected vaginal swab (SCVS) specimens from patients attending women’s health clinics and to detect inhibitors when a proportion of each sample was spiked
with known concentrations ofC. trachomatisorganisms.
Received30 December 2013Returned for modification31 January 2014 Accepted27 March 2014
Published ahead of print2 April 2014 Editor:E. Munson
Address correspondence to Max Chernesky, [email protected]. Copyright © 2014, American Society for Microbiology. All Rights Reserved.
doi:10.1128/JCM.03552-13
The authors have paid a fee to allow immediate free access to this article.
on May 16, 2020 by guest
http://jcm.asm.org/
MATERIALS AND METHODS
Study design.Between July 2012 and August 2013 a total of 575 women attending sexual health centers in Hamilton and Toronto, Ontario, Can-ada, self-collected FVU (initial 20 ml of urine) specimens and then four SCVSs, using collection kits from Abbott Molecular, Becton Dickinson, Roche Diagnostics, and Hologic Gen-Probe. Each woman signed a con-sent form approved by the St. Joseph’s Healthcare and Hamilton Health Sciences Research ethics boards. Illustrated instructions were provided, and the order of collection of the SCVSs was randomized. Following col-lection, the samples were transported the same day to the Infections Re-search Laboratory (IRL) at St. Joseph’s Healthcare.
Determination of assay endpoints for detection.Before any clinical specimens were processed, uninfected SCVS and FVU specimens were
used to make serial 10-fold dilutions ofC. trachomatisstrain L2 434, which
had been propagated in McCoy cell cultures, using 10 replicates for each
dilution.C. trachomatiselementary bodies (EBs) were counted by direct
fluorescent antibody staining with monoclonal antibodies specific for ma-jor outer membrane proteins, as described previously (12). The panels were shipped by overnight courier and assayed at the testing sites. The endpoint dilution of detection was selected as 10 of 10 replicates reading positive in the assay for each specimen type. A dilution 100-fold above the endpoint of detection was used to spike clinical specimens to determine whether inhibitors were present. Percent rate of inhibition was calculated as the number of spiked specimens testing negative divided by the number of spiked specimens times 100. Probit regression analysis was performed to calculate the 50% levels of detection, with 95% confidence intervals (CIs) (SPSS version 20).
Laboratory testing.For each patient, spiked and unspiked FVU and SCVS samples were tested in a blinded fashion, within 2 weeks, with the AC2 test on Tigris and Panther instruments (Hologic Gen-Probe) at the IRL. Samples were shipped, according to the package insert guidelines, to Trois-Rivières, Quebec, Canada, for RealTime CT/NG testing on an m2000 system, to Halifax, Nova Scotia, Canada, for BD ProbeTec CT/GC
Qxtesting on a Viper system, and to St. John’s, Newfoundland, Canada,
for cobas CT/NG testing on a cobas 4800 system. All tubes were bar coded, handled in a blinded fashion, and tested according to each manufacturer’s instructions within 2 weeks after collection. Results from each testing site were sent electronically to the IRL, where they were transferred into a Microsoft Excel database. During this study, workflow and maintenance characteristics of each automated instrument were determined (18).
For the AC2 test, each patient self-collected a SCVS and placed it in an Aptima collection and transportation tube containing 2.9 ml of transport medium. For FVU samples, 2 ml of urine was pipetted into an Aptima transport tube containing 2 ml of medium, in the IRL. The two specimen types were split into two tubes each and spiked with an appropriate
con-centration ofC. trachomatis. The tubes were placed directly in the Tigris
system, and 400l of each sample was tested in the assay. The same
samples were tested separately, in a blinded fashion, with a Panther in-strument.
For the RealTime CT/NG test, each patient placed a self-collected
Ab-bott swab directly in an AbAb-bottmulti-Collect tube containing 1.2 ml of
specimen transport buffer. For FVU samples, 3 ml of urine was placed in
amulti-Collect tube containing 1.2 ml of buffer, in the IRL. The two types
of samples were split into two tubes each, and one of each was spiked. At
the testing site, 400l of each sample was tested with the m2000
instru-ment.
For the ProbeTec CT/GC Qxtest, patients placed a self-collected BD
swab into a transport tube, which was transported dry. At the IRL, SCVS specimens were eluted into a tube containing 2 ml of BD swab diluent, and 4 ml of the FVU samples was placed in an empty BD tube. Each sample type was split into two tubes, and one of each was spiked. At the testing
site, 150l of each sample was tested with the Viper instrument.
The Roche SCVS was placed by the patient in a cobas tube containing 4.3 ml of cobas PCR medium. At the IRL, 5 ml of the FVU specimens was pipetted into a cobas tube containing 4.3 ml of PCR medium. The two
sample types were split into two tubes each, and one of each was spiked.
After shipping to the testing site, 800l of each sample was processed with
the cobas 4800 system.
Data analysis.The results of each assay were compared with PIS find-ings based on results from all four assays with both SCVS and FVU sam-ples. Although AC2 testing was performed on two platforms, results from the Tigris instrument were used in the PIS analysis. A patient was consid-ered infected if at least two of the four assays yielded positive results for any specimen type. The clinical performance of tests with SCVS and FVU specimens was determined by calculating sensitivity, specificity, and pre-dictive values, with 95% confidence intervals. In addition, because FVU specimens from four patients were negative in all assays, the clinical sen-sitivity of tests with FVU specimens was also determined in a PIS analysis that excluded those four patients. McNemar’s test was used to compare
sensitivity estimates for matched samples.Pvalues of⬍0.05 were
consid-ered statistically significant.
RESULTS
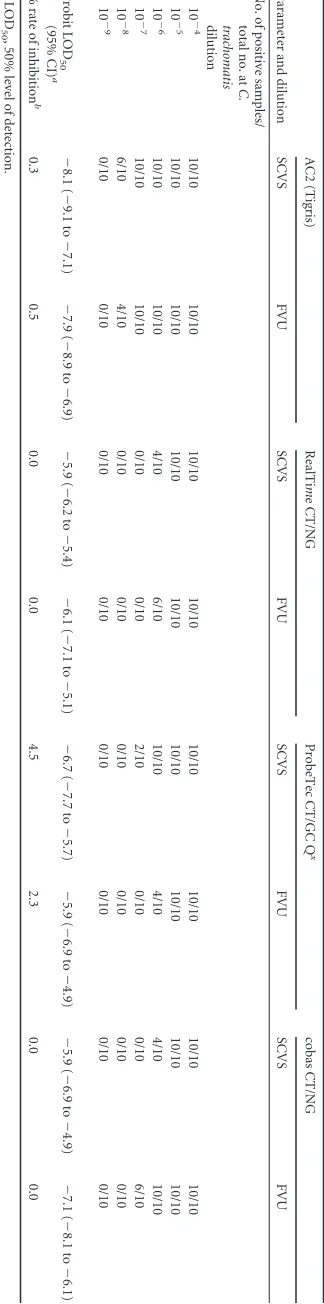
As indicated inTable 1, the final dilutions recording 10 of 10
replicates as positive for SCVS and FVU specimens were 10⫺7and
10⫺7, respectively, for AC2 testing with the Tigris system, 10⫺5
and 10⫺5 for RealTime CT/NG testing, 10⫺6 and 10⫺5 for
ProbeTec CT/GC Qxtesting, and 10⫺5and 10⫺6for cobas CT/NG
testing. On the basis of these results, all samples were spiked with
C. trachomatisat dilutions 100-fold above each assay’s endpoint of detection. Arbitrarily considering calculated percent rates of inhi-bition of less than 3% as expected variations related to spiking (Table 1), results from the spiked tubes showed no inhibition in either specimen type for all assays, except for SCVS specimens in
the ProbeTec CT/GC Qxassay (4.5%).
TheC. trachomatisprevalence was 9% (53/575 patients), and 60.4% of infected patients (32/53 patients) tested positive with both specimen types in all tests on all instruments. A comparison
of theC. trachomatisclinical sensitivities, specificities, and
predic-tive values of each assay for SCVS specimens is shown inTable 2.
The sensitivities were 98.1% for the AC2 assay on the Tigris system
and 96.2% on the Panther system, 98.0% for the RealTime CT/NG
assay, 90.6% for the ProbeTec CT/GC Qxassay, and 84.6% for the
cobas CT/NG assay. Three of theC. trachomatis-infected cases the
cobas CT/NG assay identified as negative did not have sufficient
sample volume for testing with the RealTime CT/NG assay and so
had to be excluded from the McNemar test, the results of which
did not reach significance (P⫽0.063).
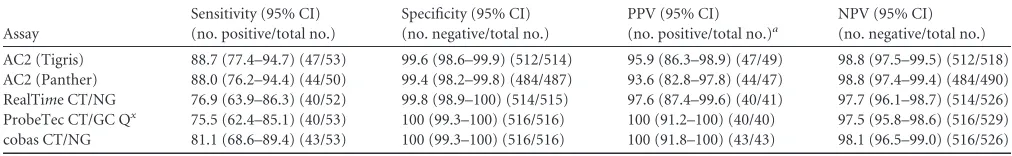
Using the FDA-defined PIS findings, FVU testing forC.
tracho-matis(Table 3) yielded sensitivities for the AC2 assay of 88.7% on the Tigris system and 88.0% on the Panther system; the values
were 76.9% for the RealTime CT/NG assay, 75.5% for the
ProbeTec CT/GC Qxassay, and 81.1% for the cobas CT/NG assay.
The clinical sensitivity of the AC2 assay was significantly greater
than those of the RealTime CT/NG assay (P⫽0.039) and the
ProbeTec CT/GC Qxassay (P⫽0.039). Examination of theC.
trachomatisFVU testing profiles for 15 women with discordant
results (Table 4) showed one patient to be FVU positive and SCVS
negative in all assays (1.9% of the 53C. trachomatis-positive
pa-tients). Fourteen vaginal PIS-positive patients had variable FVU results across the four assays, and four of them were FVU negative
in all assays (7.5% of theC. trachomatis-positive patients).
Perfor-mance calculations for FVU testing without the four patients whose urine samples were negative in all tests resulted in the fol-lowing sensitivity values: 95.9% for the AC2 assay on the Tigris
system and 95.7% on the Panther system, 83.3% for the RealTime
on May 16, 2020 by guest
http://jcm.asm.org/
CT/NG assay, 81.6% for the ProbeTec CT/GC Qx assay, and
87.8% for the cobas CT/NG assay. All of the assays demonstrated specificities above 98%. Occasionally single-sample, single-test,
false-positive results (specificity) were seen in the total study (
Ta-bles 2and3).
TheN. gonorrhoeaeprevalence was 2% (11/575 patients). For
SCVS specimens,N. gonorrhoeaesensitivities were 90.9% for the
AC2 assay on the Tigris system and 100% on the Panther system,
70.0% for the RealTime CT/NG assay, 100% for the ProbeTec
CT/GC Qxassay, and 63.6% for the cobas CT/NG assay. For FVU
samples,N. gonorrhoeaesensitivities were 72.7% for the AC2 assay
on the Tigris system and 66.7% on the Panther system, 70.0% for
the RealTime CT/NG assay, 80.0% for the ProbeTec CT/GC Qx
assay, and 70.0% for the cobas CT/NG assay. All specificities were
above 99.5%. The sample size forN. gonorrhoeaeinfection was too
small for statistical comparisons.
DISCUSSION
When clinical sensitivity and specificity calculations were made
according to FDA guidelines, SCVS testing identified moreC.
tra-chomatis-positive patients than did FVU testing with all four sec-ond-generation assays (range, 3% to 21%). Similar observations for these two specimen types with the individual assays have been
made in several other studies (3,7,9,12). In the current study, the
AC2 assay performed on the Tigris or Panther system identified
significantly more C. trachomatis-infected women (98.1% to
96.2%) than did the cobas CT/NG test (84.6%;P⫽0.016). The
values in our study for cobas CT/NG testing of SCVS specimens are considerably lower than those reported by Van Der Pol et al.
(9), who showed 93.5% of the positive samples being detected by
cobas CT/NG testing. That study did not test SCVS specimens in the reference assays; therefore, a true head-to-head comparison of the new assays with SCVS specimens was not possible. We have conducted an internal investigation of the cobas CT/NG
assay-negative SCVS samples fromC. trachomatis-positive patients. The
assay runs that contained those samples exhibited normal posi-tive- and negaposi-tive-control values, and none of the patient samples
spiked withC. trachomatisshowed inhibitors. The lot numbers of
the reagents used in those runs have not been identified as prob-lematic. Examination of the order of collection of SCVSs for eight false-negative results in cobas CT/NG testing showed that three were collected first, one was second, four were third, and none was fourth. Splitting of samples to enable spiking for inhibitors might have had a slight dilution effect on sensitivity for samples already near a test’s cutoff value, but examination of test results in relation to assay cutoff values for the false-negative samples did not con-firm this hypothesis.
In the multicenter clinical trial reported by Gaydos et al. (10),
the RealTime CT/NG assay on the m2000 system was compared
with the AC2 assay and the first-generation ProbeTec ET test with SCVS and clinician-collected vaginal swab samples and showed
sensitivities similar to those of the AC2 assay forC. trachomatis.
Comparison of the AC2 assay and the RealTime CT/NG assay on
the m2000 system with SCVS specimens in the current study
con-firms those observations (Table 2).
InC. trachomatisclinical evaluations of the ProbeTec CT Qx
assay on the Viper system with XTR technology, Taylor et al. (11)
compared its performance with that of the AC2 assay and the first-generation ProbeTec ET test and showed good sensitivity (96.5%) with SCVS specimens. In the current study, the sensitivity
TABLE 1 Endpoints of detection of C. trachomatis dilutions in normal SCVS and FVU samples for the AC2 (Tigris), RealTi m e CT/NG, ProbeTec CT/GC Q x ,and cobas CT/NG assays Parameter and dilution AC2 (Tigris) RealTi m e CT/NG ProbeTec CT/GC Q x cobas CT/NG SCVS FVU SCVS FVU SCVS FVU SCVS FVU No. of positive samples/ total no. at C. trachomatis dilution 10 ⫺ 4 10/10 10/10 10/10 10/10 10/10 10/10 10/10 10/10 10 ⫺ 5 10/10 10/10 10/10 10/10 10/10 10/10 10/10 10/10 10 ⫺ 6 10/10 10/10 4/10 6/10 10/10 4/10 4/10 10/10 10 ⫺ 7 10/10 10/10 0/10 0/10 2/10 0/10 0/10 6/10 10 ⫺ 8 6/10 4/10 0/10 0/10 0/10 0/10 0/10 0/10 10 ⫺ 9 0/10 0/10 0/10 0/10 0/10 0/10 0/10 0/10 Probit LOD 50 (95% CI) a ⫺ 8.1 ( ⫺ 9.1 to ⫺ 7.1) ⫺ 7.9 ( ⫺ 8.9 to ⫺ 6.9) ⫺ 5.9 ( ⫺ 6.2 to ⫺ 5.4) ⫺ 6.1 ( ⫺ 7.1 to ⫺ 5.1) ⫺ 6.7 ( ⫺ 7.7 to ⫺ 5.7) ⫺ 5.9 ( ⫺ 6.9 to ⫺ 4.9) ⫺ 5.9 ( ⫺ 6.9 to ⫺ 4.9) ⫺ 7.1 ( ⫺ 8.1 to ⫺ 6.1) % rate of inhibition b 0.3 0.5 0.0 0.0 4.5 2.3 0.0 0.0 a LOD 50 ,50% level of detection. b Calculated as number of spiked specimens testing negative/total number of specimens spiked with C. trachomatis ⫻ 100.
on May 16, 2020 by guest
http://jcm.asm.org/
[image:3.585.81.243.71.723.2]of the ProbeTec CT/GC Qxassay on the Viper system was lower
(90.6%) but was not statistically different from values for the other
assays. TheC. trachomatisFVU sample sensitivity rates from the
cobas evaluations (8) were 92.3% for the cobas test, 95.8% for the
AC2 assay, and 94.8% for the ProbeTec CT/GC Qxassay, in
com-parison with 81.1%, 88.7%, and 75.5%, respectively, in the
cur-rent study (Table 3), but the specificities for all assays were above
99.4%.
AC2 testing performed with FVU specimens on the Tigris or Panther system in the current study identified significantly more
C. trachomatis-infected patients than did the ProbeTec CT/GC Qx
assay or the RealTime CT/NG assay. In the ProbeTec CT/GC Qx
assay clinical trial publication (11), the sensitivities reported for
FVU specimens were 93.0% for the ProbeTec CT/GC Qxassay,
96.5% for the AC2 assay, and 86.7% for the first-generation
ProbeTec ET assay. In the RealTime CT/NG assay trials (10), the
sensitivities for FVU specimens ranged from 92.6% to 95.7% for the RealTime CT/NG assay, which was much higher than 76.9% in
the current study (Table 3).
Cheng et al. (14) compared the RealTime CT/NG assay and the
first-generation Amplicor CT/NG assay, showing very high levels
of agreement for FVU specimens. Similarly, Rockett et al. (15)
showed that the cobas CT/NG assay forC. trachomatisdetected
94.5% of the FVU specimens found to be positive by the
first-generation Amplicor test. These studies (14,15) suggest that the
two newer second-generation assays are performing comparably to the first-generation tests with FVU samples.
Mushanski et al. (16) conducted a head-to-head comparison of
the BD ProbeTec CT/GC Qxassay on the Viper system with the
AC2 assay on the Tigris system forC. trachomatiswith FVU
sam-ples and found strong agreements of positive and negative results. Analysis of the discordant samples showed that all of the AC2 assay-positive samples were confirmed as positive by the Aptima
C. trachomatisalternate primers assay, whereas only one of the
four extra ProbeTec CT/GC Qxassay-positive samples tested
pos-itive in repeat testing, which suggests that three of the specimens
might have been false-positive findings originally. If these confir-matory results had been taken into consideration for calculation
of sensitivity, then the ProbeTec CT/GC Qxassay would have had
lower sensitivity with FVU specimens and the findings would agree more closely with findings in the current study.
Differences seen in the current head-to-head study for detec-tion of positive findings among SCVS and FVU samples, in com-parison with previously reported clinical trials, may be due to several factors, including (i) failure to include vaginal swabs for the reference tests in the calculated comparisons for vaginal swabs for the new test, (ii) differences in methods used for PIS calcula-tions, and (iii) the use of first-generation assays for PIS analyses. These problems can be compounded if multiple specimen types
are used for PIS analyses, because femaleC. trachomatisinfections
do not always yield analytical material from all sample sites. In the
present study, four women were clearly infected withC.
tracho-matisby SCVS testing but their FVU samples were negative in all
assays (Table 4). Calculations without the results for these four
patients provide a clearer understanding of the assay sensitivities for FVU specimens (95.9% for the AC2 assay on the Tigris system
and 95.7% on the Panther system, 83.3% for the RealTime CT/NG
assay, 81.6% for the ProbeTec CT/GC Qxassay, and 87.8% for the
cobas CT/NG assay), in comparison with calculations made fol-lowing FDA PIS guidelines (88.7%, 88.0%, 76.9%, 75.5%, and
81.1%, respectively) (Table 3).
A weakness of our study is the limited number of patients
in-fected withN. gonorrhoeae, which prevented meaningful
calcula-tions to compare the performance of the four assays with the two
specimen types. Similar toC. trachomatisdata, SCVS testing
iden-tified moreN. gonorrhoeaeinfections than did FVU testing. Four
of the 11 patients were dually infected withC. trachomatis.
A previous study comparing the AC2 assay with first-genera-tion ProbeTec and Amplicor tests showed considerable inhibifirst-genera-tion rates of 27.2% for FVU samples with the ProbeTec assay and 10.4% for SCVS specimens and 12.1% for FVU specimens with
[image:4.585.40.545.86.165.2]the Amplicor assay (12). The present study showed that inhibitors
TABLE 2Sensitivities, specificities, and positive and negative predictive values of the AC2 assay on the Tigris and Panther systems, the RealTime
CT/NG assay, the ProbeTec CT/GC Qxassay, and the cobas CT/NG assay for SCVS specimens
Assay
Sensitivity (95% CI) (no. positive/total no.)
Specificity (95% CI) (no. negative/total no.)
PPV (95% CI)
(no. positive/total no.)a
NPV (95% CI) (no. negative/total no.)
AC2 (Tigris) 98.1 (90.1–99.7) (52/53) 99.0 (97.7–99.6) (505/510) 91.2 (81.1–96.2) (52/57) 99.8 (98.9–100) (505/506)
AC2 (Panther) 96.2 (87.3–99.0) (51/53) 98.4 (96.9–99.2) (499/507) 86.4 (75.5–93.0) (51/59) 99.6 (98.6–99.9) (499/501)
RealTime CT/NG 98.0 (89.7–99.7) (50/51) 100 (99.3–100) (510/510) 100 (92.9–100) (50/50) 99.8 (98.9–100) (510/511)
ProbeTec CT/GC Qx 90.6 (79.8–95.9) (48/53) 100 (99.3–100) (520/520) 100 (92.6–100) (48/48) 99.1 (97.8–99.6) (520/525)
cobas CT/NG 84.6 (72.5–92.0) (44/52) 99.6 (98.6–99.9) (520/522) 95.7 (85.5–98.8) (44/46) 98.5 (97.0–99.2) (520/528)
a
PPV, positive predictive value; NPV, negative predictive value.
TABLE 3Sensitivities, specificities, and positive and negative predictive values of the AC2 assay on the Tigris and Panther systems, the RealTime
CT/NG assay, the ProbeTec CT/GC Qxassay, and the cobas CT/NG assay for FVU specimens
Assay
Sensitivity (95% CI) (no. positive/total no.)
Specificity (95% CI) (no. negative/total no.)
PPV (95% CI)
(no. positive/total no.)a
NPV (95% CI) (no. negative/total no.)
AC2 (Tigris) 88.7 (77.4–94.7) (47/53) 99.6 (98.6–99.9) (512/514) 95.9 (86.3–98.9) (47/49) 98.8 (97.5–99.5) (512/518)
AC2 (Panther) 88.0 (76.2–94.4) (44/50) 99.4 (98.2–99.8) (484/487) 93.6 (82.8–97.8) (44/47) 98.8 (97.4–99.4) (484/490)
RealTime CT/NG 76.9 (63.9–86.3) (40/52) 99.8 (98.9–100) (514/515) 97.6 (87.4–99.6) (40/41) 97.7 (96.1–98.7) (514/526)
ProbeTec CT/GC Qx 75.5 (62.4–85.1) (40/53) 100 (99.3–100) (516/516) 100 (91.2–100) (40/40) 97.5 (95.8–98.6) (516/529)
cobas CT/NG 81.1 (68.6–89.4) (43/53) 100 (99.3–100) (516/516) 100 (91.8–100) (43/43) 98.1 (96.5–99.0) (516/526)
aPPV, positive predictive value; NPV, negative predictive value.
on May 16, 2020 by guest
http://jcm.asm.org/
[image:4.585.39.545.638.716.2]ofC. trachomatisamplification in SCVS and FVU specimens are not playing a role in any of these second-generation assays, sug-gesting that internal inhibitor controls are unnecessary. Internal controls for specimen adequacy may be useful but may create a dilemma for clinicians regarding repeat sample collection from patients. Endpoint-of-detection experiments in the earlier study
(12) showed that the AC2 assay detectedC. trachomatisto a
dilu-tion of 10⫺8or 1.0 to 0.1 elementary bodies (EBs) per 100l, in
contrast to the first-generation cobas Amplicor and ProbeTec ET
tests, which detected 100 EBs per 100l. The current study found
the values to be 1 EB per 100l for the AC2 assay and 10 to 100 EBs
per 100l for the cobas CT/NG, ProbeTec CT/GC Qx, and
Real-Time CT/NG assays. Cheng et al. (14) showed that the RealTime
CT/NG assay was 4 times more sensitive analytically than the first-generation cobas Amplicor test. These studies suggest that differ-ences in analytical sensitivity may translate into differdiffer-ences in
clin-ical sensitivity. The differences in clinclin-ical sensitivities betweenC.
trachomatisrRNA detection with the AC2 assay and detection of cryptic plasmid DNA with PCR or strand-displacement assays are more likely due to differences in the endpoints of detection of the assays (analytical sensitivity), as shown in the dilution series, and are expressed clinically by differences in rRNA versus DNA
amounts in the clinical samples. Michel et al. (17) showed
signif-icant differences of 733C. trachomatisEBs/100l for SCVS
spec-imens versus 47 EBs/100l for FVU samples, which may explain
the differences seen in the present study between SCVS and FVU samples for the DNA tests.
In conclusion, the high specificities observed for the four assays are important to ensure minimal reporting of false-positive re-sults. Inhibitors of nucleic acid amplification did not account for differences in the comparisons of sensitivities for SCVS and FVU specimens. The clinical sensitivity differences seen in this head-to-head comparison study are more likely determined by analytical
sensitivities and the levels ofC. trachomatistarget analytes in
clin-ical samples.
ACKNOWLEDGMENTS
This study was supported by a research grant from Hologic Gen-Probe Inc. (San Diego, CA).
Hologic Gen-Probe had no input in the study design, choice of instru-ments studied, data analysis, or preparation of the report.
We thank the following individuals for meticulously reviewing assay processing steps, running assays, and providing support and cooperation throughout the study: Christine Peterson, Caroline Marchand, and Joce-lyn Blouin, Centre de Santé et de Services Sociaux de Trois-Rivières, Trois-Rivières, Quebec, Canada; Elizabeth Oates and Sandy Tucker, Pub-lic Health Laboratory, St. John’s, Newfoundland and Labrador, Canada; and Catherine Roberts, Gale Naugle, and Joan MacDonald, Queen Eliza-beth II Health Sciences Centre, Halifax, Nova Scotia, Canada. We also
thank Laura Gilbert and Sandra Pike, Public Health Laboratory, St. John’s, Newfoundland and Labrador, Canada, for assistance with prepa-ration of the manuscript.
S.R. has received research funding and speaker honoraria from and has consulted for Hologic Gen-Probe. M.C. has received research funding and speaker honoraria from Hologic Gen-Probe and has served as a con-sultant for and received research funding from Abbott Molecular.
REFERENCES
1.Datta D, Torrone E, Kruszon-Moran D, Berman S, Johnson R, Satterwhite C, Papp J, Weinstock H.2012.Chlamydia trachomatistrends in the United States among persons 14 to 39 years of age, 1999 –2008. Sex. Transm. Dis.
39:92–96.http://dx.doi.org/10.1097/OLQ.0b013e31823e2ff7.
2.Scholes D, Satterwhite C, Yu O, Fine D, Weinstock H, Berman S.2012.
Long-term trends inChlamydia trachomatisinfections and related
out-comes in a US managed care population. Sex. Transm. Dis.39:81– 88.
http://dx.doi.org/10.1097/OLQ.0b013e31823e3009.
3.Schachter J, Chernesky M, Willis DE, Fine PM, Martin DH, Fuller D, Jordan JA, Janda W, Hook EW.2005. Vaginal swabs are the specimens of
choice when screening forChlamydia trachomatisandNeisseria
gonor-rhoeae: results from a multicenter evaluation of the APTIMA assays for
both infections. Sex. Transm. Dis.32:725–728.http://dx.doi.org/10.1097
/01.olq.0000190092.59482.96.
4.Chernesky M, Hook EW, Martin DH, Lane J, Johnson R, Jordan JA, Fuller D, Willis DE, Fine PM, Janda JM, Schachter J.2005. Women find
it easy and prefer to collect their own vaginal swabs to diagnoseChlamydia
trachomatisandNeisseria gonorrhoeaeinfections. Sex. Transm. Dis.32:
729 –733.http://dx.doi.org/10.1097/01.olq.0000190057.61633.8d.
5.Chow J.2012. Measuring the uptake and impact ofChlamydiascreening
programs: easier said than done. Sex. Transm. Dis.39:89 –91.http://dx
.doi.org/10.1097/OLQ.0b013e318245f95c.
6.Rosenstraus M, Wang Z, Chang SY, DeBonville D, Spadoro JP.1998. An internal control for routine diagnostic PCR: design, properties, and
effect on clinical performance. J. Clin. Microbiol.36:191–197.
7.Gaydos C, Quinn T, Willis D, Weissfeld A, Hook E, Martin D, Ferrero D, Schachter J.2003. Performance of the APTIMA Combo 2 assay for
detection ofChlamydia trachomatisandNeisseria gonorrhoeaein female
urine and endocervical swab specimens. J. Clin. Microbiol.41:304 –309.
http://dx.doi.org/10.1128/JCM.41.1.304-309.2003.
8.Van Der Pol B, Liesenfeld O, Williams J, Taylor S, Lillis R, Body B, Nye M, Eisenhut C, Hook E.2012. Performance of the cobas CT/NG test compared to the APTIMA AC2 and Viper CTQ/GCQ assays for detection
ofChlamydia trachomatisandNeisseria gonorrhoeae. J. Clin. Microbiol.
50:2244 –2249.http://dx.doi.org/10.1128/JCM.06481-11.
9.Van Der Pol B, Taylor S, Liesenfeld O, Williams J, Hook E. 2013.
Vaginal swabs are the optimal specimen for detection of genitalChlamydia
trachomatisorNeisseria gonorrhoeaeusing the cobas 4800 CT/NG test.
Sex. Transm. Dis.40:247–250.http://dx.doi.org/10.1097/OLQ.0b013e31
82717833.
10. Gaydos C, Cartwright C, Colaninno P, Welsch J, Holden J, Ho Y, Webb E, Anderson C, Bertizis R, Zhang L, Miller T, Leckie G, Abravaya K, Robinson J.2010. Performance of the Abbott RealTime CT/NG for
de-tection ofChlamydia trachomatisandNeisseria gonorrhoeae. J. Clin.
Mi-crobiol.48:3236 –3243.http://dx.doi.org/10.1128/JCM.01019-10.
11. Taylor S, Van Der Pol B, Lillis R, Hook E, LeBar W, Davis T, Fuller D, Mena L, Fine P, Gaydos C, Martin D.2011. Clinical evaluation of the BD
[image:5.585.41.546.78.170.2]ProbeTecTMChlamydia trachomatisQxamplified DNA assay on the BD
TABLE 4C. trachomatisFVU testing profiles for 15 women with discordant results
Vaginal specimen PIS result
FVU specimen result
No. of patients
AC2 RealTime CT/NG ProbeTec CT/GC Qx cobas CT/NG
Positive Negative Negative Negative Negative 4
Positive Positive Negative Negative Negative 5
Positive Positive Negative Negative Positive 3
Positive Positive Positive Positive Negative 1
Positive Negative Negative Negative Positive 1
Negative Positive Positive Positive Positive 1
on May 16, 2020 by guest
http://jcm.asm.org/
ViperTMsystem with XTRTMtechnology. Sex. Transm. Dis.38:603– 609.
http://dx.doi.org/10.1097/OLQ.0b013e31820a94d2.
12. Chernesky M, Jang D, Luinstra K, Chong S, Smieja M, Cai W, Hayhoe B, Portillo E, MacRitchie C, Main C, Ewert R.2006. High analytical
sensitivity and low rates of inhibition may contribute to detection of
Chla-mydia trachomatisin significantly more women by the APTIMA Combo 2
assay. J. Clin. Microbiol.44:400 – 405.http://dx.doi.org/10.1128/JCM.44
.2.400-405.2006.
13. Tabrizi S, Unemo M, Limnios A, Hogan T, Hjelmevoll S, Garland S, Tapsall J.2011. Evaluation of six commercial nucleic acid
amplifica-tion tests for detecamplifica-tion ofNeisseria gonorrhoeaeand otherNeisseria
spe-cies. J. Clin. Microbiol.49:3610 –3615. http://dx.doi.org/10.1128/JCM
.01217-11.
14. Cheng A, Qian Q, Kirby J.2011. Evaluation of the Abbott RealTime CT/NG assay in comparison to the Roche cobas Amplicor CT/NG assay. J. Clin.
Microbiol.49:1294 –1300.http://dx.doi.org/10.1128/JCM.02595-10.
15. Rockett R, Goire N, Limnios A, Turra M, Higgens G, Lambert SB, Bletchly C, Nissen M, Sloots TP, Whiley DM.2010. Evaluation of the
cobas 4800 CT/NG test for detectingChlamydia trachomatisandNeisseria
gonorrhoeae. Sex. Transm. Infect.86:470 – 473.http://dx.doi.org/10.1136
/sti.2010.042812.
16. Mushanski L, Brandt K, Coffin N, Levett P, Horsman G, Rank E.2012. Comparison of the BD Viper system with XTR technology to the Gen-Probe APTIMA Combo 2 assay using the TIGRIS DTS system for the
detection ofChlamydia trachomatisandNeisseria gonorrhoeaein urine
specimens. Sex. Transm. Dis. 39:514 –517. http://dx.doi.org/10.1097
/OLQ.0b013e31824f2f5b.
17. Michel C, Sonnex C, Carne C, White J, Magbanua J, Nadala E, Lee H.
2007.Chlamydia trachomatisload at matched anatomic sites: implications
for screening strategies. J. Clin. Microbiol.45:1395–1402.http://dx.doi
.org/10.1128/JCM.00100-07.
18. Ratnam S, Jang D, Gilchrist J, Smieja M, Poirier A, Hatchette T, Flandin J-F, Chernesky M.2014. Workflow and maintenance character-istics of five automated laboratory instruments for diagnosis of sexually
transmitted infections. J. Clin. Microbiol.52:2299 –2304. http://dx.doi
.org/10.1128/JCM.03549-13.