Image
Compression using Fusion Technique and
Quantization
T. Rammohan
Associate Professor,Dept. of Electronicsand communication Engineering SNS College of Engineering
Coimbatore, India
K. Sankaranarayanan,
PhD.Dean, Electrical sciences,EASA college of Engineering and Technology Coimbatore
Shalakha Rajan
Dept. of Electrical and ElectronicsEngineering SNS College of EngineeringCoimbatore, India
ABSTRACT
This paper describes a method for image compression using a fusion technique: combining wavelet transform and curvelet transform. Both the transforms when used individually shows some disadvantages. Wavelets though optimal for point singularities have limitations with directional properties. Similarly curvelets are challenged with small features. By combining both the transforms , the number of bits used to represent the image is reduced. The coefficients obtained after applying fusion technique is then selected for quantization and encoding. Quantization chosen is vector quantization as it saves time compared to scalar quantization. Vector quantization, mapping of image pixel intensity vectors into binary vectors. Arithmetic encoding technique is employed. This method is effective to remove redundancy in encoding of data. This technique works fairly well for grayscale as well as colour images
Keywords
Image compression, curvelet transform, wavelet transform, quantization, encoding
1.
INTRODUCTION
The extensive use of multimedia technology over the past decades has increased the demand for digital information. This awful demand made the current technology inefficient in handling the huge amount of data. Image compression by eradicating the redundancies present in it removes this problem. Generally, the image compression technique comprises of three techniques namely, transform, quantization and encoding [1]. The fundamental goal of data compression is to reduce the bit rate for transmission and storage of the information while maintaining the image quality.
Wavelet based compression of digital signals and images have been the main topic of interest in image compression for quite some time now. Though they have proven their worth in many fields the main drawback associated with them is their inability to detect directional properties. This led to the development of curvelet transform which gave emphasis to the curve regions. In this paper a combination of both wavelet and curvelet transforms are used so that all the regions of the image are given equal importance. The wavelet transform produced more number of coefficients to represent the curve regions whereas the curvelet transform used less number of coefficients. The coefficients obtained after the application of the transform is then selected for quantization. Vector Quantization is used . It rounds off (or quantizes) groups of numbers together instead of one at a time. Finally the quantized values are encoded using arithmetic encoding. It is a kind of entropy encoding in which a string of characters is
represented using a fixed number of bits per character. Arithmetic encoding encodes the entire message into a single number [2]. In order to measure the extent of compression parameters like Compression Ratio, Peak Signal to Noise Ratio (PSNR), and Root Mean Squared Error (RMSE) are used.
2.
TRANSFORM AND QUANTIZATION
FOR COMPRESSION
2.1
Wavelet Transform
Wavelet means small wave. It is all about analyzing signal with short duration finite energy functions. They transform the signal into a more useful form. This transformation of a signal is called wavelet transform. If the process of transformation is done in a smooth and continuous fashion then the transform is called continuous wavelet transform [5]. If the scale and position are changed in discrete steps, the transform is called discrete wavelet transform.
The continuous wavelet transform is a function of two parameters and , therefore contains a high amount of extra information while analyzing a function. Instead of continuously varying the parameters, we analyze the signal with a small number of scales with varying number of translations at each scale is analyzed, called discrete wavelet transform [6]. They are expressed in terms of a recurrence relation so that to see them iterations are to be done. A Haar wavelet function is used here. Wavelet is regarded as a better choice than the Fourier transform due to its capability to localize in frequency and time at the same time [3]. This approach is extremely useful in examining time varying or non stationary phenomena that are generally found in images. The fine data content in images is found in high frequency region and the course details in the low frequency region [10]. The wavelet transform uses its multi resolution capability to decompose an image into multiple frequency bands. But, wavelet transform has some drawbacks [12]. It suffers from some issues like
Lack of directional selectivity 2-D singularities [11]
2.2
Curvelet Transform
transform, is a multiscale transform, with frame elements indexed by scale and location parameters. Unlike the wavelet transform it has directional parameters, and the curvelet pyramid contains elements with a very high degree of directional characteristics. The curvelet transform is based on a certain anisotropic scaling principle, which is different from the wavelet scaling principle. The elements obey a special scaling law, where the length of the support of frame elements and width of support is linked by the relation width ≈ length2 [3].
2.3
Vector Quantization
The technique of obtaining the compact representation of an image while maintaining all the necessary information without much data loss is referred to as Image Compression. It can be classified into two types, Lossless and Lossy compression [15]. Lossy compression can be broadly classified into two types, namely Scalar Quantization (SQ) and Vector Quantization (VQ). A popular technique for source coding of image and speech data since 1980 is VQ. VQ involves processing the input samples in groups into a set of well-defined vectors using some distortion measure [4].
Day by day the use of multimedia, images and the other
picture formats are rapidly increasing in a variety applications. Type of technique that is used to store in multimedia data is an important although storage is bigger than ever, however it is not enough. Hence, the data compression particularly the image compression plays a vital role. Quantization is the mapping of a large set of possible inputs to a smaller set of possible outputs. In scalar quantization inputs are individual numbers. Scalar quantization includes operations like rounding to the nearest integer [7]. The possible outputs are called quantization levels, reproduction levels, or reconstruction levels. In vector quantization inputs are vectors rather than scalars The vector quantization is a classical quantization technique from signal processing and image compression which allows the modeling of probability density functions by the distribution of prototype vectors. It was originally used for data compression. It works by dividing a large set of points (vectors) into groups having approximately the same number of points closest to them [8].2.4
Arithmetic Encoding
Compression applications employ a wide variety of
techniques, have quite different degrees of complexity, but share some common processes. What most compression systems have in common is the fact that the final process is entropy coding, which is the process of representing information in the most compact form. It may be responsible for doing most of the compression work, or it may just complement what has been accomplished by previous stages. Out of all the different entropy-coding methods, and their possible applications in compression applications, arithmetic coding stands out in terms of elegance, effectiveness and versatility, as it is able to work more efficiently in the largest number of circumstances and purposes. Arithmetic coding is different from other coding methods for which the exact relationship between the coded symbols and the actual bitsresult as a number in base-D notation, where D is the number of symbols in the coded sequence alphabet. For example, if a coding method generates the sequence of bits 0011000101100, then we have
Code sequenced = [ 0011000101100 ]
Code value v = [ 0.0011000101100]2 = 0.19287109375
where the \2" subscript denotes base-2 notation. As usual, the decimal notation is omitted [9]. Among its most desirable features the following are used.
When applied to independent and identically distributed (i.i.d.) sources, the compression of each symbol are provably optimal [13].
It is effective in a wide range of situations and compression ratios. The same arithmetic coding implementation can effectively code all the diverse data created by the different processes, such as modeling parameters, transform coefficients, signaling, etc..
3.
OBJECTIVE
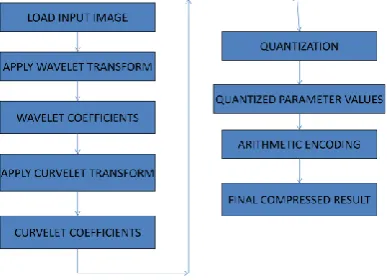
[image:2.595.319.513.480.620.2]The objective of this work is to compress the data in the image using Discrete Wavelet Transform and Curvelet transform along with Vector Quantization and Arithmetic Encoding techniques. The color image is used for compression. The basic steps of the proposed fusion technique based compression algorithm are shown in figure 1. All of the steps except the quantization is invertible. Quantization is a process of approximation in which the floating point values are converted into fixed integer values. Initially an image is fed into MATLAB which will be converted to a matrix with its rows and columns same as the pixel values of the image. The values of each row/ column are based on the color intensities. After applying wavelet transform, curvelet transform, vector quantization, and arithmetic encoding technique the final output image will be compressed. In the future this can also be implemented for compression of surgical videos and medical images.
Figure 1: Flow Diagram of Compression Process
4.
METHODOLOGY
[image:3.595.39.288.77.405.2]
.
[image:3.595.312.523.108.352.2]Figure 2 : Proposed Technique
Figure 3: Wavelet transformed image
4.1
Performance Parameters
The objective image quality metrics like Compression Ratio, Peak Signal to Noise Ratio (PSNR) and Root Mean Square Error (RMSE) are used for the evaluation of this approach. Compression ratio is used to enumerate the minimization in image representation size produced by an image compression algorithm. The data compression ratio is equivalent to the physical compression ratio used to evaluate physical compression of substances and is defined as the ratio between uncompressed image size and compressed image size:
RMSE is computed by averaging the squared intensity difference of reconstructed image, original image,. Then from it RMSE is calculated as,
RMSE=√1/MN[y(i,j)-y’(i,j)]^2
Where y(i , j) is the original image, y’(i , j) is the decompressed image and M,N are the dimensions of images. Then the PSNR is defined as,
5.
RESULT
‘
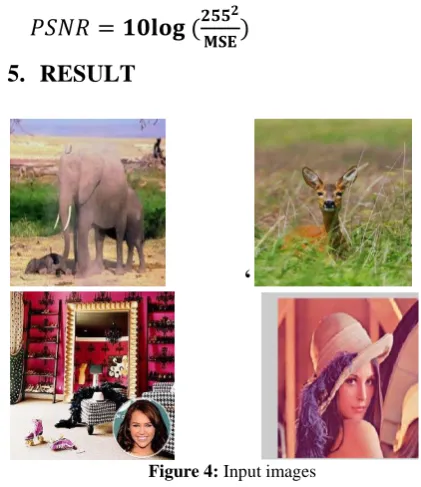
Figure 4: Input images
Standard images taken for experimentation are given in the figure
Table 1: Comparison of PSNR Values
IMAGES
PSNR VALUE
ELEPHANT
35.05
DEER
33.66
ROOM
35.97
LENA
35.55
The calculated PSNR usually adopts a dB value for quality judgement, the larger PSNR is, the higher the image quality (which means there is a little difference between cover image and decompressed image). On the contrary smaller dB value means there is a more distortion. PSNR values falling below 30dB indicate fairly a low quality. However, high quality strives for 40dB or more. The above table shows the PSNR values obtained for four different images. PSNR ratio is used to evaluate the quality of image after applying compression technique. For quality judgement PSNR usually adopts a dB value. The larger the PSNR is, the higher the image quality. On the contrary, smaller dB value means there is more distortion.
Input Image
Wavelet transform
Curvelet transform
quantizati on
Encoding
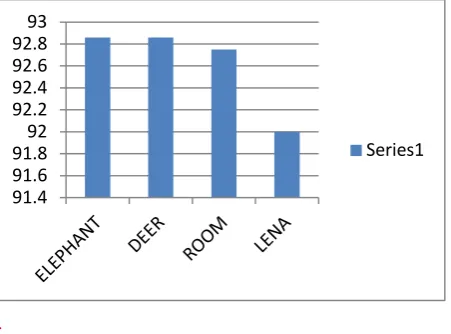
[image:3.595.311.548.398.509.2]Figure 5: PSNR comparison
[image:4.595.322.534.112.268.2]
Table 2: compression ratio values
IMAGES COMPRESSION RATIO
ELEPHANT 92.86
DEER 92.86
ROOM 92.75
LENA 92
Compression ratio is used to enumerate the minimization in image representation size produced by an image compression algorithm. The above table shows the compression ratio values in percentage of the four different input images.
.
Table 3: Mean square error values
IMAGES
Mean square error
The table shows the mean square error values for the input images. It is a unit less quantity. Lower the values higher is the image quality and vice versa.
Figure 7: Mean square error values plot
6.
CONCLUSION
The image compression has become one of the active areas in the field of image processing. This paper has proposed an image compression algorithm which uses a fusion technique which includes both wavelet and curvelet transforms. The compression ratio and the PSNR ratio have improved to a significant value after the application of the proposed technique. This may be utilized in medical and satellite imaging.
7.
REFERENCES
[1] Mansoor, A.; Mansoor, A.B.; “On Image Compression using Digital Curvelet Transform”, 9th
International Multitopic Conference, Page (s): 1 – 4, IEEE INMIC 2005
[2] Howard, P.G.; Vitter, J.S.; “Arithmetic Coding For Data Compression”
[3] T. Rammohan and K. Sankaranarayanan, ”An Advanced Curvelet Transform Based Image Compression Using Dead zone Quantization”, in EJSR, Vol.79 No: 4 (2012)
[4] Cosman, P.C.; et al.; “Using Vector Quantization For Image Processing”, in Proceedings of IEEE , Vol.81, No; 9 (1993)
[5] Gonzalez & Woods, “Digital Image Processing”, Pearson Education, 2002.
[6] Anil K. Jain, “Fundamentals of Digital Image Processing”, Prentice Hall, 2000.
[7] Cosman P.C.; et al.; “Vector Quantization of Image Subbands: A Survey”, IEEE Trans. On Image Processing, Vol.5, No; 2 (1996)
[8] Boopathy. G & Arockyasamy .S, “Implementation of Vector Quantization for Image Compression”, Global
32.5 33 33.5 34 34.5 35 35.5 36 36.5
Series1
91.4 91.6 91.8 92 92.2 92.4 92.6 92.8 93
Series1
1.5 1.55 1.6 1.65 1.7 1.75 1.8
[image:4.595.55.281.467.634.2][11] Marc Antonini et al. “Image Coding using Wavelet Transform”, IEEE Transactions on image processing , Vol.1, No.2, April 1992.
[12] Arokia Priya. R et al. “Dual Tree Wavelet Transforms in Image Compression”, International Journal of Engineering Sciences Research (IJESR), VOL. 1, NO. 1, 2011.
[13] Kiruthika. P and Thirumaraiselvi. C, “Image Compression Using Hybrid Method of Easy Path Wavelet Transform”, VOL. 2, Special Issue 1, Bonfring International Journal of Advances in Image Processing, 2012.
[14] Mikhail Shnaider and Andrew P Paplinski, “Wavelet Transform in Image Coding”, Department of Robotics and Technology, Monash University, OCTOBER 19, 1994