Base Station Localization using Artificial bee colony
Algorithm
Satvir Singh
SBS State Technical CampusFerozepur, Punjab [INDIA]
Kulvinder Kaur
SBS State Technical CampusFerozepur, Punjab [INDIA]
ABSTRACT
Wireless communication has observed gigantic advancement since the beginning of this century. The requirement of optimal use of available resources has pushed researchers towards investigation of swarm intelligence based optimization algorithms to support de-signs and planning decisions. This work, considered how to opti-mally determine locations of Base Transceiver Station (BTS), such that minimum number of BTS can be installed to cover larger num-ber of subscrinum-ber at lesser infrastructural cost. Population based Evolutionary Algorithms (EAs) are developed by modeling the be-haviors of different swarms of animals and insects, e.g., ants, ter-mites, bees, birds, fishes. These EAs can be used to obtain near optimal solutions for NP-Hard arbitrary optimization problems. Ar-tificial Bee Colony (ABC) algorithm is a metaheuristic search al-gorithm and is investigated, in this paper, to localize BTSs so as to cover maximum number of subscribers. The results are then com-pared withK-Mean clustering method.
Keywords:
Artificial Bee Colony (ABC), K-Mean Clustering, Base Transceiver Station (BTS), Mobile Station (MS), Cellular Mo-bile Communication.
1. INTRODUCTION
Cellular wireless communication is facilitated by BTSs which have an appropriate spatial distribution. Cell planning is a funda-mental and challenging part of cellular network design process. The automatic techniques that lend a helping hand to locate the optimal number of cell sites in a specified area are indispensable due to non-uniform user locations and traffic fluctuations [11]. The goal of planning primarily focuses on selection of BTS sites to maximize coverage while considering numerous baseline is-sues, e.g., traffic demand to cover a specific region, availability of BTS +sites, available channel capacity at each BTS and the ser-vice quality at various potential Traffic Demand Areas (TDAs). The exact size of the cells actually vary significantly due to sev-eral factors, including the topography of the land, anticipated number of calls in a particular area, number of obstacles, and traffic pattern of mobile users [11].
Various forms of inputs and limitations from customer in terms of spectrum availability, network dimensions, frequency plan-ning, network growth, local wireless regulations and finally RF environment itself plays an important role in coverage planning. The approach for coverage plan needs to be well defined, since it requires accommodating various phases of network growth across time without any compromise on service quality goal [4].
When the cellular concept was first proposed, BTS locations were usually selected according to a regular reuse pattern [1]. With the growth of cellular technology, it is becoming increas-ingly important for any cellular operator to have a network which is not only better in terms of quality of service than its competi-tors but also is more profitable than the others. The cost involved in setting up a network and the quality of the service offered is directly proportional to the number of BTS installed, more BTS, more is the cost but better coverage at more infrastructural cost [12].
In the increasingly competitive wireless industry, optimization offers the means to achieve good quality solution consistently. While deploying a network, the optimization phase is followed immediately after the new frequency plan is introduced. Several teams of field personnel undertake extensive drive testing around each site making a number of calls, concentrating on testing and the handovers between each cell. Each call is investigated and identified problems are resolved by classical methods [12].
Drive-testing methodology is used by most network operators so as to identify the areas within the network for improve-ment through optimization. This method of network perfor-mance measurement is very important for comparing the per-formance of network under test with competitor’s network [3].
The placement of BTSs is a tedious job for network designers, the reason being the frequency channels become increasingly congested and propagation environments become more complex [9]. Suboptimal placement of BTS will result in not only expen-sive deployment costs, but a reduction in spectrum efficiency due to interference which could be devastating to a service provider considering the cost of spectrum license. In order to cope with the need of rapid wireless systems deployment, significant re-search efforts have been put into develop advance wireless plan-ning techniques over the past few years [9].
The problem considered in this paper is to determine the opti-mal locations of BTSs to meet traffic demands. Optiopti-mal cov-erage with minimum number of BTSs is essentially a resource allocation/optimization problem. The received power, path loss and attenuation are main parameters of considerations during the optimization. Artificial Bee Colony (ABC) algorithm is a meta-heuristic search algorithm and is investigated, in this paper, to localize BTSs so as to cover maximum number of subscribers. The results are then compared withK-Mean clustering method. K-means is one of traditional unsupervised learning algorithms that are useful in solving clustering problems.
ded-icated to ABC and K-Mean clustering algorithms, respectively. In section 6, comparative simulation results obtained with ABC and K-Mean clustering algorithm, are presented for comparative analysis. Finally, drawn conclusions and future scope have been discussed in section 7.
2. NETWORK PLANNING
The factors that make BTS Planning a costly affair can be summed up as follows [3]: firstly, if cell planning stage extends longer, then the overall development cost of the project goes up due to time dependency of the work. Secondly, the cost of setting up a new BTS includes the cost of hiring/buying land, RF ca-bles, shelter for equipment, antennas, power sources, and main-tenance. Lastly, the invaluable time factor that is involved for a perfect plan.
2.1 Cell Pattern
In cellular communication, systems the area to be covered is di-vided into a number of smaller areas known as cells, with each cell being served by a fixed radio site, called BTS. The cells are drawn for convenience as hexagons. The edges of the hexagons represent the theoretical equal power boundaries between cells, assuming that every BTS radiates the same power, propagation is homogenous in every cell and all BTS are similarly sited in ei-ther the center or at one corner of every cell. However, the reality of the coverage pattern will be some what different and can be fully determine using propagation planning tools coupled with a detailed study of the service area and fields measurement.
2.2 Base controller Station
It is a high-capacity switch that provides functions such as han-dover, cell configuration data, and control of radio frequency (RF) power levels in BTS. Base Controller Station (BSC) can be implemented as a stand-alone node or many BTSs in integration with the Mobile Switching Center (MSC). The BSC provides all the control functions and physical links between MSC and BTS.
2.3 Parameters
The fitness of a solution is decided on the basis of three main parameters: (a) Power received (b) Attenuation and (c) Path loss. Further parameters under consideration for the path loss are: (1) Transmit power 500 mW (2) Frequency 850 MHz and (3) Base Station antenna height (20 - 200 m) [6].
3. ARTIFICIAL BEE COLONY ALGORITHM
ABC algorithm, introduced by Karaboga in 2005 [7], is a meta-heuristic algorithm for numerical optimization inspired from in-telligent foraging behavior of honey bees. Honey bee swarm allocates tasks dynamically and adapts itself in response to changes in the environment in a collective intelligent manner. Population based Evolutionary Algorithms (EAs) are developed by modeling the behaviors of different swarms of animals and insects, e.g., ants, termites, bees, birds, fishes. These EAs can be used to obtain near optimal solutions for NP-Hard arbitrary opti-mization problems. Biological honey bees have many intelligent features, e.g., photographic memories, space-age sensory, navi-gation systems, group decision making process during selection of their new nest sites, queen and brood tending, storing, retriev-ing and distributretriev-ing honey and pollen, communication and for-aging etc. These all characteristics are incentive for researchers to model the intelligent behaviors of bees artificially and solve engineering problems [7].
ABC algorithm uses a colony of artificial bees. The bees are classified into three types: 1. Employed bees, 2. Onlooker bees, and 3. Scout bees. Each employed bee is associated with a food
source, which it exploits currently. A bee waiting in the hive to choose a food source is an onlooker bee. The employed bees share information about the food sources with onlooker bees in the dance area. A scout bee, on the other hand, carries out a ran-dom search to discover new food sources.
In a robust search process, exploration and exploitation must be carried out together. In the ABC algorithm, the scout bees are in charge of the exploration process, while the employed and onlooker bees carry out the exploitation process.
In the algorithm, one half of the population consists of employed bees and the other half consists of onlooker bees. The number of food sources equals the number of employed bees. During each cycle, the employed bees try to improve their food sources. Each onlooker bee then chooses a food source based on the nec-tar amount available at that food source. An employed bee whose food source is exhausted becomes a scout bee. The scout bee then searches for a new food source [10].
The position of a food source represents a solution for an opti-mization problem. The nectar amount of the food source is the fitness of the solution. Each solution is represented using aD -dimensional vector. Here,Dis the number of optimization pa-rameters. Initially, SN solutions are generated randomly, where SN equals the number of employed bees. Let MCN be the max-imum number of cycles that the algorithm would run. During each cycle, the employed and onlooker bees improve the solu-tions through a neighborhood search. A new solutionviin the neighborhood of an existing solutionxiis produced as follows:
vij=xij+ Φij(xij−xkj) (1) wherek=1, 2, ..., SN andΦis a random number between [-1, 1] andj=1, 2,...,D. k andj are chosen randomly. A greedy selection is then performed betweenxiandvi.
The onlooker bees are placed on food sources using the roulette wheel selection method [5]. An onlooker bee thus chooses a food source at positionxiwith a probabilitypicalculated as follows:
pi= f iti
PSN n=1f itn
(2)
Here,f itiis calculated using the following equation:
f iti=
( 1
1+f i iff i≤0
1 +abs(f i) iff i≥0 (3)
wherefiis the fitness value of the solution.
A solution representing a food source is abandoned by an em-ployed bee if it cannot be improved for a predetermined number of trials given by the parameter limit. The employed bee then be-comes a scout bee and randomly produces a new solution replac-ing the existreplac-ing solution. The value of limit is generally chosen as. SNxD.
ABC Algorithmic Flow
1: Generate the initial solutions (positions of food sources) ran-domly and evaluate them.
2: For each solutionxi, determine a neighborviusing (1) and perform a greedy selection betweenxiandvi.
3: Calculate the probabilities for the solutions using (2). 4: Use the roulette wheel selection method to place the
onlook-ers on the food sources and improve the corresponding solu-tions (as in step 2).
5: Determine the abandoned solution (if any) and replace it with a new randomly produced solution.
6: Record the best solution obtained till now.
4. K-MEANS CLUSTERING ALGORITHM K-means is one of traditional unsupervised learning algorithms that are useful in solving clustering problems. The procedure fol-lows a simple and easy way to classify a given data set through a certain number of clusters (assumeKclusters) fixed apriori. The main idea is to defineKcenters, one for each cluster. These centers should be placed in a cunning way because of different location causes different result. So, the better choice is to place them as much as possible far away from each other [8]. The next step is to take each point belonging to a given data set and asso-ciate it to the nearest center. When no point is pending, the first step is completed and an early group age is done. At this point we need to re-calculateKnew centroids as barycenter of the clus-ters resulting from the previous step. TheseKnew centroids, a new binding has to be done between the same data set points and the nearest new center. A loop has been generated. As a result of this loop may notice that theKcenters change their location step by step until no more changes are done or in other words centers do not move any more. Finally, this algorithm aims at minimiz-ing an objective function know as squared error function given by (4)
J(V) = c
X
i=1
ci
X
j=1
(kxi−vjk)2 (4)
wherekxi−vjkis the Euclidean distance betweenxiandvj. 0c0
iis the number of data points inithcluster.0c0is the number of cluster centers [2].
The basic step ofK-means clustering is simple. In the beginning, number of clusterKare determined and assume the centroid or center of these clusters. Take any random objects as the initial centroids or the firstKobjects can also serve as the initial cen-troids. If the number of data is less than the number of cluster then assign each data as the centroid of the cluster. Each centroid will have a cluster number. If the number of data is bigger than the number of cluster, for each data, calculate the distance to all centroid and get the minimum distance. This data is said belong to the cluster that has minimum distance from this data. Since this is not sure about the location of the centroid, adjust the cen-troid location based on the current updated data. Then assign all the data to this new centroid. This process is repeated until no data is moving to another cluster anymore. Mathematically this loop can be proved convergent.
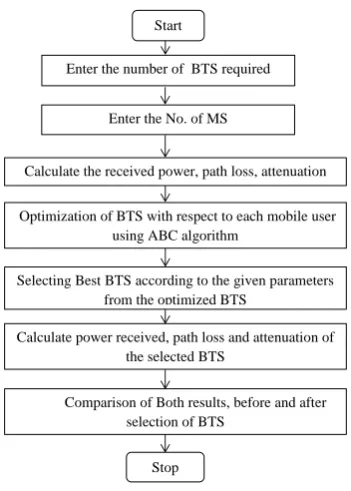
5. PROBLEM STATEMENT
The main objective of the present work paper is to optimally locate of BTSs, so that minimum number of BTS can be in-stalled to cover larger number of subscribers at lesser infrastruc-tural cost. The problem of optimization of BTS locations can thus be stated as: Given an area to cover on with potential sub-scriber density distribution, identify the optimal cell geometry and locations of BTSs. Our problem is to optimize BTS loca-tions with respect to each MS using ABC algorithm. Artificial Bee Colony (ABC) algorithm is a metaheuristic search algorithm and is investigated, in this paper, to localize BTSs so as to cover maximum number of subscribers. The results are then compared withK-Mean clustering method. The received power, path loss and attenuation are main parameters of considerations during the process of optimization. According to the given parameters best BTSs are selected from the optimized BTS locations.
The fitness of a solution is decided on the basis of three main parameters: (a) Power received,Pr, (b) Path loss,Lp, and (c) Attenuation,A, using (5), (6) and (7)
Pr= 10 log10(Pt)−abs(Lp) (5)
Start
Enter the number of BTS required
Enter the No. of MS
Calculate the received power, path loss, attenuation
Optimization of BTS with respect to each mobile user using ABC algorithm
Selecting Best BTS according to the given parameters from the optimized BTS
Calculate power received, path loss and attenuation of the selected BTS
Comparison of Both results, before and after selection of BTS
[image:3.595.320.496.103.349.2]Stop
Fig. 1. Flowchart for Selecting an Optimal Number of BTS Locations
Lp= 66.55 + (26.16) log10f−13.82 log10hBT S−3.2 log1011.75hM S +44.9−6.55 log10hBT Slog10d
(6)
A= 42.6 + 20 log10f+ 26 log10d (7)
Path loss is determined based on three parameters. viz. (1) Trans-mit powerPt=500 mW (2) Frequencyf=850 MHz and (3) BTS antenna heighthBT S= 20m to 200 m and (4) Mobile station an-tenna heighthM S = 1m to 10 m anddis distance between MS and BTS [6].
The ABC algorithm requires a number of parameters to be ini-tialized, namely: number of bees, number of food patches se-lected for neighborhood searching, number Sof employed bees (same as food sources), number of onlooker bees, limit for an employed bee to become scout, and the stopping criterion.
6. RESULTS AND SIMULATION
red color are shown in fig. 2. Maximum fitness, F, is achieved given by equation (8).
F= 1
LpAabs(Pr) (8)
The ABC algorithm parameters are chosen to be: colony size (number of bees) as 100, number of employed bess/ food patches as half of the colony size, number of iterations as 50 number of runs as 10.
v
100
90
80
70
60
50
40
30
20
10
0
0 10 20 30 40 50 60 70 80 90 100
[image:4.595.346.521.104.288.2]Mobile Station BTS
Fig. 2. Random locations for BTS and MS
100
90
80
70
60
50
40
30
20
10 0
0 10 20 30 40 50 60 70 80 90 100
Mobile Station
Optimized BTS
Fig. 3. Optimal Locations of BTS using ABC algorithm
7. CONCLUSION
The aim of this paper consists of a new calculation tool based on particles swarm (ABC algorithm). This approach makes it possi-ble to efficiently determine the optimal location of BTS, avoid-ing the greedy exhaustive search. The proposed work has ability to achieve optimal solution of coverage problem with minimum number of BTS in cellular networks. This approach cultivates an innovative is idea in employing the ABC algorithm with en-hanced fidelity. The results show that the ABC approach is effec-tive and robust for efficient coverage problem of BTS location
100
90
80
70
60
50
40
30
20
10
0
0 10 20 30 40 50 60 70 80 90 100
Mobile Station
Optimized BTS
[image:4.595.76.261.204.384.2]Fig. 4. Optimized BTS Locations using K-Mean Clustering
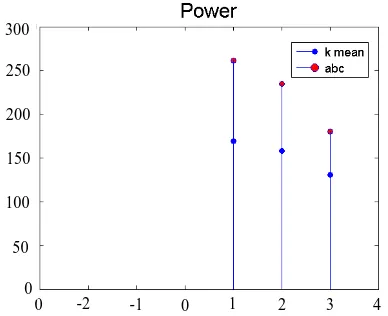
Table 1. Comparison of result parameters between ABC and K-Mean clustering algorithm
Parameters Using ABC algorithm
Using K-Mean Clustering
Power
283.9246 152.8102
416.4617 165.9201
361.7834 130.4528
Path - loss
-309.0008 -165.5995
-443.4617 -172.2860
-388.7834 -137.6200
0 5 10 15 20 25 30 5
35 40 45 50 1.01
[image:4.595.326.526.355.618.2]1.015 1.02 1.025 1.03
Fig. 5. Fitness Vs. Iterations using ABC algorithm
and is considered to give almost the optimal solution in wireless communication network. In future, focus can be given to achieve 100% coverage with minimum number of BTS. The study of the 100% coverage using various optimal search techniques also presents several interesting challenges.
8. REFERENCES
[image:4.595.83.254.444.625.2]0 -2 -1 0 1 2 3 4 0
[image:5.595.72.266.111.269.2]50 50 50 100 150 200 0 250 300
Fig. 6. Power Comparison b/w ABC and K-Mean clustering algorithm
[2] E.Y. Chan, W.K. Ching, M.K. Ng, and J.Z. Huang. An op-timization algorithm for clustering using weighted dissimi-larity measures.Pattern recognition, 37(5):943–952, 2004. [3] I. Demirkol, C. Ersoy, M.U. Caglayan, and H. Delic¸. Lo-cation area planning and cell-to-switch assignment in cel-lular networks.Wireless Communications, IEEE Transac-tions on, 3(3):880–890, 2004.
[4] J. Fan. Using genetic algorithms to optimise wireless sen-sor network design. cJin Fan, 2009.
[5] D.E. Goldberg and K. Deb. A comparative analysis of selection schemes used in genetic algorithms. Urbana, 51:61801–2996, 1991.
[6] M. Hata. Empirical formula for propagation loss in land mobile radio services.Vehicular Technology, IEEE Trans-actions on, 29(3):317–325, 1980.
[7] D. Karaboga and B. Basturk. A powerful and efficient al-gorithm for numerical function optimization: artificial bee colony (abc) algorithm.Journal of Global Optimization, 39(3):459–471, 2007.
[8] A. Likas, N. Vlassis, and J. J Verbeek. The global¡ i¿ k¡/i¿-means clustering algorithm. Pattern recognition, 36(2):451–461, 2003.
[9] R. Mathar and T. Niessen. Optimum positioning of base stations for cellular radio networks. Wireless Networks, 6(6):421–428, 2000.
[10] H. Narasimhan. Parallel artificial bee colony (pabc) algo-rithm. InNature & Biologically Inspired Computing, 2009. NaBIC 2009. World Congress on, pages 306–311. IEEE, 2009.
[11] W. Singh and J. Sengupta. An optimized approach for se-lecting an optimal number of cell site locations in cellular networks.International Journal of Computer Applications, 40(8):10–16, 2012.