© 2018, IRJET | Impact Factor value: 6.171 | ISO 9001:2008 Certified Journal | Page 2139
Performance Based Seismic Design of RC Building with Consideration Of
Soil Structure Interaction
2
M. Tech. Student (Structures)
Dept. of Applied Mechanics, GCOE Amravati (MS, India)
---
Abstract
– Current seismic procedure and codes do not fulfillthe requirement of seismic resistant building. Present design practice for dynamic loading assumes the building to be fixed at their bases. Whereas, in reality, supporting soil medium allows movement to some extent due to their natural ability to deform which decrease the overall lateral stiffness of the structure. This paper presents the effect Soil Structure interaction on seismic performance of the structure is considered and designed the building for Life safety performance objective. Six storey building with and without considering soil-structure interaction (SSI). The RC building symmetric plan and total height 18 m, located in seismic zone v, shallow foundation is considered. These buildings are modeled, designed as per IS 456:2000 and analyzed using SAP2000 software under two different boundary conditions, namely fixed-base, and considering soil-structure interaction Nonlinear dynamic analysis with seven time history records are used for analysis with user defined hinge properties used in X-Y direction[10,11]. There are four types of model analysis and studies are done-(1) Fixed base model with no soil structure interaction (Model NSSI), (2) Rigid footing rest on hard soil with considering SSI (Model HSSI), (3) Rigid footing rest on medium Soil with considering SSI (Model MSSI), (4) Rigid footing rest on soft soil with considering SSI (Model SSSI). Performance analysis was carried out and results obtained using Soil structure interaction. A comparative study is done between HSSI, MSSI, SSSI models with fixed base model (NSSI). The average of seven peak responses of story drift ratio, storey shear and natural period is considered. After that design is carried out for desired performance objective. It was found that soil-structure interaction can alter the seismic performance of the building in terms of seismic force demands and deformations.
Keywords
– Performance based seismic design, Soil structure interaction, Time History analysis, Natural Period, Storey shear, Storey drift ratio.1. INTRODUCTION –
In last few years disaster due to earthquake gave the picture of failures of structures occurred even after building was design as per force based approach. It significantly shows inability to provide minimum performance of structure under design earthquake. The performance based seismic design (PBSD), evaluates how the buildings are likely to perform under a design earthquake. As compared to force-based approach, PBSD gives a methodology for assessment of the seismic performance of a building, ensuring life safety and minimize economic losses.
In last years the importance of Soil Structure Interaction (SSI) on earthquake response of structure has more appealing and intensive. The soil flexibility is the main problem for high rise structure when they constructed over soft or medium soil strata. The dynamic parameters (fundamental natural period, storey shear , storey drift etc) of the structure significantly altered due to soil flexibility. During an earthquake, seismic force demand and deformation characteristics of structure and soil components of the footing of building can alter or change more significantly.
Soil structure interaction is In an earthquake, seismic waves are propagated through the soil medium to a structure of. Many researcher and engineers have firstly deal with the development of different modeling procedures and give a simple solution to implementation of the SSI in performance based analysis.
The literature shows considerable research in PBSD and SSI. Some of correlated works are discussed below:
[Shehata E. et al]1 The authors studied the effect of SSI on
multistory building rest on raft foundation and analyzed with three analysis method. The result shows that storey drift and fundamental period increased as soil spring stiffness decreases. Finally, they concluded that structure rest on soft soil and medium soil has more significant effect on seismic response than stiff soil.[ I. Kraus & D. Džakić ]2
Prof. Dilip J.Chaudhari
1, Nikhil N. Chopade
21
Professor
---
© 2018, IRJET | Impact Factor value: 6.171 | ISO 9001:2008 Certified Journal | Page 2140 The authors analyzed the structure with three different end
conditions –Structure rest on -fixed base, Winkler springs and half space, they found storey drift and natural period much more for soft soil especially for Winkler springs model. [M.D.L. Millen et al]3 The authors mainly focused on the
effects of SSI and carried out performance based design of building resting on flexible and rigid foundation. It has been observed that local deformation effect of SSI should be introduced into design procedure. [Hamid Reza et al]4 Study
carried out on high rise building which is rest on soft soil strata wit time history analysis. It has been observed that performance level can be change. The lateral deformation significantly increases in no SSI, with SSI for elastic and, inelastic behavior of structure. [Yahiaoui Djarir & Kadid Abdelkrim]5 Study carried on low and high rise building with
gap spring supported model and 3D Time history analysis is carried out. A Comparative study between vertical ground motions with SSI shows increases deformation demand and lowering seismic force demand. [Behzad Fatahi]6 Studied on
15 storey building was first analyzed with as per code procedure to optimize the sections of the building then time history analysis is carried out, a comparative study between fixed base model and SSI considered model indicates performance objective life safety changes from collapse. Also inter storey drift significantly increases for low shear wave velocity. [D chaudhari, G dhoot]7 The authors study PBSD
with pushover analysis. Assumed that base is fixed. Result obtained shows the Performance based seismic design provides reliable methodology for seismic up-gradation, determine yielding of the components of a building, possible mode of failure.[D chaudhari , S More]8 Study has been
carried out on six storey fixed base building with time history analysis. Result shows that Performance based seismic design with time history analysis provides reliable methodology for seismic up gradation, determine yielding of the components of a building, possible mode of failure more accurately than pushover analysis. From the literature, PBSD of building gave the fairly accurate performance of building but this analysis not so accurate. Because they assumes the building to be fixed at their bases. Whereas, in reality, supporting soil medium allows movement to some extent due to their natural ability to deform which decrease the overall lateral stiffness of the structural system resulting in the lengthening of lateral natural periods. Such lengthening of lateral natural periods does considerably change the seismic response of building frames. So it is necessary to add the effects of SSI into the analysis to obtain more accurate performance of the structure. So the present work focused on analysis and performance based design with considering SSI.
2. IDIALIZATION OF METHODOLOGY
2.1 Performance Based Design –
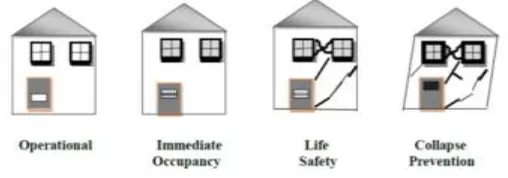
[image:2.612.320.574.242.331.2]Performance based seismic design is a procedure of designing new buildings or seismic up-gradation of existing buildings, which includes a specific intent to achieve defined performance objectives in future earthquakes.. Performance objectives are operational (O), immediate occupancy (IO), life safety (LS), collapse prevention (CP), as per FEMA356 in which Life safety is the major focus to reduce the threats to the life safety of the structure in Figure 1.
Figure - 1 Performance levels
In performance based design approach, performance levels are described in terms of displacement as damage is better correlated to displacements rather than forces. This is based on the idea that performance objectives can be related to the level of damage to the structure, which in term can be related to displacement and drift. Figure 2 shows the typical process of design is to be followed.
[image:2.612.344.555.473.665.2]
---
© 2018, IRJET | Impact Factor value: 6.171 | ISO 9001:2008 Certified Journal | Page 2141 2.2 Soil-Structure Interaction –
Soil-Structure Interaction (SSI) is the considered effect of free response of structures caused by the flexibility of the foundation soils. The SSI can induce two distinct effects on the response of the structure, first, modification of the free field motion at the base of the structure, and second, the introduction of deformation from dynamic response of the structure into the supporting soil. The former is referred to as kinematic interaction, while the latter is known as inertial interaction.
There are two methods of implementing soil structure interaction. First is the direct method in which the soil structure and foundation is represented as a continuum and modeled together using finite element method. The ground motion is specified as free field motion and is applied at all boundaries. Second method is the substructure method in which soil material properties are used for incorporation of springs to represent the stiffness at the soil foundation interface. The general substructure method is suitable to complex structural idealizations, with the soil region idealized as a semi-infinite continuum or as a finite element system. For sites where essentially similar soils extend to large depths without a rigid boundary such as a soil rock interface. Sub-structure method is computationally more efficient than the direct method as most of the disadvantages of the direct method can be removed, if the substructure method is employed.
2.3 Proposed Work –
The present study on medium rise building is taken into consideration. Firstly building is modeled and preliminary analysis by using SAP2000 v19 and design carried out as per IS 456:2000. Then performance analysis is carried out by nonlinear dynamic analysis and designed the building for desire performance. In this study building is designed for Life safety and DBE (Design based earthquake)
2.3.1 Structural modeling and Analysis -
A ground plus Six storey RC frame building situated in zone V is taken for purpose of the study. It consists of 3 bays of 4m each in X-direction and 3 bays of 5m each in Y-direction. The total height of the building is 18 m. The building is designed and modeled as per IS 456: 2000. Subsequently the analysis and design has been carried out for a building with the symmetric geometry plan and elevation as shown in figure 3, resting on various soil types for shallow foundations in Zone V. Four types of foundation models viz. - (1) Fixed base model with No soil structure interaction (Model NSSI), (2) Hard soil base with considering SSI (Model HSSI), (3) Medium Soil base with considering SSI (Model MSSI), (4) Soft Soil base with considering SSI (Model SSSI). Performance
analysis is carried out and results are obtained using Soil structure interaction. Results of flexible base models (HSSI, MSSI, SSSI) are compared with the fixed base model (NSSI). Concrete frame elements are classified as beam and column frames. In the present study moment resistant frame is used Columns and beams are modeled using 3D frame elements. Slabs are as rigid diaphragms. The beam-column joints are assumed to be rigid. In SAP2000 V19 default hinge properties available as per the ASCE41, ATC-40 are assigned to the beam and column. Auto moment hinge M3 is assigned to beams; auto axial and moment hinges PM2M3 are assigned to columns.
2.3.1.1 Material Properties:
1. Concrete grade M 25
2. Reinforcement steel grade Fe-415
Properties of material are taken as per IS 456:2000
2.3.1.2 Section Properties:
Section properties for first trial are taken as per follow: Size of Beam = 230mm x 380mm
Depth of Shallow footing = 1.5 m Thickness of Slab = 125mm
Table No 1 - Detail of column and footing sizes
Column Position Column sizes Footing sizes Exterior Column 450x450 1.85 X 1.85 m Interior Column 500x500 2.2 m X 2.2 m
2.3.1.3 Loading Considered
i. Density of concrete = 25 KN/m3
---
© 2018, IRJET | Impact Factor value: 6.171 | ISO 9001:2008 Certified Journal | Page 2142 Figure 3 - SAP Model of proposed building supported on
soil stiffness springs
2.3.1.4 Non Linear Dynamic Analysis –
Nonlinear dynamic analysis is the most comprehensive method for seismic analysis. The earthquake record in the form of acceleration time history is input at the base of the structure. The response of the structure is computed at each second for the entire duration of an earthquake. Selection and scaling of ground motion data from the PEER Database, all to match target response spectrum of soil type I defined according to IS 1893:2002. Those ground motions is modified and scaled on PEER web base tool by minimize MSE (Computed weighted mean squared error of record, and suite average, w.r.t target response spectrum). Using SAP2000 v19 computer aided code-based program the seven scaled ground motions were selected for conducting the analysis. Earthquake events used in present study are 1.Imperial Valley 02, 2.Kern County 3. Northern Calif03, 4. San Fernando, 5. Friuli- Italy-01, 6. Tabas-Iran, 7. Imperial Valley06. Acceleration ground motions for above earthquake shown in figure 4.
Figure 4 - Acceleration ground mothion in X and Y direction for seven earthquake event respectively.
The average results of seven time history records is taken. Time history analysis carried out with previous nonlinear case stiffness and P-Δ effects are also incorporated in TH analysis and later on checked the performance level whether assumed desire performance objective is achieved or not if not then revised design. Load combinations are taken as per IS 1893:2002 and IS 456:2000
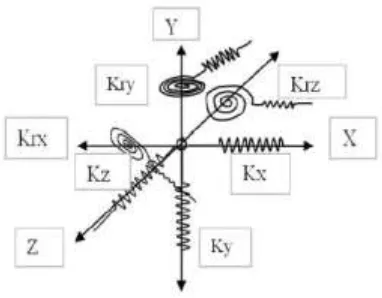
2.3.2 Soil Idealization -
In this present paper, substructure method is used for the implementation of SSI into analysis. The movement about three axes has been considered. Shallow isolated footing resting on varying soil types, three translational stiffness springs has been applied in two horizontal directions and one vertical direction i.e X-Y-Z direction respectively and similarly three rotational stiffness springs has been applied in X-Y-Z direction. To add SSI into the analysis, soil spring stiffness equations have been taken from FEMA356 (George Gazetas 1991). The Figure 5 shows the translational and rotational spring in X Y Z direction.
Figure 5 - Spring system at the foundation.
2.3.3 Soil classification and Properties :
[image:4.612.46.537.366.745.2]Soil classification has taken into consideration the importance of local site effectas as per IS code 1893 Part I-2002. The type of soil, mainly constituting the foundation is categarized into three type and parameters are considered from Jain and Murthy, IITK-GSDMA- EQ13 report.
Table 2 : Detail of soil parameter considered
Soil
[image:4.612.352.543.395.544.2]---
© 2018, IRJET | Impact Factor value: 6.171 | ISO 9001:2008 Certified Journal | Page 2143 velocity
(m/s) N/m
3) (KN/m2)
Hard
Soil 600 ≥30 20 0.290 7.2 X 10 6
Mediu
m Soil 320 10 to 30 18 0.39 1.84 X 10 6
Soft Soil
150 ≤ 10 16 0.4 360 X 103
[image:5.612.314.562.107.523.2]Shear modulus (G) = Mass density X (Shear wave velocity)2
Table 3– Stiffness equations of foundation at surface[11]
The above equations give stiffness of soil when the footing is at surface level. For embedment depth, correction factors have been used to get modified stiffness (Kemb = β Ksur)
Figure 6 - Orientation of footing w.r.t axes.(11)
Table 4 –Correction factor equations[11]
d = Height of effective sidewall contact (may be less than total foundation height)
h = Depth to centroid of effective sidewall contact. For each degree of freedom, calculate Kemb = β Ksur
Figure 7 - Description and meaning of h, d, D for shallow footing. (11)
3. Result and Discussion –
After the time history analysis comparative study is carried out for Inter story drift, storey shear, Fundamental natural period and design for life safety level for different model considered.
[image:5.612.41.293.222.547.2]---
© 2018, IRJET | Impact Factor value: 6.171 | ISO 9001:2008 Certified Journal | Page 2144 3.1 Inter story drift –
Inter story drift (ISD) limitation is given by IS 1893:2000. It should not greater than 0.4% of total height of the building. For present work considered building model results shows that ISD is within acceptable limit. The change in ISD for 6 storey building for different model considered in X and Y direction as shown in figure 8-9.. ISD for SSSI model is 45.6% and 40% more than NSSI model in X and Y direction respectively. Similarly, ISD for MSSI and HSSI is increased by 38 %, 15.5 %, 11.80 % and 3.26 % more than NSSI model in X and Y direction respectively. ISD is more significant for 2,3,4 storey level. Result clearly shows that as soil stiffness decreases the ISD increase.
[image:6.612.314.583.195.350.2]Figure 8 - Inter storey drift in x direction for all considered base models
Figure 9 - Inter storey drift in Y direction for all considered base models.
3.2 Fundamental time period –
[image:6.612.36.300.290.433.2]The fundamental time period depends on the stiffness of building load resisting system and height of the building. The inclusion of SSI into analysis leads to change in fundamenta time period. From the figure 10 shows that inclusion SSI into analysis tends to increases fundamental time period by 1.30%,4.6% and 12% for HSSI model, MSSI model, and SSSI model respectively. Increase in the fundamental time period is more significant for SSSI model.
Figure 10 - Fundamental natural period for all considered base models
3.3 Storey shear –
This study has been carried out to understand the performance of building with the inclusion of SSI effect. The of response structure in the form of storey shear over the story levels of the building is carried out. The SSI incorporation effect on the storey shear for 6 storey building has been shown in below figure 11-1 in X and Y direction and compared result for NSSI model with SSI models. Results show that storey shear for SSSI model is more than MSSI model, HSSI model, and NSSI model. Percentage decrease in storey shear w.r.t NSSI model is 9.46 %, 12.86 % and 16.21 % for HSSI model, MSSI model, and SSSI model respectively. As the soil spring stiffness decreases the storey shear also decreases.
0
1 2 3 4 5 6 7
0 0.005 0.01 0.015
Sto
re
y
Inter Storey Drift
NSSI Model
HSSI Model
MSSI Model
SSSI Model
0 1 2 3 4 5 6 7
0 0.005 0.01 0.015
Sto
re
y
Inter Storey Drift
NSSI Model
HSSI Model
MSSI Model
SSSI Model
0 0.2 0.4 0.6 0.8 1 1.2 1.4 1.6 1.8
0 5 10 15
N
at
u
ra
l Per
io
d
(S
ec)
Modes
[image:6.612.35.299.483.630.2]---
© 2018, IRJET | Impact Factor value: 6.171 | ISO 9001:2008 Certified Journal | Page 2145 Figure 11 - Storey shear in X Direction for all considered
[image:7.612.38.287.86.234.2]base models
Figure 12 - Storey shear in Y Direction for all considered base models
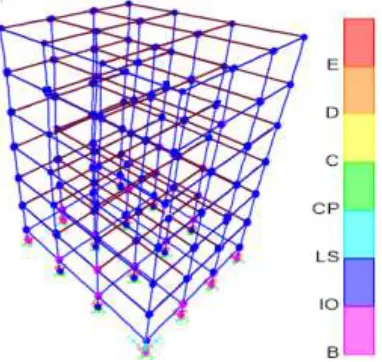
3.4 Plastic Hinges Results :
Figure 13 - Plastic hinges formation for fixed base model(NSSI)
[image:7.612.351.542.209.390.2]Hinges shows the location of the weak point and failure modes while in seismic excitation are identified. The exact position of plastic hinges is forecast by using time history analysis for all ground motions with help of SAP2000 output as shown in Figure 13-14. Plastic hinges are generated in the column and beam shows blue color as per SAP2000 output the hinges are in life safety performance level. However, some hinges are in immediate occupancy level but no one hinge go beyond life safety level so desire life safety objective is to achieve for deigning of the building.
Figure 14 - Plastic hinges formation for Soft Soil base model(SSSI)
3.5 Performance based Seismic design –
After a number of trials of sections, the final life safety level design is arrived:
[image:7.612.35.300.274.427.2]For Column:
Table No 5 – Reinforcement in column
Reinforcement in mm2 (NSSI model)
Storey Section Sizes CC MC OCMC
6 Column 400x400 1280 1280 1280
5 Column 400x400 1350 1650 2050
4 Column 400x400 1723 2535 2725
3 Column 400x400 2200 3620 3500
2 Column 400x400 2700 5150 4450
1 Column 450x450 4562 6200 5620
Average reinforcement 2303 3406 3272 Reinforcement in mm2 (HSSI model)
Storey Section Sizes CC MC OCMC
6 Column 400x400 1280 1280 1280
5 Column 400x400 1340 1600 2030
4 Column 400x400 1636 2508 2698
0 2 4 6 8
0 1000 2000 3000
Sto
re
y Le
ve
l
Storey Shear
NSSI Model
HSSI Model
MSSI Model
SSSI Model
0 1 2 3 4 5 6 7
0 1000 2000 3000
Sto
re
y Le
ve
l
Storey Shear
[image:7.612.55.582.484.746.2]---
© 2018, IRJET | Impact Factor value: 6.171 | ISO 9001:2008 Certified Journal | Page 2146
3 Column 400x400 1960 3250 3170
2 Column 400x400 2713 4690 4200
1 Column 450x450 4540 6000 5500
Average reinforcement 2245 3223 3146
Reinforcement in mm2 (MSSI model)
Storey Section Sizes CC MC OCMC
6 Column 400x400 1280 1280 1280
5 Column 400x400 1340 1600 2030
4 Column 400x400 1636 2508 2698
3 Column 400x400 1960 3475 3365
2 Column 400x400 2713 4690 4300
1 Column 450x450 4213 5506 5000
Average reinforcement 2190 3177 3113
Reinforcement in mm2 (SSSI model)
Storey Section Sizes CC MC OCMC
6 Column 400x400 1155 1155 1188
5 Column 400x400 1171 1462 1816
4 Column 400x400 1420 2440 2577
3 Column 400x400 1700 3250 3170
2 Column 400x400 2662 4930 4200
1 Column 450x450 3700 5090 4613
Average reinforcement 1968 3055 2928
From the design, we observed that the reinforcement percentage gradually decreases for NSSI model to SSSI model (11.57 %, 5.58 %, 4.1% for SSSI model, MSSSI model, HSSI model, respectively corresponding to NSSI model). As seismic force demand decreases, the reinforcement area also decreases.
[image:8.612.31.573.64.733.2]For Beam-
Table No 6 – Reinforcement in the beam
Reinforcement in beam for for NSSI model
Storey Section Sixes Steel
6 Beam 230x300 530(Top)
400(Bottom)
5 Beam 230x380 985(Top)
855(Bottom)
4 Beam 230x380 1450(Top)
1284(Bottom)
3 Beam 230x380 1820(Top)
1655(Bottom)
2 Beam 250x380 2280(Top)
2110(Bottom)
1 Beam 250x380 2300(Top)
2200(Bottom)
Plinth Beam 230x280 1543(Top)
1400(Bottom) Reinforcement in beam for HSSI model
Storey Section Steel
6 Beam 230x300 576(Top)
409(Bottom)
5 Beam 230x380 1010(Top)
871(Bottom)
4 Beam 230x380 1430(Top)
1275(Bottom)
3 Beam 230x380 1805(Top)
1640(Bottom)
2 Beam 250x380 2300(Top)
2040(Bottom)
1 Beam 250x380 2133(Top)
1950(Bottom)
Plinth Beam 230x280 1500(Top)
1371(Bottom) Reinforcement in beam for MSSI model
Storey Section Steel
6 Beam 230x300 534(Top)
390(Bottom)
5 Beam 230x380 932(Top)
800(Bottom)
4 Beam 230x380 1330(Top)
1155(Bottom)
3 Beam 230x380 1750(Top)
1540(Bottom)
2 Beam 250x380 2242(Top)
1960(Bottom)
1 Beam 250x380 2120(Top)
2073(Bottom)
Plinth Beam 230x280 1442(Top)
1281(Bottom) Reinforcement in beam for SSSI model
Storey Section Steel
6 Beam 230x300 520(Top)
384(Bottom)
5 Beam 230x380 948(Top)
816(Bottom)
4 Beam 230x380 1330(Top)
1157(Bottom)
3 Beam 230x380 1722(Top)
1471(Bottom)
2 Beam 250x380 1972(Top)
1690(Bottom)
1 Beam 250x380 2100(Top)
1863(Bottom)
Plinth Beam 230x280 1380(Top)
1228(Bottom)
---
© 2018, IRJET | Impact Factor value: 6.171 | ISO 9001:2008 Certified Journal | Page 2147
4. Conclusion –
In this study, nonlinear dynamics analysis is used for analysis of G+6 building and design for Life safety performance level. The SSI with different soil strata has been incorporated and comparison is made with SSI and without SSI effect.
According to the results of an investigation conducted the following are the salient conclusions obtained from the present study:
1. The value obtained of natural period of RC building with a fixed base is less than flexible bases. It is also observed that natural period for the NSSI model and HSSI model is near about same. Such incremental natural period may considerably alter the response of buildings under seismic excitation.
2. The shear at each floor level is decreasing as soil stiffness decreases. Storey Shear at each storey level for the NSSI model is more than MSSI model and SSSI model but storey shear results for the NSSI model and HSSI model found to be near about same.
3. Inter Storey drift increases as soil stiffness decreases. Inter Storey drift increasing for lower storey i.e 2, 3, 4 levels. Second storey level shows maximum inter-storey drift.
4. It seen that the rebar area in beam and column member is decreased for SSSI model than the NSSI model.
5. It is observed that SSI effect was important for building erected on soft soil. However hard soil conditions its effect can be neglected.
In brief, the conventional inelastic design procedure excluding SSI is not adequate to guarantee the structural safety of RC building resting on medium soil and soft soil. As such in high seismic zones and for medium and soft soil strata, nonlinear dynamic analysis with soil structure interaction (SSI) shall be used.
References:
[1] Shehata E. Abdel Raheem, Mohamed M. Ahmed and Tarek M.A. Alazrak , “Soil-Structure Interaction Effects On Seismic Response of Multi-Story Buildings on Raft Foundation”, Journal of Engineering Sciences Assiut University, Faculty of Engineering Vol. 42 No. 4 July 2014
[2] I. Kraus & D. Džakić, “Soil-structure interaction effects on seismic behavior of reinforced Concrete frames” Josip Juraj Strossmayer University of Osijek, Faculty of Civil Engineering Osijek, Croati (In press), 2013
[3] M.D.L. Millen, S. Pampanin, M. Cubrinovski & A. Carr “Integrating soil-structure interaction within performance-based design”, 2014 NZSEE Conference
[4]Hamid Reza Tabataiefar,Nijan samali,and Behzad Fatahi “Effects of Dynamic Soil Structure Interaction on Inelastic behaviour of Mid Rise Moment Resisting Buildings on Soft Soils”, Australian Earthquake Engineering Society 2010 Conference, Perth, Western Australia.
[5] Yahiaoui Djarir & Kadid Abdelkrim “Seismic Response of Reinforced Concrete Frames On Flexible Foundations Subjected To both Horizontal And Vertical Ground Motions”
Malaysian Journal of Civil Engineering 24(2):202-214 (2012)
[6] Behzad Fatahi, Hamid Reza Tabatabaiefar, Bijan Samali “Performance Based Assessment of Dynamic Soil-Structure Interaction Effects on Seismic Response of Building Frames”, ASCE 2011
[7] Chaudhari, D.J. and Dhoot, G.O, “Performance Based Seismic Design of Reinforced Concrete Building”, Open Journal of Civil Engineering, 2016, 6, 188-194
![Table 3– Stiffness equations of foundation at surface[11]](https://thumb-us.123doks.com/thumbv2/123dok_us/8130659.796822/5.612.41.293.222.547/table-stiffness-equations-foundation-surface.webp)