Transform based approaches for Palmprint Identification
K.Vaidehi
T. S.Subashini
V. Ramalingam
S. Palanivel M. Kalaimani
Department of Computer Science and Engineering, Faculty of Engineering and Technology,
Annamalai University, Annamalai Nagar – 608 002, India.
ABSTRACT
In this paper, identification of a person is carried out using Discrete Cosine Transform (DCT) and Discrete Wavelet Transform (DWT) coefficients as palmprint features. Dimensionality reduction was carried out using Principal Component Analysis (PCA) and the reduced features were classified using Support Vector Machine (SVM). The segmented palmprint images used in this study are from the IITD palmprint database. Here, we describe the palmprint identification methodology, which can be summarized in a number of distinct steps: (1) preprocessing, (2) feature extraction, and (3) classification. Experiments were developed on a database of 100 images from 20 individuals. This study shows that DCT is better for palmprint identification with an accuracy of 99% compared to DWT which gives 96.66% accuracy.
Keywords
Palmprint, feature extraction, DWT, DCT, PCA, SVM.
1. INTRODUCTION
Biometric technology has the potential to deliver widespread automatic identification of individuals by measuring their biological or behavioral characteristics. Physiological characteristics are connected with the shape of the body. Examples: fingerprint, face recognition, DNA, palmprint, hand geometry. Behavioral characteristics are connected with the behavior of a person. Examples: typing rhythm, voice, gait. It has a number of current and potential applications relating to national security and law enforcement. There is growing interest in the use of biometrics for small-scale security of buildings and IT systems and for use in access/I.D. cards.
The areas where biometrics could be used include: timing and attendance, controlling access to restricted areas, Identifying known terrorists or criminals, gathering intelligence on people‟s travel patterns, etc.,
1.1 Biometric Technologies
There are many biometric technologies to suit different types of applications:
Fingerprints - A fingerprint looks at the patterns found on a fingertip.
Hand geometry - This involves analyzing and measuring the shape of the hand.
Retina - A retina-based biometric involves analyzing the layer of blood vessels situated at the back of the eye.
Iris - An iris-based biometric involves analyzing features found in the colored ring of tissue that surrounds the pupil. Face - Face recognition analyses facial characteristics. Signature - Signature verification analyses the way user signs his name.
Voice - Voice authentication is based on voice-to-print authentication, where complex technology transforms voice into text.
Palmprint – A palmprint measures the features of the palm to identify the person.
Since the palm area is much larger, more distinctive features can be captured compared to fingerprints. This makes it more suitable in identification systems than fingerprints. Palmprint biometric system produces better accuracy than hand geometry system. This system has no privacy issue like face recognition system. The palmprint scanner cost is lesser than iris scanner. Moreover, palmprint also serves as a reliable human identifier because the print patterns are not found to be duplicated even in mono-zygotic twins.[1,2]
So, in this work, an attempt is made to authenticate a person using palmprint.
1.1.1 Palmprint
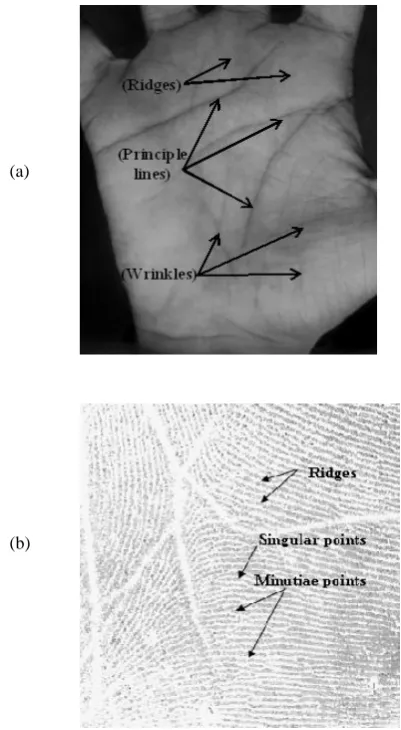
[image:1.595.311.512.360.725.2]Palmprint is the region between wrist and fingers and has features like principle lines, wrinkles, ridges, minutiae points, singular points and texture pattern which can be considered as biometric characteristics. Palmprint features are shown in Fig.1.
(a)
(b)
2. PREVIOUS WORK
During the past two decades, five different classes of extraction algorithms typically applied in palmprint recognition are subspace-based approach, texture-based coding, line-based feature extraction, multiple fusions and transform-based approach.[3,4]
Subspace-based approaches are also called appearance-based approaches in the literature of palmprint recognition. Principal component analysis (PCA), linear discriminant analysis (LDA), and independent component analysis (ICA) are used.[5,6] Fisher discriminant analysis (FDA)[7] is used to reduce the feature size.
Competitive code method is used as local palmprint texture analysis with binary co-occurance vector. In line based approaches, phase congruency feature extraction method is used.
In transform based approaches, Discrete cosine transform (DCT), discrete fourier transform (DFT), scale invariant feature transform (SIFT), wavelet transform are used for feature extraction.[8,9] Dual-tree complex wavelet transform has property of shift invariant.
3. PROPOSED METHOD
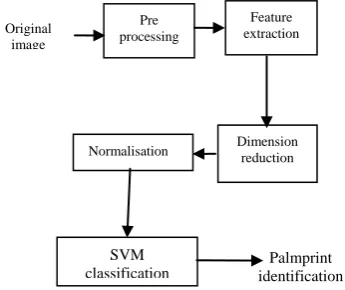
The block diagram of the proposed method is shown in Fig.2. Histogram equalization is applied to the segmented palmprint for preprocessing and then DCT and DWT transforms are applied to extract coefficients which are used as features for classification. Dimension reduction is done using PCA. Then reduced and normalized features are fed to SVM for classification.
[image:2.595.348.498.370.580.2]
Fig.2. Overall block diagram of the proposed system
3.1 Preprocessing
The segmented palmprint images used for this work are from the IITD database. This touchless palmprint image database mainly consists of the hand images collected from the students and staff at IIT Delhi, India. This database has been acquired in the Biometrics Research Laboratory during January 2006 - July 2007 using a digital CMOS camera. The acquired images were saved in bitmap format.
This database contains left and right hand images from more than 230 subjects, using a very simple touchless imaging setup, and made available freely to the researchers.[10] These images are preprocessed using histogram equalization. Histogram equalization is the technique by which the dynamic range of the histogram of an image is increased. Histogram equalization assigns the intensity values of pixels in the input image such that the output image contains a uniform
distribution of intensities. It improves contrast, and the goal of histogram equalization is to obtain a uniform histogram.
3.2 Feature Extraction
The various step involved in feature extraction are as follows:
3.2.1 Wavelet Decomposition
Wavelet decomposition is the first step in feature extraction. This operation returns the wavelet decomposition of the image at predefined scale, using the wavelet, such as daubechies. The decomposition vector consists of one approximation coefficient vector and three detail coefficients vector namely, horizontal detail coefficients, vertical detail coefficients and diagonal detail coefficients. In this work wavelet „db4‟ is used for the decomposition of the enhanced image. The wavelet decomposition shown in Fig.3, starts with the original signal and fits the mother wavelet to it at the smallest scale. This produces what is called the first wavelet “detail” and a remainder called the “approximation”. Then the time scale of the mother wavelet is doubled (called dilation/scale) and it is fit to the first approximation. This produces a second wavelet detail and the remainder is the second approximation and so the process continues until the mother wavelet has been dilated to such an extent that it covers the entire range of the signal.[11]
3.2.1.1Coefficient extraction
Fig.3. Wavelet decomposition
The vectors are extracted from approximation coefficients, which have the low-frequency components and the detail coefficients are ignored, which have the high-frequency components.
3.2.2 Discrete Cosine Transform
The DCT transforms a signal from a spatial representation into a frequency representation which maps an n-dimensional vector to set of n coefficients.
One-dimensional DCT is given by:
]
2
)
1
2
(
cos[
)
(
)
(
)
(
1
0
N
u
x
x
f
u
C
u
F
N
x
Where u=0,1,……N-1
Original image
Pre processing
Feature extraction
SVM classification
Dimension reduction Normalisation
[image:2.595.69.242.417.562.2]N
u
C
(
)
1
when u = 0N
u
C
(
)
2
when u≠0Two-dimensional DCT is given by:
] 2
) 1 2 ( cos[ ] 2
) 1 2 ( cos[ ) , ( ) ( ) ( ) , (
1
0 1
0 N
v y N
u x y
x f v C u C v u F
N
x M
y
Where u=0,1,……N-1 v=0,1,…..M-1
N
v
C
u
C
(
),
(
)
1
when u,v=0N
v
C
u
C
(
),
(
)
2
when u,v≠0 [image:3.595.72.263.369.496.2]In an image, most of the energy will be concentrated in the lower frequencies, so if the image is transformed into its frequency components and the higher frequency coefficients are discarded, the amount of data needed to describe the image can be reduced. DCT‟s energy compaction efficiency is so great that can reduce the amount of data needed to describe the image without sacrificing too much image quality.[12]
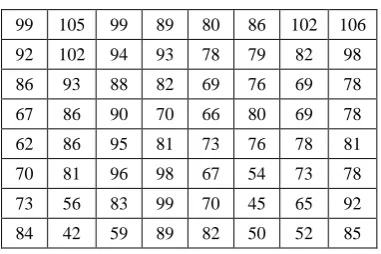
Table 1. Example of 8x8 block before DCT
99 105 99 89 80 86 102 106
92 102 94 93 78 79 82 98
86 93 88 82 69 76 69 78
67 86 90 70 66 80 69 78
62 86 95 81 73 76 78 81
70 81 96 98 67 54 73 78
73 56 83 99 70 45 65 92
[image:3.595.62.273.520.643.2]84 42 59 89 82 50 52 85
Table 2. After applying discrete cosine transform
638.2 17.5 6.4 -50.1 15.5 5.7 4.3 -5.1 59.9 7.9 22.2 11.9 -40.9 -15.4 -3.3 -7.8 14.5 -5.9 11.9 5.2 38.9 11.1 -2.4 3.4 26.5 -2.9 0.4 -18.7 -15.9 7.0 -9.9 3.6 -1.5 -13.4 2.0 14.5 -6.2 -7.6 4.8 4.1 -4.4 -1.7 4.3 -4.7 -2.7 3.9 3.1 1.5 -2.2 9.0 0.0 6.4 -1.2 2.8 -2.4 -0.1 2.4 -3.1 -0.0 0.8 0.7 1.1 -0.0 1.2
It can be seen from Table 1 and Table 2 that higher values of transform coefficients are concentrated on the top left corner.
In this paper, energy compaction property of discrete cosine transform and approximation coefficients of discrete wavelet transform are exploited to extract the palmprint features.
3.2.3 Feature Dimensionality Reduction
Principal component analysis (PCA) involves a mathematical procedure that transforms a number of (possibly) correlated variables into a (smaller) number of uncorrelated variables called principal components. The first
principal component accounts for as much of the variability in the data as possible, and each succeeding component accounts for as much of the remaining variability as possible. The mathematical technique used in PCA is called eigen analysis: we solve for the eigen values and eigenvectors of a square symmetric matrix with sums of squares and cross products. The eigenvector associated with the largest eigen value has the same direction as the first principal component. The eigenvector associated with the second largest eigen value determines the direction of the second principal component. The sum of the eigen values equals the trace of the square matrix and the maximum number of eigenvectors equals the number of rows (or columns) of this matrix.
In this work PCA is applied to obtain the most relevant DCT coefficients from a large number of coefficients which are irrelevant and redundant. If q sample palm-print images of each palmprint images of each person are considered and a total of M dominant DCT coefficients are selected per image, the feature space per person would have a dimension of q x M. Implementation of PCA on the derived feature space could efficiently reduce the feature dimension without losing much information. Hence PCA is employed to reduce the dimension of the proposed feature space.[13]
3.3 SVM Classification
[image:3.595.313.560.559.713.2]SVMs are powerful machine learning techniques for classification and regression. They were developed by Vapnik [1998], and are based on statistical learning theory. This gave rise to a new class of theoretically elegant learning machines that use a central concept of support vectors and kernels for a number of learning tasks. Kernal machines provide a modular framework that can be adapted to different tasks and domains by the choice of the kernel function and the base algorithm. They are replacing neural networks in a variety of fields. In the parlance of SVM literature, a predictor variable is called an attribute, and a transformed attribute that is used to define the hyperplane is called a feature. The task of choosing the most suitable representation is known as feature selection. A set of features that describes one case is called a vector. So the goal of SVM modeling is to find the optimal hyperplane that separates clusters of vector in such a way that cases with one category of the target variable are on one side of the plane and cases with the other category are on the other size of the plane. The vectors near the hyperplane are the support vectors.[14,15] The Fig.4 and 5. below presents an overview of the SVM process.
Fig 4: Simple view of SVM Mapped into
Hyperplane
tn
fp
[image:4.595.73.280.74.263.2]tn
Fig.5. Maximum margin hyperplane.
4. PERFORMANCE MEASURES
[image:4.595.369.484.207.329.2]Supervised Machine Learning (ML) has several ways of evaluating the performance of learning algorithms and the classifiers they produce. Measures of the quality of classification are built from a confusion matrix which records correctly and incorrectly recognized examples for each class. Table 3 presents a confusion matrix for binary classification, where tp stands for true positive, fp for false positive, fn for false negative, and tn for true negative counts. The various performance measures which are used to assess the classifiers performance are [16]
Table 3: Confusion matrix for binary classification
Class /
Recognised As Positive As Negative
Positive tp Fn
Negative fp tn
• Accuracy
accuracy =
tn
fn
fp
tp
tn
tp
• Sensitivity/Specificity
sensitivity =
fn
tp
tp
specificity =
• Precision/Recall/F-Score
precision =
fp
tp
tp
recall =
fn
tp
tp
F − Score =
recall
precision
recall
precision
*
*
*
)
1
(
2 2
5. EXPERIMENTAL RESULTS AND
DISCUSSION
150 x 150 segmented palmprint images from IITD database is used in this work. The sample image is shown in Fig.6. The database contains five different palm print of each palm of an individual . 100 such images of 20 individuals are used for training and testing.
Fig.6. Original image
To enhance the palmprint, histogram equalization is applied and the result is shown in the Fig.7.
Fig.7. Histogram equalized image
5.1 DWT Experimental Results
[image:4.595.361.472.383.502.2]Wavelet decomposition is then applied to the enhanced image and the approximation coefficients of levels three to five are extracted. In this work, wavelet „db4‟ is used. Extracted feature vectors are fed to the SVM classifier for identification of palm print. Level five gives a better accuracy of 96.66% as shown in Table 4.
Table 4. Summary of performance measures in (%) (DWT)
Level 3 Level 4 Level 5
Accuracy 80.00 92.50 96.66
Sensitivity 99.99 99.99 99.99 Specificity 73.33 92.50 96.66
Precision 60.00 85.00 95.00
Recall 99.99 99.99 99.99
F-Score 75.00 91.89 97.43
Margin Support
vectors
[image:4.595.50.276.434.734.2] [image:4.595.319.540.656.734.2]5.2 DCT Experimental Results
Discrete cosine transform exploits interpixel redundancies to render excellent decorrelation for the palmprint. Thus, all transform coefficients can be encoded independently without compromising coding efficiency. In addition, the DCT packs energy in the low frequency region (i.e. Top left region), which is shown in the Fig.8. Therefore, some of the high frequency content can be discarded without significant quality reduction.
From the DCT image, 100 x 100 features and 50 x 50 features are fed into PCA. PCA produced 48 projected vectors for both the cases. Hence the performance was calculated using the reduced 48 features. Further we experimented with the first 30, 20 and 10 principal components and the best performance was obtained using 48 features. Summary of performance measures are given in Table 5.
[image:5.595.307.549.101.182.2]energy packed region low frequency region region
Fig 8. DCT applied image with low frequency region
7. CONCLUSION
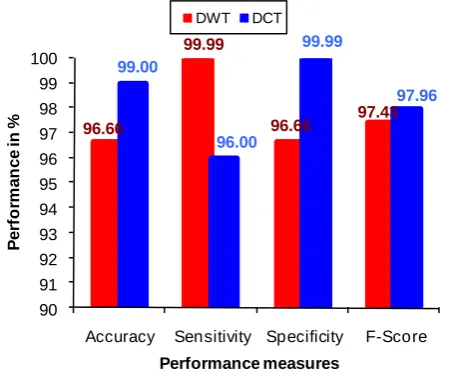
In this paper, DCT and DWT for feature extraction and SVM for identification of palmprints were investigated and analyzed. The work has shown that this method is very effective for the automatic identification of palmprints. The identification achieves the best performance of 96.66% with features extracted from level 5 in the case of DWT because principle lines and wrinkles of the palmprint are represented as low frequency information which are obtained in the lowest decomposition levels. However the study shows DCT outperforms DWT in palmprint identification with an accuracy of 99.00%.
Fig.9. Graph showing the comparison of SVM performance using 50x50 DCT features and level five
[image:5.595.52.255.245.352.2]DWT features for palmprint identification.
Table 5. Summary of performance measures in (%) (DCT)
PCA features 48 30 20 10
Accuracy 99.00 96.00 91.22 81.11 Sensitivity 96.00 88.00 82.00 78.00 Specificity 99.99 98.66 94.19 82.30 Precision 99.99 95.65 82.00 62.90
Recall 96.00 88.00 82.00 78.00
F-Score 97.96 91.66 82.00 69.64
REFERENCES
[1] Adams Kong, David Zhang, and Mohamed Kamel, “A Survey of Palmprint Recognition”.
[2] G.S. Badrinath, Phalguni Gupta, “ An efficient palmprint based recognition system using 1D-DCT Features”, “IDRBT Doctoral Collaquium”, 2011. [3] Edward Wong Kie Yih, G.Sainarayanan, Ali
Chekima,”Palmprint based biometric system: A comparative study on discrete cosine transform energy, wavelet transform energy and sobelcode methods”, Biomedical Soft Computing and Human Sciences, Vol.14, No.1, pp.11-19, 2009.
[4] Deepti Tamrakar, Pritee Khanna,” Analysis of palmprint verification using wavelet filter and competitive code”, “2010 International conference on computational intelligence and communication Networks”, IEEE, 2010.
[5] A.Kong, D.Zhang, and M.Kamel, “A survey of palmprint recognition. Pattern Recognition”, vol.42, pp. 1408-1418, 2009.
[6] Nan Luo and Zhenhua Guo, “Local-Global based palmprint verification”, “International conference on advanced computer control”, IEEE, 2011. [7] X.Wu, D. Zhang, K.Wang, “A Fisherpalms based
palmprint recognition”, Pattern Recognition Letters, vol. 24, 2003, pp. 2829-2838.
[8] Edward Wong Kie Yih, G.Sainarayanan, Ali Chekima, and Narendra G, “Palmprint identification using sequential modified haar wavelet energy”, International Conference on Signal Processing, IEEE, 2008.
[9] Jun-ying Gan, Dang-pei Zhou,”A novel method for palmprint recognition based on wavelet transform”, „ICSP 2006 Proceedings‟, IEEE, 2006.
[10]IIT Delhi Touchless Palmprint Database (Version 1.0): www.comp.polyu.edu.hk/~csajaykr /IITD/ Database-palm.htm
[11]“Orthogonal wavelet decomposition”, www.tideman.co.nz/ salalah/orthwavedecomp.html [12]12. K.R.Rao and P.Yip, “Discrete Cosine
Transform; Algorithms, Advantages and Applications”, Academic press Inc., 1990.
[13]Principal component analysis: www.fon.hum.uva.nl/praat/manual/principal_compo nent_ analysis.html
[14]SVM - Support Vector Machines: www.dtreg.com.svm.htm
[15]V.Vapnik, Statistcal Learning Theory, Wiley, New York, 1998.
[16]Marina sokolova, Nathalie japakowicz and stan szpakowicz, “Beyond Accuracy, F-score and ROC: a family of Discriminant measures for performance evaluation”,www.etud.iro.umontreal.ca/nsokolovm/ australia06.pdf/ 2006.
96.66
99.99
96.66 97.43
99.00
96.00
99.99
97.96
90 91 92 93 94 95 96 97 98 99 100
Accuracy Sensitivity Specificity F-Score
P
e
rf
o
rm
a
n
c
e
in
%
Performance measures
[image:5.595.52.281.514.702.2]