Selecting the Best Supervised Learning Algorithm for
Recommending the Course in E-Learning System
Sunita B Aher
Lobo L.M.R.J.
M.E. (CSE) -II Associate Professor, Head, Department of IT
Walchand Institute of Technology Walchand Institute of Technology Solapur University India Solapur University India
ABSTRACT
Now a day E-learning is becoming popular as it helps to fulfil the necessities of remote students and helps the teaching-learning process in Education system. Course Recommender System in E-Learning is a system which recommend the course to the student based on the choice of various student collected from huge amount of data of courses offered through Moodle package of the college. Here in this paper we compare the seven classification algorithm to choose the best classification algorithm for Course Recommendation system. Theses seven classification algorithms are ADTree, Simple Cart, J48, ZeroR, Naive Bays, Decision Table & Random Forest Classification Algorithm. We compare these seven algorithms using open source data mining tool Weka & present the result. We found that ADTree classification algorithm works better for this Course Recommender System than other five classification algorithms.
Keywords
ADTree, Simple Cart, J48, ZeroR, Naive Bays, Decision Table, Random Forest Classification Algorithm, Weka
1. INTRODUCTION
Course Recommender System in E-Learning is a system which recommend the course to the student based on the choice of various student collected from huge amount of data of courses offered through Moodle package of the college e.g. If student is interested in course like Database System then he would like to learn the Advanced Database System.
[image:1.595.77.533.441.700.2]Here we use Moodle for data collection & Weka to check the results. The data flow diagram for Course Recommender System is given in figure 1 & explained in [15].
2. LITERATURE REVIEW
Hu H., Li J., Plank A., Wang H. and Daggard G. [1] conducted experimental comparison of LibSVMs, C4.5, BaggingC4.5, AdaBoostingC4.5, and Random Forest on seven Microarray cancer data sets. The experimental results showed that all ensemble methods outperformed C4.5. The experimental results also showed that all five methods benefited from data preprocessing, including gene selection and discretization, in classification accuracy. In addition to comparing the average accuracies of ten-fold cross validation tests on seven data sets, they used two statistical tests to validate findings.
Abdelghani Bellaachia, Erhan Guven [2] presented an analysis of the prediction of survivability rate of breast cancer patients using data mining techniques. The data used was the SEER Public-Use Data. The preprocessed data set consists of 151,886 records, which had all the available 16 fields from the SEER database. They have investigated three data mining techniques: the Naïve Bayes, the back-propagated neural network, and the C4.5 decision tree algorithms. Several experiments were conducted using these algorithms. The achieved prediction performances were comparable to existing techniques. However, they found out that C4.5 algorithm has a much better performance than the other two techniques.
My Chau Tu, Dongil Shin, Dongkyoo Shin [3] proposed the use of decision tree C4.5 algorithm, bagging with decision tree C4.5 algorithm and bagging with Naïve Bayes algorithm to identify the heart disease of a patient and compare the effectiveness, correction rate among them. The data they studied was collected from patients with coronary artery disease.
Aman Kumar Sharma, Suruchi Sahni [4] conducted experiment in the WEKA environment by using four algorithms namely ID3, J48, Simple CART and Alternating Decision Tree on the spam email dataset and later the four algorithms were compared in terms of classification accuracy. According to their simulation results, the J48 classifier outperforms the ID3, CART and ADTree in terms of classification accuracy.
Rich Caruana Alexandru Niculescu-Mizil [5] presented a large-scale empirical comparison between ten supervised learning methods: SVMs, neural nets, logistic regression, naive bayes, memory-based learning, random forests, decision trees, bagged trees, boosted trees, and boosted stumps. They also examined the effect that calibrating the models via Platt Scaling and Isotonic Regression has on their performance. An important aspect of their study was the use of a variety of performance criteria to evaluate the learning methods.
Eric Bauer, Ron Kohavi [6] provided a brief review of two families of voting algorithms: perturb and combine (e.g., Bagging), and boosting (e.g., AdaBoost, Arc-x4).
In research [7], twenty-two decision tree, nine statistical, and two neural network algorithms were compared on thirty-two datasets in terms of classification accuracy, training time, and (in the case of trees) number of leaves. Classification accuracy is measured by mean error rate and mean rank of error rate. Both criteria place a statistical, spline-based, algorithm called Polyclass at the top, although it is not statistically significantly different from twenty other algorithms. Another statistical algorithm, logistic regression, is second with respect to the two accuracy criteria. The most accurate decision tree algorithm is Quest with linear splits, which ranks fourth and fifth, respectively. Although spline-based statistical algorithms tend to have good accuracy, they also require relatively long training times. Polyclass, for example, is third last in terms of median training time. It often requires
hours of training compared to seconds for other algorithms. The Quest and logistic regression algorithms are substantially faster. Among decision tree algorithms with univariate splits, C4.5, Ind-Cart, and Quest have the best combinations of error rate and speed. But C4.5 tends to produce trees with twice as many leaves as those from Ind-Cart and Quest.
3. SUPERVISED CLASSIFICATION
ALGORITHMS
Classification is a data mining task that maps the data into predefined groups & classes. It is also called as supervised learning. It consists of two steps. First step is the model construction which consists of set of predetermined classes. Each tuple /sample is assumed to belong to a predefined class. The set of tuple used for model construction is training set. The model is represented as classification rules, decision trees, or mathematical formulae. Second step is model usage which is used for classifying future or unknown objects. The known label of test sample is compared with the classified result from the model. Accuracy rate is the percentage of test set samples that are correctly classified by the model. Test set is independent of training set, otherwise over-fitting will occur [10]. Here we consider the brief introduction of each classification algorithm.
3.1 ADTree Classification Algorithm
An alternating decision tree (ADTree) is a machine learning method for classification which generalizes decision trees. An alternating decision tree consists of two nodes. Decision nodes specify a predicate condition. Prediction nodes contain a single number. ADTree always have prediction nodes as both root and leaves. An instance is classified by an ADTree by following all paths for which all decision nodes are true and summing any prediction nodes that are traversed.The fundamental element of the ADTree algorithm is the rule as it comes under the tree category. A single rule consists of [16]:
Condition: is a predicate of the form "attribute <comparison> value.
Precondition: is simply a logical conjunction of conditions and
Two scores.
A precondition Evaluation of a rule involves a pair of nested if statements:
if(precondition) if(condition)
return score_one else
return score_minus_one end if
else
return zero end if
3.3 J48 Classification Algorithm
A decision tree is a predictive machine-learning model that decides the target value (dependent variable) of a new sample based on various attribute values of the available data. The internal nodes of a decision tree denote the different attributes; the branches between the nodes tell us the possible values that these attributes can have in the observed samples, while the terminal nodes tell us the final value (classification) of the dependent variable. The attribute that is to be predicted is known as the dependent variable, since its value depends upon, or is decided by, the values of all the other attributes. The other attributes, which help in predicting the value of the dependent variable, are known as the independent variables in the dataset. [12].
3.4 ZeroR Classification algorithm
ZeroR classifier predicts the majority of class in training data. It predicts the mean for numeric value & mode for nominal class.
3.5 Naive Bays Classification Algorithm
Naïve Bays classification is based on Bays rule conditional probability. It makes use of all the attributes contained in the data, and analyses them individually as though they are equally important and independent of each other [12].3.6
Random
Forest
Classification
Algorithm
Random forest is a classifier that consists of many decision trees and outputs the class that is the mode of the classes output by individual trees. For many data sets, it produces a highly accurate classifier [13]. This algorithm handles the missing data & maintains the accuracy.
3.7 Decision Table
This is Class for building and using a simple decision table majority classifier (Ron Kohavi). In this algorithm, we have to set the number folds, display rule etc to get the proper result.
4. EXPERIMENTAL RESULT
[image:3.595.75.549.395.770.2]Here we are considering the sample data extracted from Moodle database of a college after collection of data for course enrollment by student as shown in Table 1. In this table, we consider 45 student & 15 courses. Fifteen courses are C-programming (C), Visual Basic (VB), Active Server Pages (ASP), Computer Network (CN), Network Engineering (NE), Microprocessor (MP), Computer Organization (CO), Database Engineering (DBE), Advanced Database System (ADS), Operating System (OS), Distributed System (DS), Finite Automata System (FSA), Data Structure (DS-I), Software Engineering (SE), and Software Testing & Quality assurance (STQA). In this table yes represent that the student is interested in that particular course & no represent that student do not like that course.
Table 1: Sample Data from Moodle Database[11]
Courses→
Roll_No↓ C VB ASP CN NE MP CO DBE ADS OS DS FSA DS-I
SE STQA
1 yes yes yes yes yes no no no no no no no yes no no
2 no no no no no no no no no no no no no no no
3 yes yes yes yes yes no no no no yes yes yes yes yes yes
4 no no no yes yes no yes no no no no no no no no
5 yes yes yes yes yes no no yes no yes yes no yes no no
6 yes yes yes no no no no no no yes no no yes no no
7 no no no yes yes yes yes no no no no no no yes no
8 no no no no no no no yes yes yes yes no yes no no
9 no no no yes yes yes yes no no no no yes no no no
10 yes no no no no no no no no no no no no no no
11 yes yes yes no no no no no no yes yes no yes no no
12 yes yes yes yes yes no no no no no no no no no no
13 no no no no no no no yes yes yes yes no yes yes yes
14 yes yes yes yes yes no no no no yes yes no no no no
15 yes yes yes no no no no no no no no no yes no no
16 no no no yes yes no no yes yes yes yes no yes no no
17 yes yes yes no no no no no no yes yes no yes yes yes
18 yes yes yes no no no no no no no no no no no no
19 no no no yes yes yes yes yes yes no no no no no no
20 yes no no no no no no no no yes yes no yes yes yes
21 yes no yes no no yes yes no no yes yes yes no no no
22 no no no no no no no yes yes yes yes no yes no no
23 yes yes yes yes yes yes yes no no yes yes no yes no no 24 yes yes yes yes yes yes yes yes yes yes yes yes yes yes yes 25 no yes yes no no yes yes yes yes yes yes no no no no
26 yes yes yes no no no no no no yes yes no yes no no
27 yes yes yes yes yes no no no no no no no no no no
28 no no no yes yes no no no no yes yes no yes no no
29 no no no no no yes yes yes yes no no no no no no
30 yes yes yes yes yes no no no no no no no no yes yes
31 no no no no no no no no no no no no no no no
32 yes yes yes no no no no yes yes yes yes no yes no no
34 yes yes yes no no no no no no no no no no no no
35 no no no no no no no no no yes yes no no no no
36 no no no yes yes no no no no no no no yes no no
37 yes yes yes yes yes yes yes yes yes no no no no no no
38 no no no no no no no no no yes yes yes yes yes yes
39 yes yes yes yes yes yes yes yes yes yes yes yes yes yes yes
40 no no no no no no no no no no no no no yes yes
41 yes yes yes no no no no no no yes yes no yes no no
42 no no no yes yes no no no no no no no no no no
43 no no no no no no no no no yes yes no yes no no
44 no no no no no no no no no no no no no no yes
45 no no no no no no no no no no no no no no no
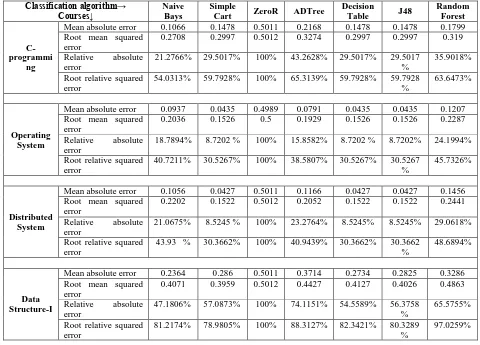
In table 2, we are considering only those courses from table 1 for which the classification algorithm classifies this course as “yes”. For remaining courses, the classification algorithm gives more percentage of “no” compare to the percentage of “yes”. Table 3 gives the simulation errors that occurred in each classification algorithm.
From table 2, we can observe that ADTree has highest percentage of correctly classified instance & lowest percentage of incorrectly classified instances. ZeroR classification algorithm has lowest percentage of correctly classified instances & highest percentage of incorrectly classified instances.Naive Bays & Decision Table has the
[image:4.595.76.549.71.201.2]same percentage for correctly & incorrectly classified instances. Simple Cart, J48, & Random Forest classification algorithm has 91.66%, 93.33% & 87.22% correctly classified instances respectively & 8.44%, 6.77%, and 12.88% incorrectly classified instances. Ascending order of classification algorithm considering the classification accuracy into account is ADTree, J48, Naive Bays, Decision Table, Simple Cart, Random Forest, and ZeroR. So we consider the ADTree as classification algorithm for Course Recommender System as classification accuracy for ADTree is highest.
Table 2: Result using different classification algorithm
Classification algorithm →
Courses↓ Naive Bays Simple Cart
ZeroR ADTree Decision Table
J48 Random
Forest
C-programming
Correctly classified instance
42 41 23 43 41 42 41
Incorrectly classified instance
3 4 22 2 4 3 4
Operating System
Correctly classified instance
44 44 24 44 44 44 43
Incorrectly classified instance
1 1 21 1 1 1 2
Distributed System
Correctly classified instance
43 44 23 44 44 44 43
Incorrectly classified instance
2 1 22 1 1 1 2
Data Structure-I
Correctly classified instance
38 36 23 40 38 38 30
Incorrectly classified instance
7 9 22 5 7 7 15
Overall result
Correctly classified instance
167 (92.77%)
165 (91.66%)
93 (51.66%)
172 (95.55%)
167 (92.77%)
168 (93.33%)
157 (87.22)
Incorrectly classified instance
13 (7.23%)
15 (8.44%)
87 (48.44%)
9 (4.45%)
13 (7.33%)
12 (6.77%)
Table 3: Simulation Errors in classification algorithm
Classification algorithm→ Courses↓
Naive Bays
Simple
Cart ZeroR ADTree
Decision
Table J48
Random Forest
C-programmi
ng
Mean absolute error 0.1066 0.1478 0.5011 0.2168 0.1478 0.1478 0.1799 Root mean squared
error
0.2708 0.2997 0.5012 0.3274 0.2997 0.2997 0.319 Relative absolute
error
21.2766% 29.5017% 100% 43.2628% 29.5017% 29.5017 %
35.9018% Root relative squared
error
54.0313% 59.7928% 100% 65.3139% 59.7928% 59.7928 %
63.6473%
Operating System
Mean absolute error 0.0937 0.0435 0.4989 0.0791 0.0435 0.0435 0.1207 Root mean squared
error
0.2036 0.1526 0.5 0.1929 0.1526 0.1526 0.2287 Relative absolute
error
18.7894% 8.7202 % 100% 15.8582% 8.7202 % 8.7202% 24.1994% Root relative squared
error
40.7211% 30.5267% 100% 38.5807% 30.5267% 30.5267 %
45.7326%
Distributed System
Mean absolute error 0.1056 0.0427 0.5011 0.1166 0.0427 0.0427 0.1456 Root mean squared
error
0.2202 0.1522 0.5012 0.2052 0.1522 0.1522 0.2441 Relative absolute
error
21.0675% 8.5245 % 100% 23.2764% 8.5245% 8.5245% 29.0618% Root relative squared
error
43.93 % 30.3662% 100% 40.9439% 30.3662% 30.3662 %
48.6894%
Data Structure-I
Mean absolute error 0.2364 0.286 0.5011 0.3714 0.2734 0.2825 0.3286 Root mean squared
error
0.4071 0.3959 0.5012 0.4427 0.4127 0.4026 0.4863 Relative absolute
error
47.1806% 57.0873% 100% 74.1151% 54.5589% 56.3758 %
65.5755% Root relative squared
error
81.2174% 78.9805% 100% 88.3127% 82.3421% 80.3289 %
97.0259%
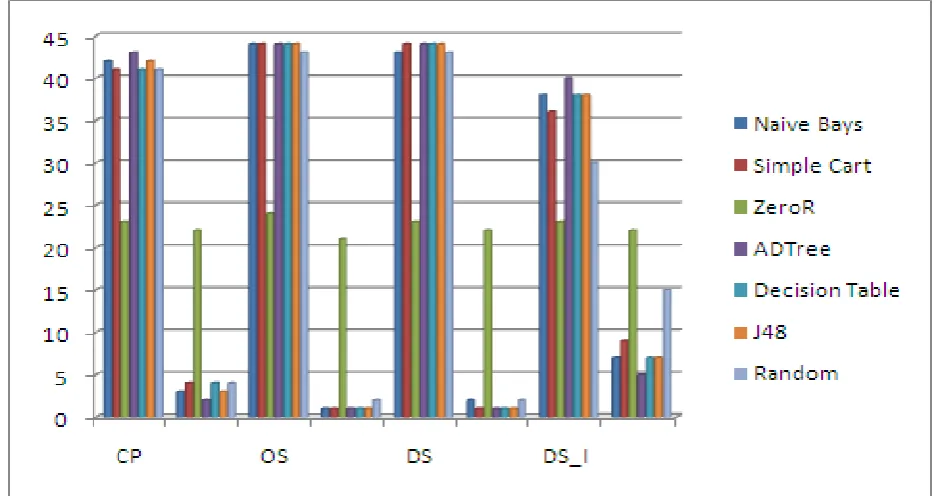
The graph for correctly classified instances is shown in figure 2 while the graph for incorrectly classified instance is shown in figure 3. From these two graphs, we can observe that ADTree classification algorithm is best for Course Recommender System.
In this graphs X-axis represent the seven classification algorithm while Y-axis represents correctly & incorrectly classified instances.
[image:5.595.327.543.521.692.2]Figure 2: Graph for correctly classified instance in various classification algorithms
[image:5.595.78.294.521.693.2]Figure 4 shows the graph for comparison of these seven classification algorithm. In this graph, X-axis represents courses considered for comparison of classification algorithm & Y-axis represent the correctly classified &
[image:6.595.75.545.123.371.2] [image:6.595.73.551.427.614.2]incorrectly classified instances. The result of application after application of ADTree classification algorithm to table 1 is shown in table 4.
Figure 4: Comparison of classification algorithms in Course Recommendation System
Table 4: Table after application of classification algorithm-ADTree
Courses Roll_No
| v
C VB ASP CN NE MP CO DBE ADS OS DS FSA DS-I SE STQA
3 yes yes yes yes yes no no no no yes yes yes yes yes yes 5 yes yes yes yes yes no no yes no yes yes no yes no no 11 yes yes yes no no no no no no yes yes no yes no no 17 yes yes yes no no no no no no yes yes no yes yes yes 20 yes no no no no no no no no yes yes no yes yes yes 23 yes yes yes yes yes yes yes no no yes yes no yes no no 24 yes yes yes yes yes yes yes yes yes yes yes yes yes yes yes 26 yes yes yes no no no no no no yes yes no yes no no 32 yes yes yes no no no no yes yes yes yes no yes no no 39 yes yes yes yes yes yes yes yes yes yes yes yes yes yes yes 41 yes yes yes no no no no no no yes yes no yes no no After classifying the data, we apply the Apriori association
rule to get the best combination of courses. Before preprocessing of data, we got the association rule containing “no” only which is shown in first row of table 5.
Table 5: Result for Course Recommender System [14]
Course considered
Parameter
Considered Results
Result of Apriori Association Rule before preprocessing & application of combination of Classification & Association Rule
C, VB, ASP, CN, NE, MP, CO, DBE, ADS, OS, DS, FSA, DS-I, SE, STQA
Minimum support: 0.7 Minimum metric <confidence>: 0.9
Best rules found:
1. Computer_Organization=no → Microprocessor=no 2.Database_Engg=no → Advanced_Database_System=no
3. Computer_Organization =no Finite_State_Automata=no → Microprocessor=no 4. Microprocessor =no → Computer_Organization =no
5.Software_Testing_&_Quality_Assurance=no → Software_Engg=no 6. Software_Engg =no → Software_Testing_&_Quality_Assurance =no 7. Advanced_Database_System =no → Database_Engg =no
8. Microprocessor =no Finite_State_Automata =no → Computer_Organization =no 9. Finite_State_Automata =no Software_Testing_&_Quality_Assurance =no → Software_Engg =no
10. Finite_State_Automata =no Software_Engg =no → Software_Testing_&_Quality_Assurance =no
Result of Apriori Association Rule after preprocessing & before application of combination of Classification & Association Rule
C, VB, ASP, CN, NE, OS, DS, DS-I
Minimum support: 0.5 Minimum metric <confidence>: 0.9
Best rules found:
1. Distributed_System=yes → Operating_System=yes 2. Visual_Basic=yes → Active_Server_Pages=yes 3. Network_Engg=yes → Computer_Network=yes 4. Computer_Network =yes → Network_Engg =yes
5. C_Programming=yes Visual_Basic =yes → Active_Server_Pages =yes 6. Distributed_System =yes Data_Sstructure_I=yes → Operating_System =yes 7. Operating_System =yes → Distributed_System =yes
8. Active_Server_Pages =yes → C_Programming =yes 9. C_Programming =yes → Active_Server_Pages =yes 10. Active_Server_Pages =yes → Visual_Basic =yes
Minimum support: 0.6 Minimum metric <confidence>: 0.9
Best rules found:
1. Distributed_System =yes → Operating_System =yes 2. Operating_System =yes → Distributed_System =yes
After Application of Classification algorithm-ADTree & Association Rule-Apriori Association Rule
C, VB, ASP, CN, NE, MP, CO, DBE, ADS, OS, DS, FSA, DS-I, SE, STQA
Minimum support: 0.95
Minimum metric <confidence> : 0.9
Best rules found:
5.
CONCLUSION
AND
FUTURE
WORK
Here in this paper we compare the seven classification algorithm to choose the best classification algorithm for recommending the course to student based on various student choices. Theses seven classification algorithms, we consider for comparison, are ADTree, Simple Cart, J48, ZeroR, Naive Bays, Decision Table & Random Forest Classification Algorithm. We use the open source data mining tool Weka to check the result. We find that ADTree classification algorithm works better for this Course Recommender System as incorrectly classified instance for this algorithms are less than other five classification algorithms. Future works include the combination of other data mining algorithms to recommend the course to the student from the data obtained from the Moodle course of the college.
6. REFERENCES
[1] Hu H., Li J., Plank A., Wang H. and Daggard G., “A Comparative Study of Classification Methods for Microarray Data Analysis”, In Proc. Fifth Australasian Data Mining Conference, Sydney, Australia (2006).
[2] Abdelghani Bellaachia, Erhan Guven, “Predicting Breast Cancer Survivability Using Data Mining
Techniques” accessed from
http://www.siam.org/meetings/sdm06/workproceed/S cientific%20Datasets/bellaachia.pdf on 05-03-2012 [3] My Chau Tu, Dongil Shin, Dongkyoo Shin, "A
Comparative Study of Medical Data Classification Methods Based on Decision Tree and Bagging Algorithms", dasc, pp.183-187, 2009 Eighth IEEE International Conference on Dependable, Autonomic and Secure Computing, 2009.
[4] Aman Kumar Sharma, Suruchi Sahni:”A Comparative Study of Classification Algorithms for Spam Email Data Analysis” in International Journal on Computer Science and Engineering (IJCSE)
[5] Rich Caruana Alexandru Niculescu-Mizil,” An Empirical Comparison of Supervised Learning Algorithms” ICML '06 Proceedings of the 23rd international conference on Machine learning. ISBN:1-59593-383-2 doi>10.1145/1143844.1143865 [6] ERIC BAUER, RON KOHAVI,” An Empirical
Comparison of Voting Classification Algorithms: Bagging, Boosting, and Variants” Machine Learning, vv, 1{38 (1998) Kluwer Academic Publishers, Boston. Manufactured in The Netherlands.
[7] TJEN-SIEN LIM, WEI-YIN LOH, YU-SHAN SHIH,” A Comparison of Prediction Accuracy, Complexity, and Training Time of Thirty-three Old and New Classi_cation Algorithms” Machine Learning, 40, 203{229 (2000) Kluwer Academic Publishers, Boston. Manufactured in The Netherlands. [8] Weka (2007). http://www.cs.waikato.ac.nz/ml/weka/. [9] “Data Mining Introductory and Advanced Topics” by
Margaret H. Dunham
[10] Sunita B Aher and Lobo L.M.R.J.. Data Mining in Educational System using WEKA. IJCA Proceedings on International Conference on Emerging Technology Trends (ICETT) (3):20-25, 2011. Published by Foundation of Computer Science, New York, USA (ISBN: 978-93-80864-71-13)
[11] Sunita B Aher and Lobo L.M.R.J. Article: A Framework for Recommendation of courses in E-learning System. International Journal of Computer Applications 35(4):21-28, December 2011. Published by Foundation of Computer Science, New York, USA
ISSN 0975 – 8887 Digital Library URI: http://www.ijcaonline.org/archives/volume35/number 4/4389-6091.
[12] http://www.d.umn.edu/~padhy005/Chapter5.html accessed on 30-01-2012
[13] http://en.wikipedia.org/wiki/Random_forest accessed on 30-01-2012
[14] Sunita B Aher and Lobo L.M.R.J. Article: Mining Association Rule in Classified Data for Course Recommender System in E-Learning. International Journal of Computer Applications 39(7):1-7, February 2012. Published by Foundation of Computer Science, New York, USA. ISSN 0975 – 8887 Digital Library URI:
http://www.ijcaonline.org/archives/volume39/number 7/4829-7086
[15] Sunita B Aher and Lobo L.M.R.J.,”Data Preparation Strategy in E-Learning System using Association Rule Algorithm” selected in International Journal of Computer Applications. Published by Foundation of
Computer Science, New York, USA. ISSN 0975 –
8887
![Figure 1: Data Flow Diagram for Course Recommendation System [15]](https://thumb-us.123doks.com/thumbv2/123dok_us/8121939.794452/1.595.77.533.441.700/figure-data-flow-diagram-course-recommendation.webp)
![Table 1: Sample Data from Moodle Database[11]](https://thumb-us.123doks.com/thumbv2/123dok_us/8121939.794452/3.595.75.549.395.770/table-sample-data-from-moodle-database.webp)

![Table 5: Result for Course Recommender System [14]](https://thumb-us.123doks.com/thumbv2/123dok_us/8121939.794452/7.595.81.537.71.701/table-result-for-course-recommender-system.webp)
