Microwave Induced Solid Dispersion as a Novel
Technique for Enhancing Dissolution Rate of Repaglinide
Laxmikant Zawar
1,*, Sanjay Bari
21Department of Pharmaceutics and Quality Assurance, R C Patel Institute of Pharmaceutical Education and Research, Karwand Naka,
Shirpur 425405, India
2Principal, H R Patel Institute of Pharmaceutical Education and Research, Karwand Naka, Shirpur 425405, India
*Corresponding Author: [email protected]
Copyright © 2013 Horizon Research Publishing All rights reserved.
Abstract
The aim of the present study was to enhance the solubility, dissolution rate and thus antihyperglycemic activity of a poorly soluble, BCS class II drug repaglinide, using its solid dispersions (SDs) with polyethylene glycol (PEG) 6000. Solid dispersions were prepared by kneading, solvent evaporation, conventional fusion method and microwave induced fusion methods. The dispersions were evaluated for various in vitro parameters such as solubility study, dissolution study, fourier transform infrared spectroscopy (FT-IR), differential scanning calorimetry (DSC), X-ray powder diffraction (XRD) and scanning electron microscopy (SEM). Microwave induced solid dispersions exhibited significant improvement in solubility and dissolution rate compared to that of pure drug. Results of DSC, XRD and SEM study showed translation of crystalline form of RG to amorphous form. Thus, microwave technology offers a simple, efficient, solvent free promising alternative method to prepare solid dispersion of RG with significant enhancement of the in vitro dissolution rate.Keywords
Microwave; Repaglinide; Solubility; Dissolution rate1. Introduction
Therapeutic success of a drug depends upon the bioavailability and ultimately upon the solubility of drug molecules. Solubility is one of the significant parameter to achieve desired concentration of drug in systemic circulation to achieve pharmacological response. Currently only 8% of new drug candidates have both high solubility and permeability [1]. Poorly soluble drugs have number of limitations such as need of higher dosage, rise in administration frequency and the consequential occurrence of side effects. The rate-limiting step in the absorption process for poorly water-soluble drugs is dissolution rate of such drugs in the gastro intestinal fluids rather than the rapidity of their diffusion across the gut wall; it is however,
important to improve the oral bioavailability of poorly water soluble drugs by improving their dissolution rate and solubility.
Solubility and dissolution rate of poorly soluble drugs can be enhanced using various techniques such as micronization, complexation, solubilization in surfactant system, drug derivatization etc. However, all this methods have limitations like poor flow properties, high energetic surfaces and particle agglomeration [2]. Complexation with cyclodextrins shows low drug loading and limitations for drug selection [3]. Among the methods to improve solubility and dissolution rate of poorly water soluble drugs, solid dispersion is one of the most popular [4 – 7]. Dispersion of poorly water-soluble drugs in an inert hydrophilic carrier or matrix at solid state provided by the kneading, melting and solvent evaporation methods leads to products referred to as solid dispersions (SDs) [8].Mechanisms for the improved solubility and dissolution properties of poorly soluble drugs from solid dispersions include reduction of the particle size of the drug, partial transformation of the crystalline drug to the amorphous state, formation of solid solutions, formation of complexes, reduction of aggregation and agglomeration, improved wetting of the drug and solubilization of the drug by the carrier at the diffusion layer [9 – 11]. It is highly acceptable, that often more than one of these mechanisms determine the rate and extent of dissolution [12].
irradiation offers several advantages such as: rapid volumetric heating, no overheating at the surface, addressable heating, energy-saving and low operating cost. In addition the main advantage of not using organic solvents is the absence of any risk originating from residual solvents. Microwave energy has been used to change the crystalline state of a drug instead of conventional heating. It has been reported that microwave energy can influence the crystalline status of the drug and the time of exposure plays an important role in achieving the amorphous state of the drug, thus improving its dissolution rate [14]. The application of microwaves represents a promising alternative to conventional preparative methods of solid dispersions of drugs as the microwave induced method involves much shorter preparation times.
Polyethylene glycols (PEGs) with molecular weights of 1,500–20,000 are used for the manufacturing of SDs. Solubility of PEGs in water is normally good, but decreases with increase in molecular weight. A particular benefit of PEGs for preparation of SDs is that they also have good solubility in many organic solvents. The melting points of PEGs of importance lies under 65 °C in every case (e.g., the melting ranges of PEG 1000, PEG 4000, PEG 6000, and PEG 20,000 are 30–40, 50–58, 55–63, and 60–63 °C respectively) [15].The relatively low melting points of PEGs are helpful for manufacturing of SDs by melting method. Further, PEGs have the ability to solubilize some compounds and improve wettability [16]. The SDs of drugs with PEG 6000 could be helpful to solve various difficulties such as stability, solubility, dissolution and bioavailability [17, 18].
Repaglinide (RG) is an oral prandial glucose regulator agent for the management of type 2 diabetes mellitus [19, 20]. RG is developed in attempts to surmount the adverse effects associated with existing antidiabetic compounds which include hypoglycemia, secondary failure and cardiovascular side effects [21]. RG lowers blood glucose levels by stimulating the release of insulin from the pancreas by binding to a receptor site different from that of sulfonylurea. Being a potent molecule it has good therapeutic potential but its low solubility in water with relatively low and variable bioavailability is a limitation [19]. High inter-individual variability in RG plasma concentrations has been reported in clinical trials [22 - 24]. Enhancement of solubility and dissolution in such a case is a valuable approach to improve the therapeutic efficacy.
The objective of the present investigation was to explore the potential of kneading, solvent evaporation, conventional fusion and microwave induced fusion methods with PEG 6000 as carrier to generate solid dispersions for solubility and dissolution rate enhancement of RG.
2. Material and Methods
2.1 Materials
RG and PEG 6000 were obtained as kind gift sample from Ajanta Pharmaceuticals Ltd (Mumbai, India). All other chemicals used were of analytical reagent grade.
2.2 Preparation of Solid Systems: 2.2.1 Physical Mixtures:
Physical mixtures (PM) of RG and PEG 6000 were obtained in different ratios of 1:1, 1:3, and 1:5 w/w. Ratio optimizations was carried out by solubility determination method
2.2.2 Kneading Method for Solid Dispersions:
Weighted quantity of RG and PEG 6000 (1:5 w/w proportion) was placed in a mortar and then the mixture was kneaded with 1.5 times their amount of either ethanol 70 % v/v or water for 20 minutes. The kneaded mixtures were dried in an oven at 40 °C until it reached uniform weight and then pulverized and screened through 100 mesh screens. The solid dispersion prepared by kneading with ethanol is ESD and that of water is WSD.
2.2.3 Solvent Evaporation Method for Solid Dispersion: The solvent evaporation of RG and PEG 6000 solution in ratio (1:5, w/w proportion) was carried out by using Buchi Rota evaporator (Buchi Rota Vapor, R215, Buchi, Switzerland). The solutions were prepare by dissolving 1 g of RG in 30 ml of methanol and 5 g of PEG 6000 in 70 ml of distilled water and mixed both solutions, which produces dispersion. The dispersion was evaporated at 253 tore pressure and 60°C for half hr in rotaevaporator. The dried rotaevaporated mixture of drug with PEG 6000 is assigned as SSD.
2.2.4 Conventional Fusion Method for Solid Dispersion: The solid dispersion was obtained in 1:5 w/w optimized ratio of RG to PEG 6000 by conventional fusion method and assigned name as FSD. PEG 6000 was heated to a molten mass and to this a weighed amount of RG was added with continuous stirring till solidification. Solidification was allowed to occur at room temperature. The product was stored in a dessicator for 24 h and then pulverized using a porcelain mortar and pestle. The pulverized powder was passed through 100 mesh sieve to get uniform particle size. 2.2.5 Microwave Induced Fusion Method for Solid
Dispersion:
passed through 100 mesh sieve to get uniform particle size.
2.3 Solubility Study
The apparent solubility of RG, physical mixtures and solid dispersions prepared by kneading, solvent evaporation, conventional fusion method and microwave induced fusion method were determined in the USP dissolution medium containing citric acid and sodium phosphate pH 5 at 37 ± 0.2° C. The method for determining the solubility of the RG involves weighing an equivalent of 10 mg of RG into each of vials. Then, 10 ml USP buffer containing citric acid and sodium phosphate (pH 5) was added to each of the RG containing vials and allowed to equilibrate at 37 ± 0.2° C with shaking on a glass shaker incubator for 24 h. A 1 ml aliquot was taken from each vial and filtered through 0.45µm millipore filter. RG concentration in each sample was analyzed using UV spectrophotometer at 243 nm.
2.4 Dissolution Studies
Dissolution studies of RG, physical mixture and solid dispersions were performed in 900 ml of pH 5 USP dissolution medium containing citric acid and sodium phosphate at 37±0.5°C using USP dissolution test apparatus (TDT 08L Plus — ELECTROLAB, Mumbai, India) type 2 with a stirrer rotation speed of 50 rpm. At a time interval of 5, 15, 30, 45, 60, 90 and 120 min, aliquots of 5-ml samples were withdrawn, filtered through 0.45-μm millipore filter, diluted, and analyzed at 243 nm using UV spectrophotometer. Each sample was studied in triplicate for dissolution rate, and calculated mean values of cumulative drug release were used while plotting the release curves. Dissolution efficiency (DE) parameter was employed for evaluation of the dissolution rate. DE30 and DE60 were considered from the dissolution data and used for comparison.
2.5 Characterization of Solid Dispersions 2.5.1 Infrared Spectroscopic Study
Fourier transformed infrared (FTIR) spectra’s of RG, PEG 6000, physical mixture and microwave induced solid dispersion (MSD) were obtained on a FTIR (IR affinity 1 Shimadzu, Japan) using diffuse reflectance scan (DRS) sampling method (1 mg sample in 100 mg KBr). The scanning range was of 4000-400 cm – 1 with resolution of 1 cm – 1.
2.5.2 Scanning Electron Microscopy:
Electron micrographs of RG and MSD were obtained using scanning electron microscope (JSM 6390LV, JEOL, Peabody MA, USA) operating at 10-kV accelerating voltage. 2.5.3 Differential Scanning Calorimetry:
DSC curves of RG, PEG 6000, physical mixture and MSD
were obtained by a differential scanning calorimeter (DSC 822e, Mettler Toledo, USA). Samples weighing between 5 and 10 mg were loaded in aluminium pans and placed into DSC cell. Thermal analysis of samples was carried out at a scanning rate of 10°C/min, covering a temperature range of 30–300 °C.
2.5.4 X-Ray Powder Diffraction Studies:
Powder XRD patterns of RG, PEG 6000, physical mixture and MSD were recorded using Mettler diffractometer (AXS D8 Advance, Bruker). Samples were exposed to X-ray radiation (Cu Kα) with wavelength 2 A°. The rate of scanning was of 2°/mm and a chart speed of 2°/2 cm per 2θ.
3. Result and Discussion
3.1 Solubility Studies
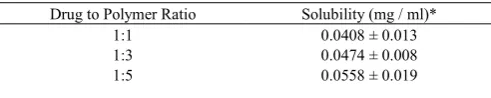
[image:3.595.313.551.539.639.2]The optimization of drug: polymer ratio was done by solubility determination in USP dissolution medium containing citric acid and sodium phosphate pH 5 at 37 ± 0.2° C. Ratio optimization data are shown in Table 1 and suggest significant (ρ < 0.001) enhancement of solubility in the case of the 1: 5 ratio of RG to PEG 6000. Solubility data for RG, physical mixture and solid dispersions prepared by various methods are given in Table 2. Solubility data shows that PEG 6000 enhances the solubility of RG using different methods of solid dispersion formulations. Solid dispersion of RG: PEG 6000 by microwave method presented highest increase in solubility among all solid dispersions with solubility reading of 0.1830 ± 0.017 mg/ml. The superior solubility profile observed for microwave induced solid dispersions is attributed to, amorphization of drug by microwaves, improved surfactant and wetting characteristics of carrier with drug.
Table 1. Solubility study of repaglinide, physical mixture and solid dispersions.
Product Solubility (mg / ml)*
RG Physical Mixture WSD
ESD SSD FSD MSD
0.0352 ± 0.001 0.0558 ± 0.019 0.0593 ± 0.024 0.0606 ± 0.007 0.1117 ± 0.031 0.1348 ± 0.021 0.1830 ± 0.017
All results were calculated as mean ± standard deviation, n = 3., * indicates ρ < 0.001.
Table 2. Ratio optimization of repaglinide and PEG 6000
Drug to Polymer Ratio Solubility (mg / ml)*
1:1 1:3 1:5
0.0408 ± 0.013 0.0474 ± 0.008 0.0558 ± 0.019
[image:3.595.309.555.683.732.2]3.2 Dissolution Studies:
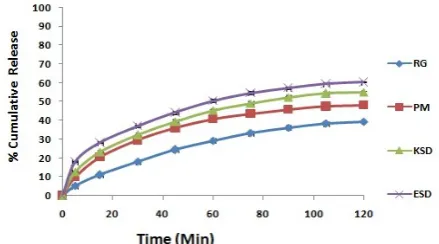
In vitro dissolution studies of RG, physical mixture and solid dispersions were performed in 900 ml of pH 5 USP dissolution medium containing citric acid and sodium phosphate. The dissolution profile of RG, physical mixture and solid dispersions prepared by kneading method is shown
in Fig. 1. The dissolution profile of RG, solid dispersions
prepared by solvent evaporation, conventional fusion and microwave induced fusion method are shown in Fig. 2. The dissolution profile of RG was compared with solid dispersions prepared by different methods. Solid dispersion prepared by microwave method showed a maximum cumulative release of 86.04 ± 0.44 % at the end of 120 min, while at the same time solid dispersion prepared by kneading with water, kneading with ethanol, solvent evaporation method and conventional fusion method released 54.87 ± 0.68 %, 60.32 ± 0.25%, 62.51 ± 0.89% and 69.09 ± 0.36 % of RG respectively, The corresponding percentage of RG alone was only 39.37 ± 0.25 %. These results suggest remarkable enhancement of dissolution rate of RG from solid
dispersions. The superior dissolution profile observed for
microwave induced solid dispersions is attributed to amorphization of drug by microwaves, improved surfactant and wetting characteristics of carrier with drug. The improved wetting of drug is due to better intimate contact between the RG and PEG 6000. Microwave equipment uses electromagnetic waves that pass through material and cause the molecules to oscillate, generating heat at each point of the material by the interaction of the electromagnetic field with its molecular and electronic structure. Thus microwaves, with their ability to penetrate any substance, allow the production of heat throughout the sample at the same rate resulting in rapid and uniform volumetric heating providing molecular dispersions with better intimate contact between drug and carrier [13, 14].
The results of percentage drug release in DE at 30 and 60 min are presented in Table 3. This provides an insight about the ability of carrier and dispersion method to solubilize RG. The microwave induced solid dispersions showed a significant enhancement in dissolution rate as compared with pure RG at 30 and 60 min.
All results were calculated as mean ± 3 S.D. RG: repaglinide, PM: physical mixture, KSD: kneading with water, ESD: kneading with ethanol.
Figure 1. Dissolution profile of RG, physical mixture and solid dispersions prepared by kneading method.
[image:4.595.321.549.78.212.2]All results were calculated as mean ± 3 S.D. RG: repaglinide, SSD: solvent evaporation method, FSD: conventional fusion method and MSD: microwave induced fusion method.
[image:4.595.314.552.314.424.2]Figure 2. Dissolution profile of RG, solid dispersions prepared by solvent evaporation method, conventional fusion method and microwave induced fusion method.
Table 3. Percentage drug release in dissolution efficiency of RG, physical mixture and solid dispersions.
Product DE30 DE60
RG PM (1:5)
WSD ESD SSD FSD MSD
18.0911 ± 0.2581 29.5229 ± 0.6809 32.2345 ± 0.2609 37.1278 ± 0.6761 39.9515 ± 0.7686 46.0936 ± 0.4449 59.5246 ± 0.6796
29.2487 ± 0.6772 40.8390 ± 0.1.080 45.2379 ± 0.5154 50.5014 ± 0.9280 52.9812 ± 1.1190 61.3570 ± 0.6700 76.7873 ± 0.9266
All results were calculated as mean ± standard deviation, n = 3.
3.3 Characterization of solid dispersion 3.3.1 Infrared Spectroscopic Study:
FT-IR spectra were used to investigate the possibility of interactions between RG and PEG 6000 in the solid state. Infrared spectra’s of RG, PEG 6000, physical mixture and solid dispersion prepared by microwave method are presented in Fig. 3. Pure RG spectra showed sharp characteristic peaks at 3307, 2935, 1919, 1686, 1636, 1588 and 1217, cm−1. All the above characteristic peaks appear in the spectra of all binary systems at the same wave number. The spectra of physical mixture and solid dispersion were identical and the main absorption bands of RG appeared in all the spectra in the region of C=O carboxyl group absorption around 1919 cm−1. Similarly, the NH group located at 3307 cm−1 was not shifted. This indicated that there was no distinction between the internal structures and conformation of these samples at the molecular level. 3.3.2 Differential Scanning Calorimetry:
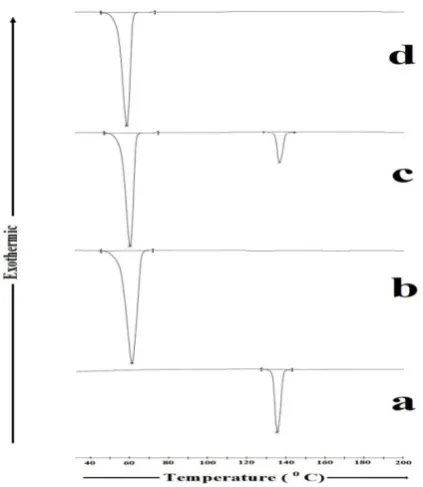
[image:4.595.68.288.579.701.2]microwave induced solid dispersion are shown in Fig. 4. The thermal curve of RG was typical of a crystalline anhydrous substance with a sharp endothermic peak at 1360C corresponding to its melting point, PEG 6000 exhibited characteristic peaks at 62.730C. The DSC curve of the physical mixture as well as solid dispersion prepared by microwave method showed endothermic peaks corresponding to the melting point of PEG 6000. The absence of RG peak in case of solid dispersion could be attributed to molecular dispersion of drug in PEG 6000.
Figure 3. Fourier transformed infra-red spectra of (a) repaglinide (RG), (b) PEG 6000, (c) physical mixture (PM) and (d) microwave induced solid dispersion (MSD).
Figure. 4: Differential scanning calorimetric curves of (a) repaglinide (RG), (b) PEG 6000, (c) physical mixture (PM) and (d) microwave induced solid dispersion (MSD).
3.3.3 X-Ray Powder Diffraction Studies:
[image:5.595.312.545.263.595.2]Diffraction spectra of pure RG, PEG 6000 and solid dispersions prepared by microwave induced fusion method are presented in Fig. 5. The X-ray diffractogram of RG has sharp peaks at diffraction angles (2θ) 7.6°, 9.9°, 13°, 16.5°, 20.1°, 22.6°, and 30.5° showing a typical crystalline pattern. XRD pattern of PEG 6000 showed sharp peaks at diffraction angles (2θ) 18.98° and 23.13°. Solid dispersion showed diffraction peaks at diffraction angles (2θ) 18.98° and 23.13°corresponding to PEG 6000 while peaks of pure RG were absent. This proves the conversion of crystalline form of drug into amorphous form in microwave induced solid dispersion. Thus, results of XRD support the findings of the DSC study.
Figure 5. X- ray diffraction spectra of (a) repaglinide (RG), (b) PEG 6000, (c) physical mixture (PM) and (d) microwave induced solid dispersion (MSD).
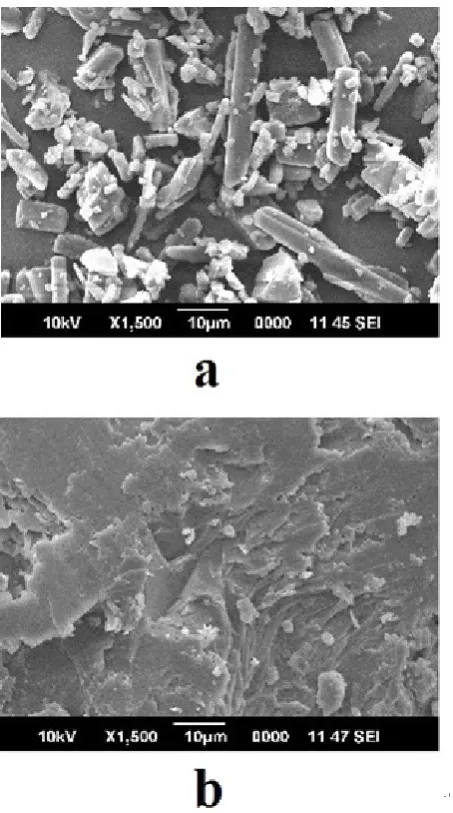
3.3.4 Scanning Electron Microscopy:
[image:5.595.72.284.460.704.2]Figure 6. Scanning electron microscopy photographs of (a) repaglinide and (b) microwave induced solid dispersion (MSD).
3. Conclusion
The study employed kneading method, solvent evaporation method, conventional fusion method and microwave induced fusion method with PEG 6000 as carrier to generate solid dispersions for dissolution enhancement of RG. The dissolution rate of RG from solid dispersions with PEG 6000 was enhanced. The enhancement of dissolution of RG from microwave induced solid dispersion can be attributed to a number of factors. The mechanism involves conversion of crystalline form of RG to amorphous form, increased wettability and dispersibility. Thus, the study ensured the proclaimed claims of microwave technique as green, effective, solvent free alternative mean for making the solid dispersions for poorly soluble dugs like RG.
Acknowledgments
The authors are grateful to Ajanta Pharmaceuticals Ltd (Mumbai, India) for providing gift sample of repaglinide. They are also grateful to the R. C. Patel Institute of Pharmaceutical Education and Research for providing all the necessary facilities and infrastructure to carry out this study.
REFERENCES
[1] James K, Solubility and related properties, vol. 28, Marcel Dekker, Newyork; 1986. pp.127 –146, 355 – 395.
[2] Feeley, J. C., York, P., Sumby, B. S., Dicks, H. Determination of surface properties and flow characteristics of salbutamol sulphate, before and after micronisation. Int. J. Pharm., 172:89–96, 1998.
[3] Fromming, K.H., Szejtli, J. Cyclodextrins in Pharmacy, Kluwer Academic Publisher, Dordrecht; 1993. pp. 45 – 82. [4] Chiou, W.L., Riegelman, S. Pharmaceutical application of
solid dispersion system. J. Pharm. Sci., 60:1281–1302, 1971. [5] Serajuddin, A.T.M. Solid dispersion of poorly water-soluble drugs: early promises, subsequent problems, and recent breakthroughs. J. Pharma. Sci., 159:85–93, 1999.
[6] Narang, A.S., Srivastava, A.K. Evaluation of solid dispersions of clofazimine. Drug Dev. Ind. Pharm., 28:1001–1013, 2002.
[7] Shilpi, S., Sanjula, B., Mushir A., Anil K., Javed A. Solid dispersion: An alternative technique for bioavailability enhancement of poorly soluble drugs. Journal of Dispersion Science and Technology., 30:1458–1473, 2009.
[8] Ford, J. L. The current status of solid dispersion. Pharmaceutica Acta Helvetica. 61: 69–88, 1986.
[9] Craig, D.Q.M. Polyethylene glycols and drug release. Drug Dev. Ind. Pharm., 16: 2501–2526, 1990.
[10] Craig D.Q.M. The mechanisms of drug release from solid dispersions in water soluble polymers. Int. J. Pharm., 23:131–144, 2002.
[11] Corrigan O.I. Mechanisms of dissolution of fast release solid dispersions. Drug Dev. Ind. Pharm., 11: 697–724, 1985. [12] Jalali, M.B., Valizadeh, H., Shadbad, M.S., Adibkia, K.,
Mohammadi, G., Farahani, A., Arash, Z., Nokhodchi, A. Cogrinding as an approach to enhance dissolution rate of a poorly water-soluble drug (gliclazide). Powder Technology., 197:150–158, 2010.
[13] Zawar L R., Bari S B. Preparation, Characterization and In vivo Evaluation of Antihyperglycemic activity of Microwave generated Repaglinide Solid Dispersion, Chem.Pharm.Bull., 60 (4): 482–487, 2012.
[14] Moneghini, M., Bellich, B., Baxa, P., Princivalle, F. Microwave generated dispersions containing Ibuprofen, Int. J. Pharm., 361: 125–130, 2008.
[image:6.595.70.297.77.484.2][16] Betageri, G. V and Makarla, K. R. Enhancement of dissolution of. Glyburide by solid dispersion and lyophilization techniques. Int. J. Pharm., 126:155–160, 1995.
[17] Mooter, G. V., Kinget, R., Blaton, N and Damian, F. Physical stability of solid dispersion of anti-viral agent UC-781 with PEG 6000, Gelucire®44/14 and PVK 30. Int. J. Pharm., 244:87–98, 2002.
[18] Betageri, G. V and Makarla, K. R. Characterization of glyburide-polyethylene by solid dispersions. Drug Dev. Ind.Pharm., 22(7):731–734, 1996.
[19] Culy, C., Jarvis, B. Repaglinide, a review of its therapeutic use in Type 2 diabetes mellitus. Drugs., 61:1625–1660, 2001.
[20] Malaisse, W. Repaglinide, a new oral antidiabetic agent: a
review of recent preclinical studies. Eur. J. Clin. Invest., 29: 21–29, 1999.
[21] Blickle´, J.F. Meglitinide analogues: a review of clinical data focused on recent trials. Diabetes andMetabolism., 32: 113–120, 2006.
[22] Marbury, T.C., Ruckle, J.L., Hatorp, V., Andersen, M.P., Nielsen, K.K., Huang, W.C., Strange, P. Pharmacokinetics of repaglinide in subjects with renal impairment. Clin. Pharmacol. Ther., 67: 7–15, 2000.
[23] Marbury, T., Huang, W., Strange, P., Lebovitz, H. Repaglinide versus glyburide: a one-year comparison trial. Diabetes Res. Clin. Pract., 43: 155–166, 1999.