Available online www.jocpr.com
Journal of Chemical and Pharmaceutical Research, 2013, 5(12):1521-1528
Research Article
CODEN(USA) : JCPRC5
ISSN : 0975-7384
Optimizing the performance of disease classification using nested-random
forest and nested-support vector machine classifiers
Austin H. Chen and Chia Hung Lin
Department of Medical Informatics, Tzu Chi University, Taiwan
_____________________________________________________________________________________________
ABSTRACT
The classifier performance will be affected by the parameters of the model. However, how to effect diagnose and classify disease using the optimum model is becoming an urgent issue. In this paper, we propose two new classifiers that can automatically search for the optimum parameters of the model. We called these two classifiers are Nested–Random Forest (Nested-RF) classifier and Nested–Support Vector Machine (Nested-SVM) classifier. Five datasets of cancer (brain cancer, colon cancer, DLBCL, leukemia, prostate cancer) and one disease (Parkinson's) datasets were used to evaluate the performance of the proposed classifiers. Our results show the superior performance of the Nested-SVM classifier. Compared to the other three classifiers, the Nested-SVM classifier can improve classification performance (ranged from 2 to 5% in accuracy, sensitivity, and specificity) in cancer classification. In Parkinson's disease classification, the Nested-SVM classifier shows the superior performance with the accuracy up to 93% that are 20% more than the results from other three classifiers. The results imply that the Nested-SVM classifier has the potential of becoming the standard of setting classifier parameters and maybe suitable for the diagnosis of patients with cancers and Parkinson’s disease.
Key words: cancer classification, disease classification, optimizing parameter, ANOVA, nested - random forest,
nested - support vector machine
_____________________________________________________________________________________________
INTRODUCTION
Cancer is the most deadly genetic disease; it occurs either through epigenetic changes or mutations that lead to altered gene expressions profile of cancerous cells. Meanwhile, Parkinson’s and other neurodegenerative illnesses common in the elderly are on their way to overtaking cancer as a leading cause of death according to the statistics of United Nations [1]. Currently, how to effect diagnose and classify cancer and Parkinson’s disease based on new developed gene expression profiles are becoming an important challenge [2]. Microarray technologies now provide wealth information by screening thousands of genes simultaneously and determining the different expression levels of genes in normal or diseased cells. Over the past few years, microarray-based gene expression profiling has proven to be a promising approach in predicting disease classification and prognosis outcomes [3].
classification Trees [7]. A concept of ensemble voting is developed in order to improve the classific
RF can get better classification accuracy by growing an ensemble of trees and letting them vote for the most popular class [8, 9, 10].
In both SVM and RF, the model for classification is generated from the training samples. Classification
performed based on the trained model with parameters. If the parameter values are not set properly, then the classification outcomes will be less than optimal. In many methods of selecting optimum parameters, grid search is the simplest way that produces the high classification accuracy from sets of parameter values. However, this type of search is a local search and prone to a local optimality. To improve the grid search technique, an approach that combines genetic algorithms and the SVM is devel
genetic algorithms to generate a set of parameter values for SVM [11, 12].
This study proposes two approaches that apply nested cross in the Nested-RF classifier and Nested
discusses the materials and methods used in this paper. Section III presents the results of four classifiers. Section IV summaries the conclusion.
This study develops two classifiers Machine (Nested-SVM) classifier -
variance (One Way ANOVA) was used for gene selection method due to the multiple classes of the datasets.
2.1.Data source and experimental flowchart
To compare the classification performance, we apply these classifiers to the patients with five kinds of
cancer, colon cancer, DLBCL, leukemia, and prostate cancer) and the Parkinson’s disease. The microarray datasets are available in the Gene Expression Omnibus (GEO) database. The characterics of six microarray datasets is listed in Table 1. Related literature for each disease is also included in this table.
Table 1 Dataset name Number of classes Number of features
Brain Cancer 5 5920
Colon Cancer 2 2000
DLBCL 2 5469
Leukemia 3 11225
Prostate Cancer 2 10509
Parkinson’s disease 3 22283
classification Trees [7]. A concept of ensemble voting is developed in order to improve the classific
RF can get better classification accuracy by growing an ensemble of trees and letting them vote for the most popular
In both SVM and RF, the model for classification is generated from the training samples. Classification
performed based on the trained model with parameters. If the parameter values are not set properly, then the classification outcomes will be less than optimal. In many methods of selecting optimum parameters, grid search is the roduces the high classification accuracy from sets of parameter values. However, this type of search is a local search and prone to a local optimality. To improve the grid search technique, an approach that combines genetic algorithms and the SVM is developed recently. The model imitates chromosome coding in their genetic algorithms to generate a set of parameter values for SVM [11, 12].
This study proposes two approaches that apply nested cross-validation method to select the optimum parameters used RF classifier and Nested-SVM classifier. The remainder of this paper is organized as follows. Section II discusses the materials and methods used in this paper. Section III presents the results of four classifiers. Section IV
EXPERIMENTAL SECTION
This study develops two classifiers - Nested-Random Forest (Nested-RF) classifier and Nested
that can improve the performance of disease classification. One way analysis of variance (One Way ANOVA) was used for gene selection method due to the multiple classes of the datasets.
Data source and experimental flowchart
To compare the classification performance, we apply these classifiers to the patients with five kinds of
cancer, colon cancer, DLBCL, leukemia, and prostate cancer) and the Parkinson’s disease. The microarray datasets are available in the Gene Expression Omnibus (GEO) database. The characterics of six microarray datasets is listed in
lated literature for each disease is also included in this table.
Table 1.Data sources for five cancers and Parkinson’s disease
Number eatures Number of samples Diagnostic task
5920 90 5 human brain tumor types 2000 62 Colon tumor and normal tissues
5469 77 Diffuse large B-cell lymphomas and follicular lymphomas 11225 72 AML, ALL, MLL
10509 102 Prostate tumor and normal tissues
22283 105 Parkinson's disease, neurological disease control, healthy control
Figure 1.Experimental flowchart
classification Trees [7]. A concept of ensemble voting is developed in order to improve the classification accuracy. RF can get better classification accuracy by growing an ensemble of trees and letting them vote for the most popular
In both SVM and RF, the model for classification is generated from the training samples. Classification is then performed based on the trained model with parameters. If the parameter values are not set properly, then the classification outcomes will be less than optimal. In many methods of selecting optimum parameters, grid search is the roduces the high classification accuracy from sets of parameter values. However, this type of search is a local search and prone to a local optimality. To improve the grid search technique, an approach that oped recently. The model imitates chromosome coding in their
validation method to select the optimum parameters used SVM classifier. The remainder of this paper is organized as follows. Section II discusses the materials and methods used in this paper. Section III presents the results of four classifiers. Section IV
RF) classifier and Nested-Support Vector that can improve the performance of disease classification. One way analysis of variance (One Way ANOVA) was used for gene selection method due to the multiple classes of the datasets.
To compare the classification performance, we apply these classifiers to the patients with five kinds of cancer (brain cancer, colon cancer, DLBCL, leukemia, and prostate cancer) and the Parkinson’s disease. The microarray datasets are available in the Gene Expression Omnibus (GEO) database. The characterics of six microarray datasets is listed in
Reference number
Austin H. Chen and Chia Hung Lin
J. Chem. Pharm. Res., 2013, 5(12):1521-1528
______________________________________________________________________________
The experimental flowchart is illustrated in Figure 1.
Figure 1 show the five steps used in this study. The first step is to normalize the microarray dataset. The second step is to select a subset of genes using ANOVA gene selection method. The third step is to develop four classifiers, including Random Foreast (RF), Nested-RF, Support Vector Machine (SVM), and Nested-SVM. The fourth step is to execute the cross validation. We use the random average 3-fold cross validation method that randomly separates dataset into 3-fold and repeat validation 100 times in order to get the impartial performance results for our models [19]. The final step is to compare the classification performance (accuracy, sensitivity, and specificity) of these four classifiers.
2.2. ANOVA gene selection method
The Analysis of Variance (ANOVA) is a method that is suitable for the analysis of multiple-classes dataset. In this proposal, we propose a one-way ANOVA approach to identify the significant genes from gene expression profiles. The formula of Sum of squares within the classes is calculated as:
(
)
2∑
−
=
x
ix
kSSW
Where Xi is the value of each sample, Xkis the average of the sample values for each of the classes. The formula of Sum of squares between the classes is:
( )
2∑
−
=
N
x
x
SSB
k kThe next step is to calculate between groups’ mean square (MSB) and within groups mean square (MSW) defined as:
1
−
=
k
SSB
MSB
Where k-1 is the degrees of freedom associated with SSB.
k
n
SSW
MSW
−
=
Where n-k is the degrees of freedom associated with SSW. A new statistic, called the F-ratio is computed by dividing the MSB by MSW. This is illustrated below:
k
n
SSW
k
SSB
MSW
MSB
F
−
−
=
=
1
In an ANOVA, the F-ratio is the statistic used to test the hypothesis that the effects are real: in other words, that the means are significantly different from one another. The corresponding P value can be obtained using F value. The significant genes will be selected from the genes which have a P value less than 0.05. By comparing these significant genes with the real biological genes (genes that have medical evidence), we could prove how good of this method is.
2.3.Optimum Parameter Selection Method
2.4. Nested–Random Forest (Nested-RF) classifier
The Nested-RF classifier combined both nest cross-validation approach and RF classification technique. This new classifier is used to obtain the best classification accuracy based on optimum parameters of RF classifier.
The parameters in Nested-RF include: Mtry = square of (number of genes) Ntree = {10, 20, 30, 40, 50, 60, 70, 80} Mtryfactor = {0.25, 0.5, 0.75, 1, 1.5, 2, 3, 4} Nodesize = {1, 2, 3, 4, 5, 6, 7, 8}
Nested-RF randomly selects the values from the interval of each parameter at a total of 30 different combinations. The optimum parameters were found with the best classification accuracy.
2.5.Nested–Support Vector Machine (Nested-SVM) classifier
The Nested-SVM classifier combined both nest cross-validation approach and SVM classification technique. This new classifier is used to obtain the best classification accuracy based on optimum parameters of SVM classifier. In this paper, we develop the Nested-SVM classifier using LibSVM [21] parameters and MatLab language.
The parameters in SVM include -t = {0, 1, 2, 3}
-d = {0, 1, 2, 3, 4, 5, 6, 7}
-g = {0.2/number_0f_features, 0.4/number_0f_features, 0.6/number_0f_features, 0.8/number_0f_features, 1.0/number_0f_features, 1.2/number_0f_features, 1.4/number_0f_features,, 1.6/number_0f_features}
-r = {0, 0.1, 0.2, 0.3, 0.4, 0.5, 0.6, 0.7, 0.8,0.9, 1, 1.1, 1.2, 1.3, 1.4, 1.5} -c = {0.1, 1, 10, 100, 1000, 10000, 100000, 1000000}
-h = {0, 1}
-wi = {0.5, 1, 1.5, 2, 2.5, 3, 3.5, 4}
Nested-SVM randomly selects the values from the interval of each parameter at a total of 30 different combinations. The optimum parameters were found with the best classification accuracy.
2.6. Confusion Matrix
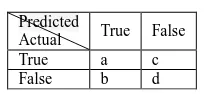
[image:4.595.255.360.533.580.2]In a supervised learning, the performance can be visualized by a specific layout of a confusion matrix. Each column of the matrix represents the instances in a predicted class, while each row represents the instances in an actual class. In two classes, confusion matrix is expressed as in Table 2 that reports the number of instances in each class.
Table 2.Confusion matrix of two classes
Predicted
Actual True False True a c False b d
The formula of Accuracy, Sensitivity, and Specificity are represented respectively as:
(
a
b
c
d
)
d
a
Accuracy
+
+
+
+
=
( )
a
c
a
y
Sensitivit
+
=
(
b
d
)
d
y
Specificit
+
=
Austin H. Chen and Chia Hung Lin
J. Chem. Pharm. Res., 2013, 5(12):1521-1528
______________________________________________________________________________
Table 3.Confusion matrix of three classes
Predicted
Actual
H E C H ZHH ZHE ZHC E ZEH ZEE ZEC C ZCH ZCE ZCC
The number Zij represents the number of times the input is predicted to be in class j while belonging in reality to class i. The number of inputs associated with class i is given by
∑
= j Zij i
X
and the number of inputs predicted to be in class i is given by
∑
= j Z ji i
Y
Therefore, the number of inputs can be summed by
XH = ZHH + ZHE + ZHC
YH = ZHH + ZEH + ZCH
XE = ZEH + ZEE + ZEC
YE = ZHE + ZEE + ZCE
XC = ZCH + ZCE + ZCC
YC = ZHC + ZEC + ZCC
The values of Accuracy, Sensitivity, and Specificity in three classes are represented respectively as
C X E X H X
CC Z EE Z HH Z Accuracy
+ +
+ + =
i X
ii Z y
Sensitivit =
i Y
ii Z y Specificit =
RESULTS AND DISCUSSION
Since the performance of classifiers will be overestimated when using the Leave-one-out method, we verified our experiment using a random average 3-fold method. This method randomly separates datasets into 3-folds and repeat validation 100 times in order to get the impartial performance results for our model. For ease of visualization, we drew a bar accuracy comparison of these 4 classifiers as shown in Figure 2.
.
Figure 2.Comparison of classification accuracy in five cancers and Parkinson’s disease for four kinds of classifiers
0.00% 20.00% 40.00% 60.00% 80.00% 100.00% 120.00%
RF Nested-RF SVM Nested-SVM
Brain Cancer DLBCL
Prostate Cancer Colon Cancer Leukemia
This figure shows the Nested-SVM classifier has the best classification accuracy. Compared to the other three classifiers, the Nested-SVM classifier in general has better and more stable classification accuracy in all six datasets. The accuracy is near 90% in all six diseases. The Nested-RF classifier, however, do not provide any benefit in this study.
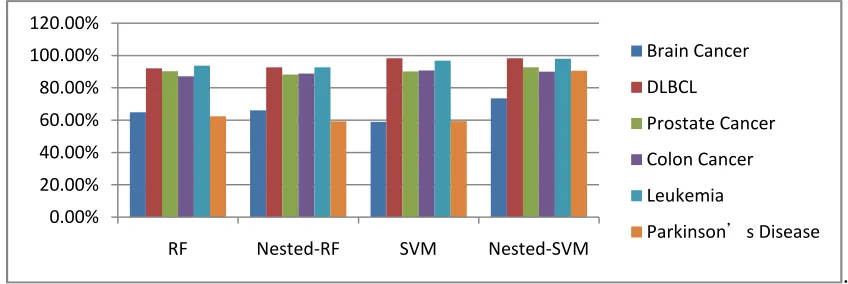
Except for the accuracy, the performance also includes sensitivity and specificity. Sensitivity measures the proportion of actual positives which are correctly identified as having the condition. The comparison of sensitivity is showed in Figure 3.
[image:6.595.93.517.175.317.2].
Figure 3.Comparison of classification sensitivity in five cancers and Parkinson’s disease for four kinds of classifiers
Figure 3 shows apparently the advantages of the Nested-SVM classifier. Compared to the other three classifiers, the Nested-SVM classifier has far better classification sensitivity in all six datasets. Except for the sensitivity in brain cancer, which is less than 80%, all the other five diseases have a better than 90% sensitivity.
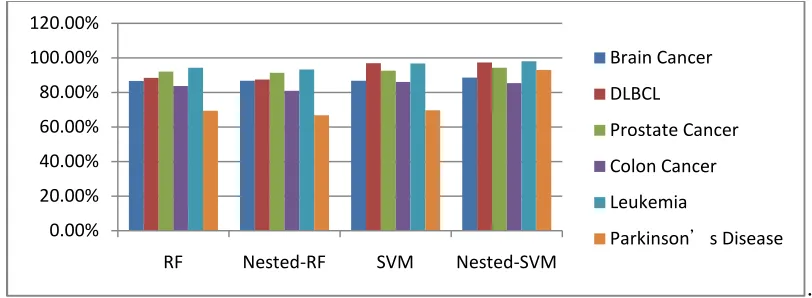
Specificity measures the proportion of negatives which are correctly identified as such (e.g. the percentage of healthy people who are correctly identified as not having the condition). The comparison of specificity in five cancers and the Parkinson’s disease for four kinds of classifiers is showed in Figure 4.
[image:6.595.87.526.437.604.2].
Figure 4.Comparison of classification specificity in five cancers and Parkinson’s disease for four kinds of classifiers
The advantages of the Nested-SVM classifier are apparent as seen in Figure 4. The Nested-SVM classifier has far better classification specificity in all six datasets when compared to the other three classifiers. Except for the specificity in brain cancer, which is less than 80%, all the other five diseases have a better than 90% specificity. The comparison of classification performance (accuracy, sensitivity, and specificity) for four classifiers from six disease microarray datasets is summarized in Table 4.
0.00% 20.00% 40.00% 60.00% 80.00% 100.00% 120.00%
RF Nested-RF SVM Nested-SVM
Brain Cancer DLBCL
Prostate Cancer Colon Cancer Leukemia
Parkinson’s Disease
0.00% 20.00% 40.00% 60.00% 80.00% 100.00% 120.00%
RF Nested-RF SVM Nested-SVM
Brain Cancer DLBCL
Prostate Cancer Colon Cancer Leukemia
Austin H. Chen and Chia Hung Lin
J. Chem. Pharm. Res., 2013, 5(12):1521-1528
______________________________________________________________________________
Table 4.Classification performance of five cancers and Parkinson’s disease for four kinds of classifiers
Brain Cancer Colon Cancer
accuracy sensitivity specificity accuracy sensitivity specificity
RF 86.69% 64.86% 69.65% RF 83.72% 87.23% 88.21%
Nested-RF 86.82% 66.15% 69.85% Nested-RF 81.03% 88.78% 84.22%
SVM 86.85% 58.93% 58.95% SVM 86.18% 90.75% 88.70%
Nested-SVM 88.66% 73.51% 73.96% Nested-SVM 85.45% 89.96% 88.61%
DLBCL Leukemia
accuracy sensitivity specificity accuracy sensitivity specificity
RF 88.42% 92.04% 92.81% RF 94.26% 93.70% 95.27%
Nested-RF 87.53% 92.63% 91.46% Nested-RF 93.38% 92.70% 94.56%
SVM 96.89% 98.32% 97.64% SVM 96.85% 96.79% 96.98%
Nested-SVM 97.30% 98.28% 98.20% Nested-SVM 98.06% 98.03% 98.21%
Prostate Cancer Parkinson’s Disease
accuracy sensitivity specificity accuracy sensitivity specificity
RF 92.12% 90.25% 94.34% RF 69.43% 62.36% 70.62%
Nested-RF 91.34% 88.19% 94.75% Nested-RF 66.83% 59.19% 64.38%
SVM 92.61% 90.09% 95.39% SVM 69.78% 59.41% 75.50%
Nested-SVM 94.31% 92.60% 96.23% Nested-SVM 93.05% 90.53% 93.83%
Table 4 summarizes the classification results for five cancers and the Parkinson’s disease from four classifiers. A comparison of the average performance across six datasets suggests the superiority of the Nested-SVM classifier. Compared to the other three classifiers, the Nested-SVM classifier improves classification performance (accuracy, sensitivity, and specificity) at the range around 2 – 5% when it is applied to five cancer datasets. It is more impressive that the Nested-SVM classifier significantly improve the classification performance (accuracy, sensitivity, and specificity) at the range around 20% when it is applied to the Parkinson’s disease dataset. The average accuracy, sensitivity, and specificity can reach 93%, 90%, and 93% respectively. The results imply that the Nested-SVM classifier has the potential for the diagnosis and prevention of patients with cancer or the Parkinson’s disease.
CONCLUSION
This study develops two approaches, Nested-RF classifier and Nested-SVM classifier, which can automatically search for the optimum parameters of the model. In order to evaluate the benefits of these classifiers, we apply them to five cancers (brain cancer, DLBCL, prostate cancer, colon cancer, and leukemia) and the Parkinson’s disease. The significant genes were selected from the genes which have a P value less than 0.05 using the ANOVA gene selection method. A comparison of the classification results obtained from four different classifiers, the proposed Nested-SVM classifier is demonstrated to be the best model. Compared to the other three classifiers, the Nested-SVM classifier improves classification performance (accuracy, sensitivity, and specificity) at the range around 2 – 5% when it is applied to five cancer datasets. It is more impressive that the Nested-SVM classifier significantly improve the classification performance at the range around 20% when it is applied to the Parkinson’s disease dataset. The average accuracy, sensitivity, and specificity can reach 93%, 90%, and 93% respectively. The results imply that the Nested-SVM classifier has the potential of becoming the standard of setting classifier parameters and maybe suitable for the diagnosis of patients with cancers and Parkinson’s disease.
Acknowledgments
The authors thank the National Science Council for its financial support for project NSC 102-2221-E-320-001 and Tzu Chi Foundation for its financial support for project TCRPP101002.
REFERENCES
[1] A. Lozano, S. Kalia, Scientific American, 2005, 293(1), 68. [2] D.K. Slonim, Nature genetics, 2002, 32,502-508.
[3] A.H. Chen, M. Lee, International Journal of Advancements in Computing Technology, 2011, 3(3), 30-39. [4] V.N. Vapnik, Neural Networks, IEEE Transactions on, 1999, 10(5), 988-999.
[5] H. Chih-Wei, L. Chih-Jen, Neural Networks, IEEE Transactions on, 2002, 13(2), 415-425. [6] A. Statnikov, L. Wang, C.F. Aliferis, BMC bioinformatics, 2008, 9,319.
[7] L. Breiman, Machine Learning, 2001, 45(1), 5-32. [8] T. Dietterich, Machine Learning, 2000, 40(2), 139-157.
[9] H. Tin Kam, Pattern Analysis and Machine Intelligence, IEEE Transactions on, 1998, 20(8), 832-844. [10] R. Diaz-Uriarte, S. Alvarez de Andres, BMC bioinformatics, 2006, 7(1), 3.
[12] A.H. Chen, C. Yang, Expert Systems with Applications, 2012, 39(5), 4785-4795.
[13] S.L. Pomeroy, P. Tamayo, M. Gaasenbeek, L.M. Sturla, M. Angelo, M.E. McLaughlin, J.Y. Kim, L.C. Goumnerova, P.M. Black, C. Lau, Nature, 2002, 415(6870), 436-442.
[14] U. Alon, N. Barkai, D.A. Notterman, K. Gish, S. Ybarra, D. Mack, A.J. Levine, Proceedings of the National Academy of Sciences, 1999, 96(12), 6745-6750.
[15] M.A. Shipp, K.N. Ross, P. Tamayo, A.P. Weng, J.L. Kutok, R.C. Aguiar, M. Gaasenbeek, M. Angelo, M. Reich, G.S. Pinkus, Nature medicine, 2002, 8(1), 68-74.
[16] S.A. Armstrong, J.E. Staunton, L.B. Silverman, R. Pieters, M.L. den Boer, M.D. Minden, S.E. Sallan, E.S. Lander, T.R. Golub, S.J. Korsmeyer, Nature genetics, 2002, 30(1), 41-47.
[17] D. Singh, P.G. Febbo, K. Ross, D.G. Jackson, J. Manola, C. Ladd, P. Tamayo, A.A. Renshaw, A.V. D'Amico, J.P. Richie, E.S. Lander, M. Loda, P.W. Kantoff, T.R. Golub, W.R. Sellers, Cancer Cell, 2002, 1(2), 203-209.
[18] C.R. Scherzer, A.C. Eklund, L.J. Morse, Z. Liao, J.J. Locascio, D. Fefer, M.A. Schwarzschild, M.G. Schlossmacher, M.A. Hauser, J.M. Vance, L.R. Sudarsky, D.G. Standaert, J.H. Growdon, R.V. Jensen, S.R. Gullans, Proceedings of the National Academy of Sciences of the United States of America, 2007, 104(3), 955-960.
[19] C. Ambroise, G.J. McLachlan, Proceedings of the National Academy of Sciences, 2002, 99(10), 6562-6566. [20] A. Statnikov, I. Tsamardinos, Y. Dosbayev, C.F. Aliferis, International journal of medical informatics, 2005,
74(7-8), 491-503.