Material Flow Data for Numerical Simulation of
Powder Injection Molding
I. Duretek
1,2,*, C. Holzer
11Department of Polymer Engineering and Science, Montanuniversitaet Leoben, Austria 2Polymer Competence Center Leoben GmbH, Austria
Copyright©2017 by authors, all rights reserved. Authors agree that this article remains permanently open access under the terms of the Creative Commons Attribution License 4.0 International License
Abstract
The powder injection molding (PIM) processis a cost efficient and important net-shape manufacturing process that is not completely understood. For the application of simulation programs for the powder injection molding process, apart from suitable physical models, exact material data and in particular knowledge of the flow behavior are essential in order to get precise numerical results. In this work, the flow behavior of a 316L stainless steel feedstock for powder injection molding was investigated. Additionally, the influence of pre-shearing on the flow behavior of PIM-feedstocks under practical conditions was examined and evaluated by a special PIM injection molding machine rheometer. In order to have a better understanding of key factors of PIM during the injection step, 3D non-isothermal numerical simulations were conducted with a commercial injection molding simulation software using experimental feedstock properties. The simulation results were compared with the experimental results. The mold filling studies amply illustrate the effect of mold temperature on the filling behavior during the mold filling stage. Moreover, the rheological measurements showed that at low shear rates no zero shear viscosity was observed, but instead the viscosity further increased strongly. This flow behavior could be described with the Cross-WLF approach with Herschel-Bulkley extension very well.
Keywords
Viscosity, Rheology, Powder InjectionMolding, Simulation, 316L
1. Introduction
Powder injection molding (PIM) is s a multi-step technology for manufacturing complex metal or ceramic parts. It consists of four sequential technological steps – mixing, injection molding, debinding and sintering. All these steps have an effect on the characteristics of the final parts. Optimization of the PIM process for production is a long and
expensive procedure. The injection molding process as the first step in part production is very critical. With the help of simulation software the injection molding process of PIM can be successfully optimized. For achieving practically relevant simulation results, accurate thermodynamic material data and especially reliable rheological data are necessary. It is important to know the viscosity of the material in order to predict flow patterns and molding forces. Adding fillers to a neat polymer melt changes its rheology, influencing both the way the melt is processed and the properties of the ultimate product. Key factors are filler size and shape, filler concentration, and the extent of any interactions among the particles.
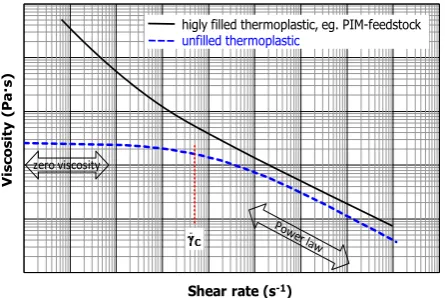
[image:1.595.320.543.577.726.2]The consequences of adding fillers are an increase in melt viscosity and a decrease in die swell. Moreover, particle interactions increase the non-Newtonian (i.e. shear thinning) range and cause it to occur at a lower shear rate than for the unfilled polymer melt. Filled polymers (e.g. PIM-feedstock) have a higher viscosity at low shear rates, and yielding may occur with increased filler concentration (Figure 1). At higher shear rates the effect of the filler decreases and the matrix contributions dominate. Another effect of the filler is the reduction of the linear viscoelastic range, characterized by the onset of the strain dependent behavior [1].
Figure 1. Viscosity curves of a non-Newtonian fluid with (black line) and without yield stress (blue, dashed line)
V
is
co
si
ty
(
P
a·
s)
Shear rate (s-1)
higly filled thermoplastic, eg. PIM-feedstock
unfilled thermoplastic
The simplest description of a non-Newtonian flow behavior is the Power law model, which can capture the constant slope of the decreasing flow curve at higher shear rates. Addition of zero shear viscosity and the onset of shear thinning extend the Power law model (Carreau, Ellis, Cross …).
In contrast to unfilled thermoplastics for PIM-feedstocks no Newtonian plateau is observed at very low shear rates, but instead the viscosity keeps increasing strongly. This indicates the possible presence of the limiting shear stress (flow limit) also known as yield stress or yield point, depending on the material structure and the applied shear stress.
The flow profile differences comparing classical Cross model appropriate for unfilled thermoplastics and the Cross-Herschel-Bulkley model appropriate for PIM-feedstocks are shown in Figure 2. Due to the yield stress the viscosity in the middle of the flow channel (very low shear rates) increases significantly. The result is a flattened velocity profile, well known as plug flow. Here, the whole shear load is concentrated in a very small layer close to the mold wall and the feedstock is “slipping” at this layer of low viscosity, causing typical jetting phenomena. Therefore the standard rheological model for thermoplastics cannot be used to fit the flow behavior of PIM-feedstocks [2].
Figure 2. Flow profile differences for (a) the Cross and (b) the Cross-Herschel-Bulkley model [2]
Shear thinning behavior in combination with the yield stress are generally modeled with the Herschel-Bulkley equation (1)
[
3]
. However for PIM-Feedstocks, the Cross model with Herschel-Bulkley extension (2)[
4]
and CARPOW equation (3)[
5]
are more adequate for describing their flow behavior within a given shear rate range. CARPOW equation is a combination of the Carreau equation and a power law.(1)
(2)
(3)
where: is the yield stress or yield point,
i
s the viscosity, is the shear rate, K, n and are the parameters of flow equations, defines the slope point,α
is the gradient to the higher viscosities, d and C are flow exponents for low and high shear rate range, A and B are Carreau material constants.High pressure capillary rheometers with round dies are versatile and widely used in the rheological measurement of viscous materials at shear rates higher 100 s-1. However,
capillary rheometers with round dies suffer from some limitations when attempting to measure the viscosity of highly filled plastics like PIM-feedstocks.
In general, the pressure curves in Bagley diagrams for unfilled thermoplastic melts are nearly linear, as long as the melt pressure does have a negligible influence on the viscosity.
In highly filled compounds, such as metallic PIM-feedstocks, nonlinear Bagley curves can occur which give physically nonsensical negative pressure entrance lose (see Figure 3). The reason for nonlinear pressure drop in Bagley diagrams can be the pressure dependence of viscosity [6] and on the other hand error in the pressure measurements using the “pressure hole” technique by round rheological dies. The occurrence of flow phenomena such as wall slip and inhomogeneous particle distribution can also lead to nonlinear Bagley plots. Nyborg [7] and Bilovol [8] also found negative pressure losses by measurements on metal PIM-feedstocks. Nyborg [7] determines this effect for a stainless steel 316L feedstock with LLDPE binder system and Bilovol [8] for Catamold 316L. To avoid nonsensical negative pressure losses, one should use a quadratic approximation or optionally the zero-length capillary (e.g. L/D < 0.5).
Previous works [9 - 13] showed that usage of the slit die for the rheological characterization of PIM-feedstocks instead the round die is very beneficial. The major advantage of the silt die is that the pressure transducers can be mounted on the die wall, therefore the pressure drop along the die can be measured directly and the Bagley's correction is not necessary.
[image:2.595.58.296.398.503.2]Figure 3. Bagley diagram with linear and polynomial approximation; stainless steel feedstock 316L with POM - binder system [9]
2. Materials and Methods
2.1. Materials
Two commercial stainless steel feedstocks, Catamold 316LG and Catamold 316LA (BASF) were used for the investigation. Figure 4 shows morphology of the investigated feedstocks recorded with the scanning electron microscopy (SEM). From the SEM images, it can be seen that both feedstocks contain spherical particles coated by the polymeric binder. Each feedstock has a different particle size as shown in Figure 4.
a)
b)
Figure 4. Morphology of the investigated feedstocks; Catamold 316LG (a) and 316LA (b)
2.2. Rheological Measurements
Rheological behavior of feedstocks in shear rate range between 10-3 and approx. 5 s-1 was measured using a
controlled shear stress (CSS) rheometer MCR501 (Anton Paar GmbH) in oscillating mode (Figure 5). Please note that the specified shear rates are based on the assumption that the Cox-Merz rule applies. A smooth plate–plate configuration was used with a gap size of 1 mm and a plate diameter of 25 mm. The sample was protected by a dry nitrogen environment to prevent degradation of the binder system.
a)
b)
Figure 5. Plate-plate rheometer: principle sketch (a), view into measuring chamber of MCR501 (b)
The measurements at shear rates from approx. 100 s-1 to
approx. 4,000 s-1 were performed with the slit die with
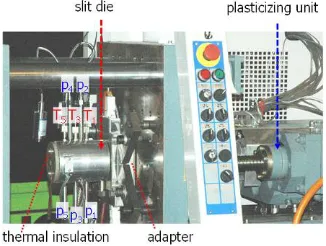
conical entry (see Figure 6) on the high pressure capillary rheometer (HPCR) Rheograph 2002 (Göttfert Werkstoff-Prüfmaschinen GmbH) and on the injection molding machine (IMM) with so-called PIM injection machine rheometer (see Figure 7).
a)
[image:3.595.58.295.76.239.2] [image:3.595.354.508.171.376.2] [image:3.595.100.255.435.667.2] [image:3.595.360.509.495.730.2]Figure 7. Slit die on injection molding machine
Measurements on the PIM injection machine rheometer allowed the rheological characterization under practical processing conditions.
Along the flow path inside the slit die, pressures are measured by five sensors in order to calculate shear stress. The pressure sensors are flush-type sensors, which have direct contact with the melt. The wall temperature is measured at three positions at a distance of 1 mm away from the flow channel wall to identify the wall temperature increases along the flow length due to shear heating.
Width (w) of the slit is 10 mm and height (h) 1 mm, thus they fulfill the requirement of “infinitely wide” (w≥10 h) slit.
The true shear rate was obtained by applying the correction for the non-Newtonian behavior of the melt according to Weissenberg-Rabinowitsch [14, 15]. The experiments were performed at 180, 190 and 200 °C.
2.3. Injection Molding Experiments and the Filling Simulation
For comparing the results of the filling simulation a short shot study was performed on an injection machine ARBURG 320C 500-100 with 20 mm diameter screw. The filling patterns provide information about order of fill, potential sites of porosity formation, race tracking and similar defect producing flow structures.
The mold used in this study was a rectangular plate with deflections with cold runner system (Figure 8 left). The plate thickness is 3 mm. The moving half of the mold and the injection molded part with runner and gate are shown in Figure 8 right.
The process parameters for the injection molding tests (short shot study) were selected by processing instructions from the material manufacturer. For the filling study the dosing volume was varied between 3 and 29 cm3 and the
holding pressure was not applied.
a)
b)
Figure 8. Rectangular plate with deflectors (a) and moving half of the mold (b)
The filling behavior of the injection molding was investigated by commercial software package Autodesk® Simulation Moldflow® Insight (ASMI). Simulations were
performed with 3D-model. The model used for computation in ASMI-software is presented in Figure 9.
Figure 9. Model of the mold cavity with the cooling circuit (blue) and gating system [12]
[image:4.595.361.505.75.364.2] [image:4.595.96.259.78.201.2] [image:4.595.327.550.474.634.2]3. Results and Discussion
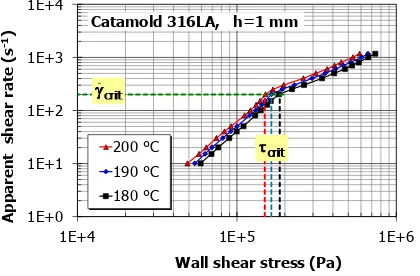
The composition of the feedstock and the pre-shearing has great influence on the flow behavior of PIM-feedstocks. For 316LA whose particle size distribution is bimodal, a change in flow characteristic was observed during the viscosity measurement on the high pressure capillary rheometer with the slit die. This was observed as a change in slope of the flow curve after a particular wall shear stress (τcrit) in the flow curve (see Figure 10).
In calculating of the true viscosity using the Weissenberg-Rabinowitsch correction due to the change in slope of the flow curve the viscosity curve shows an implausible discontinuous trend (see Figure 11).
An explanation for this behavior is that the change in the slope of the flow curve is caused by a rearrangement of the powder distribution in the melt when flowing through the flow channel.
[image:5.595.321.528.219.365.2]Therefore, the flow curve (Figure 10) was divided into two ranges and the true viscosity was calculated separately for each range (see Figure 12).
[image:5.595.66.276.334.472.2]Figure 10. Apparent flow curves of Catamold 316LA, measured with slit die on HCPR at three temperatures
Figure 11. Viscosity curves of Catamold 316LA, measured with slit die on HCPR at three temperatures
The slopes of the viscosity curves for both ranges are nearly unchanged. The viscosity above the critical shear rate (range “B”) is slightly higher than the viscosity in the region below (range “A”).
On the other hand viscosity measurements on the injection molding machine showed no such change in the
slope of the flow curve. In the injection molding machine this rearrangement seems to happen in the screw of the plasticizing unit during plasticization of the feedstock. Viscosity measured on the high pressure capillary rheometer (HCPR) is higher than viscosity measured on the injection molding machine (IMM) (see Figure 13). The possible reason is the melt prepared (homogenization) by the screw in the injection molding machines which shows different conditions in comparison to the high pressure capillary rheometer, e.g. pre-shearing and melt temperature control.
Figure 12. Divided evaluation of the true viscosity of Catamold 316LA
Figure 13. Comparison of the true viscosities of Catamold 316LA, measured with slit die on high pressure capillary rheometer (HPCR) and injection molding machine (IMM)
The viscosity measurements on Catamold 316LG using a controlled shear stress rheometer (CSS) showed that at low shear rates, as expected, the Newtonian plateau is not present (see Figure 14). Instead the viscosity strongly increases in the direction of the yield point. Out of these investigations the Cross-WLF model with Herschel-Bulkley extension (4) was applied to feedstocks as material model. This model takes into account the shear thinning behavior as well as limiting shear stress. It describes very well the rheological behavior of this investigated feedstock.
(4) 1E+0 1E+1 1E+2 1E+3 1E+4
1E+4 1E+5 1E+6
A pparen t sh ear rat e (s -1)
Wall shear stress (Pa)
200 °C 190 °C 180 °C
Catamold 316LA, h=1 mm
1E+2 1E+3 1E+4
1E+0 1E+1 1E+2 1E+3 1E+4
V is co sit y ( P a .s)
Shear rate (s-1)
180 °C 190 °C 200 °C
Catamold 316LA, h=1 mm
1E+2 1E+3 1E+4
1E+1 1E+2 1E+3 1E+4
V is cos it y ( Pa .s )
Shear rate (s-1)
180 °C, HPCR 190 °C, HPCR 200 °C, HPCR
Catamold 316LA, h=1 mm
Range "A" Range "B"
1E+2 1E+3
1E+2 1E+3 1E+4
V is cos it y ( Pa .s )
Shear rate (s-1)
180 °C, HPCR 190 °C, HPCR 200 °C, HPCR 180 °C, IMM 190 °C, IMM 200 °C, IMM
Catamold 316LA, h=1 mm
high pressure capillary rheometer (HPCR) slit die
injection molding machine (IMM) slit die γ − ⋅ τ + η ⋅γ +
η =
η − γ −α⋅γ
) ( ) n 1 ( 4 0
0 1 e
[image:5.595.320.527.376.529.2] [image:5.595.64.275.508.647.2]where: A1, A2, D1, D2, D3 and D4 are material constants, T –
temperature, p - pressure.
Figure 14. Measured viscosities of Catamold 316LG and approximated with the Cross-WLF model with Herschel-Bulkley extension
Figure 15 shows the comparison of experimentally determined and calculated filling patterns for filling stage between 7% and 89%.
Figure 15. Short shots comparison with simulation; Catamold 316LG, injection flow rate: 14 cm3/s, mold temperature: 135 °C [12]
It can clearly be seen, that the fully developed fountain flow which is typical for unfilled thermoplastics does not exist. The shape of the flow front is very coarse and not smooth and over the entire flow front leads to wrinkles formation. The cause for this effect can be the too low mold temperature. The melt front already pushed a cooler region in front of the flow, which will remain visible in the form of flow lines in the filled molding. Additionally, there is an advance of the melt at the middle of the cavity.
Furthermore, the surface of the molded part in the area of the film gate is marked with “black lines”. These “black lines” indicate the powder-binder phase separation of the feedstock; i.e. in this area an elevated binder concentration exists. It is important to point out that phase separation has a major influence on the quality of the green parts.
According to Thornagel [16] the shear gradients are the cause of powder-binder separation and thus two layers of high binder content close to the flow channel wall (Figure 16). Due to adhesion of the feedstock at the wall of the channel, a significant shear rate peak occurs close to the wall and a plateau at a much lower shear rate level is observed in the middle of the flow domain (Figure 16).
Figure 16. Local shear stress gradients cause powder-binder separation [16]
[image:6.595.63.288.148.296.2]Focusing on the powder particles, reaction forces are depending on their current position in the shear rate field and on their size. Particles flowing in the middle of the channel within the plateau of the lower shear rate experience uniform reaction forces and continue their way without changing the direction. Other particles not flowing within the lower shear plateau experience a non-uniform shear rate influence resulting in a rotation of these particles. The rotation speed grows along with the shear stress gradients. Such rotating particles try to leave areas of high shear gradients. Therefore the area of the highest shear rate is characterized by high binder content in the channel while the plateau of the lower shear rate accommodates a powder rich material [16].
Figure 17. Feedstock flow results in transport of separation pattern [16]
Usually in the gate area high shear rate gradients occur. The particle concentration in the volume unit increases while the binder concentration decreases. [16]. Figure 17 shows
− +
⋅ − − ⋅ − ⋅ = η
2 2
3 2 1
1
0 D exp A A(T DT DD p)
1E+2 1E+3 1E+4 1E+5 1E+6 1E+7 1E+8
1E-3 1E-2 1E-1 1E+0 1E+1 1E+2 1E+3 1E+4
Vi
sc
osi
ty
(
Pa
.s)
Shear rate (s-1) HSR, 180 °C HSR, 190 °C HSR, 200 °C Catamold 316LG
symbols: mesured values
solid lines: Cross-WLF + Herschel-Bulkley
controlled shear stress rheometer (CSS)
[image:6.595.318.547.248.345.2] [image:6.595.63.293.374.619.2] [image:6.595.319.547.547.698.2]this phenomenon in a simplified way. The feedstock flow transports the separation pattern and changes the pattern continuously.
As Figure 15 shows, the simulation cannot predict the phase separation phenomenon, furthermore the predicted shape of the melt flow front and the filing time are not accurate enough.
Many commercial simulations software for injection molding are considering PIM-feedstock as a bulk material by the complete set of 3D Navier Stokes equations. Considering feedstock as a bulk material means that the model cannot differentiate between powder and binder (one-phase simulation). But in this case a set of 3D Navier Stokes had to be formulated for each phase - one for the powder and one for the binder - and both had to be coupled in an appropriate way. This practical approach based on a diffusive flux model is currently being developed by SIGMASOFT [16].
Based on these results, additional filling studies were carried out at the mold temperatures of 180 °C and 200 °C. The molded parts of the filling study are shown in Figure 18. The higher mold temperature 180 °C resulted in an improved fountain flow; nevertheless it was not fully developed and the wrinkling is still present.
A significant improvement with regard to the development of the melt flow front occurs at the mold wall temperature of 200 °C and the wrinkling was completely eliminated (see Figure 18). Furthermore, at 200 °C a very good agreement was achieved between filling simulation and experiment. The difference between calculated and measured pressures in front of the screw is not more than 7% and in the cavity max. 6 %[12].
Catamold 316LG Melt temperature = 200 °C Tmold=180 °C
filling stage: 82 % filling stage: 75 % Tmold=200 °C
Figure 18. Experimental filling images of the rectangular plate with deflections for Catamold 316LG at mold temperatures of 180 ° C and 200 °C [12]
4. Conclusion and Outlook
In the present paper the results of controlled shear stress and slit die rheology of 316L stainless steel feedstock for powder injection molding and the related analysis of the filling stage of injection molding are shown.
Different powder characteristics of Catamold 316LA and 316LG are also reflected in the flow properties of the two feedstocks. For 316LA whose particle size distribution is bimodal, a change in flow characteristic was observed during the viscosity measurement on the high pressure capillary rheometer with the slit die. Possible cause of this flow behavior can be attributed to the rearrangement of the powder distribution in the melt. The measured viscosity curves on the injection molding machine showed no change in the slope of the flow curve.
The control shear stress measurements (CSS) with the plate-plate rheometer showed that for the feedstocks at low shear rates <1 s-1 no Newtonian plateau is observed, but
instead the viscosity increases strongly. This flow behavior could be described very well with the Cross-WLF model with Herschel-Bulkley extension.
Using the rheological data, flow simulations were performed and it was observed that the simulations do not accurately mimic the flow response of feedstock. This was attributed to the fact that current software do not take into account that feedstock is a multiphase material.
On the base of the comparison of short shots with injection molding simulation the influence of the observed rheological behavior onto mold filling and the related injection molding simulation was shown. At too low mold temperatures at the melt flow front no fountain flow was developed. The absence of a fountain flow can lead to an inhomogeneous microstructure in the molding or poor dispersion of the filler particles.
The mold temperature is especially important during the filling process. Besides the evolution of the fountain flow at higher mold temperatures; the cycle time, the surface finish of the molded part, the mold filling grade and the mold filling rate are affected [12].
The higher the mold temperature, the better the cavity can be filled properly. Furthermore, the flow resistance is reduced. For the feedstocks which show unsteady flow conditions, the application of the variotherm process in the filling phase of the injection molding process is recommended. This means that during filling the cavity the mold wall temperature is raised quickly to the melt temperature.
The next step in our research will be investigation of the influence of surface texture of parallel plates in rotational rheometry to investigate slip effects during viscosity measurements and subsequently comparing the numerically simulated results with experiments.
Acknowledgements
[image:7.595.56.298.443.727.2]Gonzalez-Gutierrez and Prof. Thomas Lucyshyn for their useful technical discussion on this topic. Furthermore, we thank the Polymer Competence Center Leoben, PCCL for providing the rheometer for the rheological measurements.
This work is an extended paper of the presentation in the ic-rmm2, 2nd International Conference on Rheology and
Modelling of Materials in Miskolc-Lillafüred, Hungary, 5-9 October, 2015.
REFERENCES
[1] A. Franck. Understanding rheology of thermoplastic polymer, AAN013, TA Instruments, 2013.
[2] M. Thornagel. Injection moulding simulation: New developments offer rewards for the PIM industry, Powder Injection Moulding International 6, 65-68, 2012.
[3] T. Dapčević, P. Dokić, M. Hadnađev, M. Pojić. Determining the yield stress of food products - importance and shortcomings, Food Processing - Quality and Safety 35, 143-149, 2008.
[4] Sigmasoft V4.8 - new functionality, SIGMA Engineering GmbH, Aachen, 2012.
[5] K. Geiger. Ein neues heuristisches Fließgesetz, 21. Stuttgarter Kunststoffkolloquium, Stuttgart, 2009.
[6] H. M. Laun. Polymer rheology with a slit die, Rheologica Acta, Vol. 22, No. 2, 181–185, 1983.
[7] L. Nyborg, E. Johansson, S. Niederhauser. Assessment of rheology and related properties of PIM feedstock material, proceedings of 2nd European Symposium on Powder Injection Moulding, EPMA, Shrewsbury, 67-74, 2000.
[8] V. V. Bilovol. Mould filling simulations during powder injection moulding, Ph.D. thesis, TU Delft, 2003.
[9] W. Friesenbichler, I. Duretek. Rheologische Charakterisierung hochgefüllter PIM-Feedstocks und Holzcompounds, Tagungshandbuch zum 17. Leobener Kunststoffkolloquium, Leoben, 2003.
[10] I. Duretek, T. Lucyshyn, G. R. Langecker. Powder-Injection-Moulding (PIM) / Stoffdatenbestimmung und Simulation, 52. Jahrestagung der Österreichischen Physikalischen Gesellschaft, Leoben, 2002.
[11] C. Kukla, W. Friesenbichler, I. Duretek, M. Thornagel. New insights into feedstock behaviour and injection moulding simulation for PIM, International Powder Metallurgy Congress and Exhibition – EURO PM 2008, Mannheim, 287-292, 2008.
[12] I. Duretek. Untersuchungen zum Fließverhalten von Metall-, Keramik- und Holz-Kunststoffverbunden, Dissertation, Montauniversitaet Leoben, 2013.
[13] T. Hartwig, C. Kukla, I. Duretek, M. Thornagel, M. Caballero, G. N. Breitenmoser, d’Jeff Van der Ven, J. C Bihr, B. Vicenci, M. Witzleben, C. Gornik, S. Jegust, U. Birth, et.al. New material laws for powder filled injection moulding feedstocks - final report, European Union CRAFT Programme Framework 6, project acronym: MATLAW, project no. 033006, 2009.
[14] R. Eisenschitz, B. Rabinowitsch, K. Weissenberg. Mitteil Deutsch, Materialspruefungsamt, Sonderheft Vol. 9, No. 91, 91–94, 1929.
[15] B. Rabinowitsch. Über die Viskosität und Elastizität von Solen, Zeitschrift für physikalische Chemie 145, 1-26, 1929. [16] M. Thornagel. Simulating flow can help avoid mould
![Figure 2. Flow profile differences for (a) the Cross and (b) the Cross-Herschel-Bulkley model [2]](https://thumb-us.123doks.com/thumbv2/123dok_us/8788152.907996/2.595.58.296.398.503/figure-flow-profile-differences-cross-cross-herschel-bulkley.webp)


![Figure 18. Experimental filling images of the rectangular plate with deflections for Catamold 316LG at mold temperatures of 180 ° C and 200 °C [12]](https://thumb-us.123doks.com/thumbv2/123dok_us/8788152.907996/7.595.56.298.443.727/figure-experimental-filling-images-rectangular-deflections-catamold-temperatures.webp)
