Full Length Research Article
PORTFOLIO CONSTRUCTION USING THE SHARPE INDEX MODEL WITH REFERENCE TO SUGAR
AND METAL SECTOR ON INDIA
1
Dharmalingam, N. and *
2Dr. Balanaga Gurunathan, K.
1
Research Scholar, Bharathiar University, Coimbatore
2
Department of Finance, Alliance School of Business, Alliance University, Bangalore - 562 106
ARTICLE INFO ABSTRACT
The main aim of this research is to construct optimum portfolio through Sharpe index model. The portfolio is constructed to help the investor to reduce the risk. In this study two sector sugar and metal are chosen for constructing the portfolio. Ten companies are selected from each of these sectors and ranked according to single index model. The cut-off points are than calculated and securities are selected for construction of optimal portfolio. Proportion of investment in each security in the portfolio is found out. This analysis will help the investor to invest in security which would yield more return with minimum security.
Copyright©2016, Dharmalingam and Dr. Balanaga Gurunathan.This is an open access article distributed under the Creative Commons Attribution License, which permits unrestricted use, distribution, and reproduction in any medium, provided the original work is properly cited.
INTRODUCTION
The stream which deals with managing various securities and creating an investment objective for individuals is called portfolio management. Portfolio management refers to the art of selecting the best investment plans for an individual concerned which guarantees maximum returns with minimum risks involved. Portfolio theory was proposed by Harry M. Markowitz of University of Chicago. According to Markowitz’s portfolio theory, portfolio managers should carefully select and combine financial products on behalf of their clients for guaranteed maximum returns with minimum risks. Portfolio theory helps portfolio managers to calculate the amount of return as well as risk for any investment portfolio. William Sharpe then came up with a single index model through which portfolio is constructed efficiently. This model is very much easy to find out the optimum portfolio. It is a simple asset pricing model commonly used in the finance industry to measure risk and return of a stock. India has been known as the original home of sugar and sugarcane. Indian mythology supports the above fact as it contains legends showing the origin of sugarcane.
*Corresponding author: Dr. Balanaga Gurunathan, K.
Department of Finance, Alliance School of Business, Alliance University, Bangalore - 562 106
India is the second largest producer of sugarcane next to Brazil. Presently, about 4 million hectares of land is under sugarcane with an average yield of 70 tonnes per hectare. India is the largest single producer of sugar including traditional cane sugar sweeteners, khandsari and Gur equivalent to 26 million tonnes raw value followed by Brazil in the second place at 18.5 million tonnes. Even in respect of white crystal sugar, India has ranked No.1 position in 7 out of last 10 years. India is the world’s second largest populated country, representing about 17.31% of the global population. Aggressive growth in the food and beverage industries will lead to the increasing demand for sugar. High sugar content in confectionaries, including chocolates, pastries and ice-creams, will drive the domestic demand for sugar. Metal industries are the indispensable part of an economy; they form the backbone of industrial development of any country. The steel sector in India is has been growing rapidly. India is the fifth largest producer of crude steel. Export growing at the rate of 20% where as import is double the rate. The key supplier for metal industry is automobile industry, telecom, power, consumer durable, and defence. The custom duty on primary and secondary metals has been reduced from 15 percent to10 percent. The sugar and metal sector are the two sector sector where investment opportunities are larger and safer for an investor which will further grow in future. Both the industry is
ISSN: 2230-9926
International Journal of Development Research
Vol. 06, Issue, 09, pp.9481-9486, September,2016
International Journal of
DEVELOPMENT RESEARCH
Article History: Received 26th June, 2016
Received in revised form 14th July, 2016
Accepted 26th August, 2016
Published online 30th September, 2016
Available online at http://www.journalijdr.com
Key Words:
Risk, Return,
growing in India. The study focuses on construction of optimum portfolio consisting of these sector stocks using single index model.
Need for Study
Construction of portfolio is very important. The portfolio is constructed to diversify the risk. The portfolio construction gives the investor an optimum return from their investment. All the saving if invested in one security the risk is very high and the return from the security is not guaranteed so it is better for the investor to select two or more securities to invest through portfolio construction. This paper is designed to show the return that we get if correlation coefficient is positive and negative. Through Sharpe index model we can construct portfolio for any number of securities. The growth in sugar and metal sector is growing nicely it is better for the investor to select good company for their investment through proper portfolio construction.
Objectives
To observe the performance of nineteen company of both sugar and metal sector
Construction of portfolio for the nineteen company
The find out the company that will give maximum return with minimum risk
To analyze risk and return for these companies and to select stocks to be included in the portfolio
To find out the volatility happening in the market with respect to the above 19 company.
To find out the proportionate money to be invested in each company.
Scope of the Study
The data which are taken to design the portfolio are real data taken from NSE website and the portfolio is constructed on the basis of excess return to beta ratio. The scope of the study is that if the investment is made on maximum return security then the return will be relatively higher.
Limitation
Only nineteen company is selected for constructing the portfolio
Security is selected on the basis of risk and return ration alone
The stock prices considered are last four years data.
The factor like economic, social, political are not consider for constructing portfolio.
Review and Literature
Hiroshi konno (May 1991), Describes about the portfolio optimizing model using mean absolute deviation risk. The difficulties in markowits model are eliminated through the mean absolute deviation method. A large optimization problem consisting of more than 1000 stock=k can also be solved through this paper. Marian Hristache, Anatoli Juditsky, and Vladimir Spokoiny Volume 29, Issue 3 (2001), 593-623, discuses the importance of single index model. Single-index
modeling is widely applied in, for example, econometric studies as a compromise between too restrictive parametric models and flexible but hardly estimable purely nonparametric models. By such modeling the statistical analysis usually focuses on estimating the index coefficients. The average derivative estimator (ADE) of the index vector is based on the fact that the average gradient of a single index function is proportional to the index vector. Unfortunately, a straightforward application of this idea meets the so-called “curse of dimensionality” problem if the dimensionality of the model is larger than 2. Vinnie Jauhari (2012), explains about strategic growth challenges for the Indian hotel industry. As the tourism industry is growing, Indian and global firms face new challenges which need to be addressed.
This study involved obtaining practitioner insights by conducting an industry round table discussion with senior managers who are in leadership positions with international and national hotel brands. This paper has policy implications for both industry practitioners and government bodies setting up governing mechanisms for this industry segment. Gunjan M. Sanjeev, Kanika Gupta, Rumki Bandyopadhyay (2012), they provide a practitioners' perspective on financial challenges prevalent in the Indian hospitality industry. The study involves the collection of primary data through structured interviews. This paper provides some very useful qualitative analysis of the contemporary challenges and their possible solutions prevalent in the Indian hospitality sector. The findings will be useful for hoteliers, policy makers and researchers to deliberate on the issues raised. They highlighted some of the financial challenges faced by the Indian hospitality industry like high financing costs, multiplicity of taxes charged, licensing and legal issues, working capital issues and eroding margins. Myong Jae Lee, SooCheong (Shawn) Jang (2007), investigates the effect of a diversification strategy by hotel companies on corporate financial performance and stability, using 36 publicly traded hotel companies.
Accounting measures, market measure, and risk-adjusted performance measure were employed to gauge financial performance. This study supported the nature of the trade-off between financial performance and stability in the company diversification, and also implied that the market diversification strategy by hotel companies does not function as a means to improve financial performance. Richard B. Spurgin (2001), investigates how to game Sharpe ratio. This article describes a derivative structure that can induce an upward bias in the measurement of the Sharpe ratio. The structure accomplishes this by shifting returns from the highest monthly return each year to the lowest one. The objective of this article is to demonstrate how adding derivatives can appear to improve risk-adjusted return without actually doing so. Michael Stutzer (2000), discuses about portfolio performance index. The probability decay rate is t proposed here as a new portfolio "performance index." In the widely analyzed special case in which returns are normally distributed, the new performance-index-maximizing portfolio is the same as the popular Sharpe-ratio-maximizing portfolio. The results of the two approaches generally differ. B.P.S. Murth, Yoon K. Choi, Preyas Desa (1997), investigates shortcomings of two popular indices of performance Jensen's alpha and the Sharpe index. They
propose a new measure of performance that seeks to address the limitations of the earlier indices. The new index is calculated by employing a well known method in operations research called data envelopment analysis. They compare the results with traditional indices of performance.
MATERIALS AND METHODS
This study is descriptive in nature. Data collected is secondary data. No primary data is used in this study. Source of data is from websites like NSE, RBI and also from other databases. Sampling method is probability sampling. The sampling technique is simple random sampling. Sample population is total companies listed in NSE which is 1646 as of July, 2012. Sample size is 20 companies listed in NSE. Nineteen companies from SUGAR and METAL sector. The study is based on past four year’s data from April 1, 20
2016.
Research Tools
Beta Coefficient
Beta coefficient is the relative measure of non risk.
Where, (Y) is the Standard Deviation of Individual Stock.
(X) is the Standard Deviation of Market.
Return
Return is the total gain or loss on an investment over a period of time.
Efficient portfolio
A portfolio that maximizes return for a given level of risk or minimizes risk for a given level of return is termed as an efficient portfolio.
Correlation
A statistical measure of the relationship between any two series of numbers representing data of any kind is known as correlation.
Risk-free rate of return (RF)
Risk-free rate of return is the required return on a risk free asset, typically a three month treasury bill.
constructing the portfolio using the Sharpe Method are as follows. (All calculations are done using MS Excel
Find the excess return to β ratio
9483 International Journal of Development Research,
propose a new measure of performance that seeks to address the limitations of the earlier indices. The new index is calculated by employing a well known method in operations alled data envelopment analysis. They compare the results with traditional indices of performance.
This study is descriptive in nature. Data collected is secondary data. No primary data is used in this study. Source of data is from websites like NSE, RBI and also from other databases. Sampling method is probability sampling. The sampling mple random sampling. Sample population is total companies listed in NSE which is 1646 as of July, 2012. Sample size is 20 companies listed in NSE. Nineteen companies from SUGAR and METAL sector. The study is based on past four year’s data from April 1, 2012 to March 31,
Beta coefficient is the relative measure of non-diversifiable
(Y) is the Standard Deviation of Individual Stock.
total gain or loss on an investment over a period
A portfolio that maximizes return for a given level of risk or minimizes risk for a given level of return is termed as an
measure of the relationship between any two series of numbers representing data of any kind is known as
free rate of return is the required return on a risk free bill. The steps in constructing the portfolio using the Sharpe Method are as
MS Excel).
Where,
Ri is the expected return on stock Rf is the return on a riskless asset
i is the expected change in the rate of return on stock associated with one unit change in the market return.
Arrange the calculated excess return to β ratios in the descending order.
Find the cut-off point using the formula below
Decide how much to be invested in each security
Where, Xi is the proportion of investment of each stock, and
Where, C* is the cut-off point.
DISCUSSION
First standard deviation, return, variance is calculated for all nineteen company. Then the correlation is calculated. The return indicator denotes that PONNI Sugar Company has greater return than the other company followed by other companies. None of the company has beta greater than the value of one which shows that i
security for yielding good return the Sharpe index model is used. The excess return to beta is first calculated and then based on the ratio the company is ranked as shown in Figure 2. The value of Rf is assumed as 8.12%.
[image:3.595.310.556.569.770.2]find that the RENUKA SUGAR Company is in first followed by rest of the company and HINDALCO stands last.
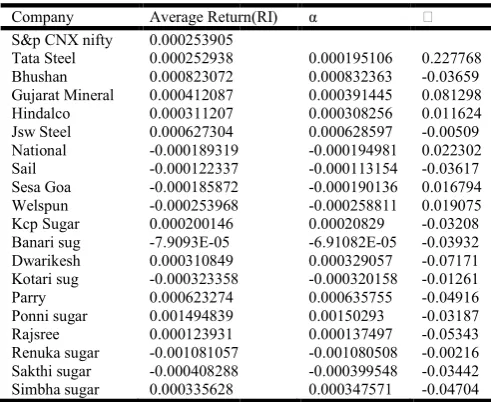
Table 1. Return, Standard deviation and Beta of each stock
Company Average Return(RI) S&p CNX nifty 0.000253905 Tata Steel 0.000252938 Bhushan 0.000823072 Gujarat Mineral 0.000412087 Hindalco 0.000311207 Jsw Steel 0.000627304 National -0.000189319 Sail -0.000122337 Sesa Goa -0.000185872 Welspun -0.000253968 Kcp Sugar 0.000200146 Banari sug -7.9093E-05 Dwarikesh 0.000310849 Kotari sug -0.000323358 Parry 0.000623274 Ponni sugar 0.001494839 Rajsree 0.000123931 Renuka sugar -0.001081057 Sakthi sugar -0.000408288 Simbha sugar 0.000335628
International Journal of Development Research, Vol. 06, Issue, 09, 9481-9486, September, 2016
Ri is the expected return on stock Rf is the return on a riskless asset
i is the expected change in the rate of return on stock associated with one unit change in the market return.
Arrange the calculated excess return to β ratios in the
the formula below
to be invested in each security
Where, Xi is the proportion of investment of each stock, and
First standard deviation, return, variance is calculated for all nineteen company. Then the correlation is calculated. The return indicator denotes that PONNI Sugar Company has greater return than the other company followed by other companies. None of the company has beta greater than the value of one which shows that it is more risky. To find out the security for yielding good return the Sharpe index model is used. The excess return to beta is first calculated and then based on the ratio the company is ranked as shown in Figure 2. The value of Rf is assumed as 8.12%. From Figure 2 we could find that the RENUKA SUGAR Company is in first followed by rest of the company and HINDALCO stands last.
Return, Standard deviation and Beta of each stock
Average Return(RI) α
0.000195106 0.227768 0.000832363 -0.03659 0.000391445 0.081298 0.000308256 0.011624 0.000628597 -0.00509 -0.000194981 0.022302 -0.000113154 -0.03617 -0.000190136 0.016794 -0.000258811 0.019075 0.00020829 -0.03208 -6.91082E-05 -0.03932 0.000329057 -0.07171 -0.000320158 -0.01261 0.000635755 -0.04916 0.00150293 -0.03187 0.000137497 -0.05343 -0.001080508 -0.00216 -0.000399548 -0.03442 0.000347571 -0.04704
Cut-off point
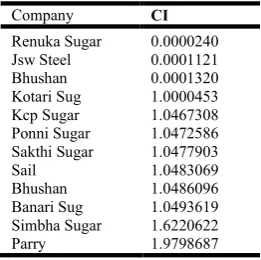
The selection of securities depends upon the cut-off point. The stock with maximum cut-off point is chosen. The stocks above this value have high excess return to beta ratio and stocks below this value have less excess return to beta ratio. The stocks with high excess return to beta ratio are included in constructing portfolio. Cut-off point increases up to certain value then it starts reducing. The point when it reaches maximum is chosen as cut-off ratio (Fisher & Jordan). Here we can see the cutoff point is 1.979868664 (From Figure 3) and the corresponding company is PARRY sugar limited. The company above PARRY is selected for construction of portfolio.
Optimal Portfolio
Based on the cut-off rate stocks should be selected for construction of optimal portfolio. Optimal portfolio consists of stocks with high return. Here 12 stocks are included in the portfolio. After constructing portfolio then how much should be invested in each stock is to be estimated. These top companies are shown in Table 4. Portfolio investment is
calculated by using Zi and Xi-proportion of money to be invested in each stock. Proportion of investment is shown in Table 5. It indicates weights on each security. Thus with help of Sharpe index model optimal portfolio is constructed and proportion of investment in each stock is found. Here in the portfolio the companies are from both AUGAR and Metal sector. The maximum investment should be made to Kotari Sugars Private Limited at 32% and followed by JSW STEEL and Renuka Sugar. It is shown in the Table 5. This shows companies in the SUGAR sector are growing at steady rate when compared to companies in the metal sector. These metal sectors have future scope of investment as scenario in that industry is rapidly changing. Proportion of investment is shown in the Figure 6.
FINDINGS
[image:4.595.202.396.242.442.2]The performance of companies from both sectors like SUGAR and METALS are calculated. Based on this it is found that many companies in SUGAR sector offer high returns. Here portfolio is made up of companies in SUGAR sector because of its good performance.
Table 2. Excess Return to Beta Ratio
Company (Ri-Rf)/Β New Ranking S&P Cnx Nifty
[image:4.595.105.494.467.670.2]Tata Steel -0.355393154 Renuka Sugar Bhushan 2.196450008 Jsw Steel Gujarat Mineral -0.993722882 Bhushan Hindalco -6.959049437 Kotari Sug Jsw Steel 15.82272863 Kcp Sugar National -3.64939363 Ponni Sugar Sail 2.248362377 Sakthi Sugar Sesa Goa -4.846142324 Sail Welspun -4.270294578 Bhushan Kcp Sugar 2.525161919 Banari Sug Banari Sug 2.066860846 Simbha Sugar Dwarikesh 1.127961202 Parry Kotari Sug 6.466861604 Rajsree Parry 1.639139641 Tata Steel Ponni Sugar 2.501244045 Gujarat Mineral Rajsree 1.517434756 National Renuka Sugar 38.11410699 Welspun Sakthi Sugar 2.370783468 Sesa Goa Simbha Sugar 1.719203387 Hindalco Table 3. Cut-Off point for 20 companies
New Ranking (Ri-Rf)*β (RiRf)*β)/ σ^2ei
σ^2m*(∑(Ri-Rf)*β)/σ^2ei)
β^2/ σ^2ei
1+(σ^2m* ∑ β^2/σ^2ei)
Ci
Renuka Sugar 0.0001 0.0700 2.40098E-05 0.0018 1.00000063 0.000024010 Jsw Steel 0.0004 0.2568 0.000112089 0.0162 1.000006201 0.000112088 Bhushan -0.0065 -3.7787 -0.001183937 0.7704 1.000270445 0.00013204 Kotari Sug 0.0010 1.1098 -0.000803292 0.1716 1.000329306 1.00004532 Kcp Sugar 2.5251 3.056 1.047522591 1.245 1.000756473 1.046730768 Ponni Sugar 0.0025 2.649 1.048431307 1.0594 1.001119778 1.04725861 Sakthi Sugar 0.0028 2.7810 1.049385127 1.1730 1.001522101 1.047790285 Sail 0.0029 2.8266 1.05035459 1.2573 1.001953345 1.048306885 Bhushan 0.0029 1.6922 1.05093499 0.7704 1.00221759 1.048609605 Banari Sug 0.0031 4.4654 1.052466511 2.1604 1.002958578 1.049361892 Simbha Sugar 1.7192 1.678.2 1.628062723 2.1596 1.003699293 1.62206224 Parry 1.6391 1.050 1.988244083 1.5482 1.00423029 1.979868664 Rajsree 0.0043 3.729 1.989523058 2.4574 1.005073143 1.979480868 Tata Steel -0.0184 -15.530 1.984196654 0.7704 1.005337388 1.973662451 Gujarat Mineral -0.006 -4.339 1.982708261 0.2307 1.005416543 1.972026693 National -0.0018 -0.8422 1.982419394 0.2314 1.00549591 1.971583747 Welspun -0.0015 -0.9881 1.982080473 0.23140 1.005575277 1.971091094 Sesa Goa -0.0013 -0.6715 1.981850149 0.1385 1.005622805 1.9707689 Hindalco -0.0009 -0.81866 1.981569369 0.1176 1.005663152 1.970410634
Table 4. Selection of Securities
Company CI
Renuka Sugar 0.0000240 Jsw Steel 0.0001121 Bhushan 0.0001320 Kotari Sug 1.0000453 Kcp Sugar 1.0467308 Ponni Sugar 1.0472586 Sakthi Sugar 1.0477903
Sail 1.0483069
Bhushan 1.0486096 Banari Sug 1.0493619 Simbha Sugar 1.6220622
Parry 1.9798687
Table 5. Proportion of investment in each security Company Percentage
[image:5.595.40.285.373.503.2]Renuka sugar 16.32322647 Jsw steel 23.44341156 Bhushan 2.421117666 Kotari sug 32.43334936 Kcp sugar 11.24166811 Ponni sugar 9.202177205 Sakthi sugar 7.073146962 Sail 4.955786628 Bhushan 2.421117666 Banari sug 2.537597737 Proportion of Investment
Figure 6. Proportion of investment in pie chart
While companies in STEEL sector have low return except few companies like JSW, BHUSHAN, SAIL. These METAL company are performing better when compared to even other good metal companies like Gujarat minerals, hindalco etc. Among SUGAR companies Rajsree ltd has low excess return to beta ratio and its performance is low when compared to other companies in sugar sector companies in the Hotels sector. All the stocks have beta value less than one than is less than market beta. Based on the alpha values it is found that 20% of companies have no assured return for risk because of negative alpha value. In that most of the companies are from metal sector. The KOTARI sugar company has high return when compared to all the other companies. So it is better to invest 29% of money for investment in KOTARI sugar limited.
Implications for the Practitioners
Based on the calculations it is recommended that proportion of investment should be more in KOTARI sugar limited at 29%.
It offers maximum return with minimum risk among the selected companies. Investor should give first priority to invest in this company. In order to diversify the portfolio investor can invest in other companies such as SAIL, BHUSHAN, KCP SUGAR, and PONNI SUGAR. This diversification will help the investor to reduce the risk..The current situation for this sector is not steady but investors can invest in this sector in future as few companies are in rapidly growing stage. Further investors have to be cautious while investing in other companies in the metal as well as sugar company.
Conclusion
Nineteen companies selected from two sectors resulted in portfolio consisting of eleven companies from both SUGAR and METAL sector. Only those eleven companies meet the criteria according to Sharpe index model. Portfolio has mix of companies from SUGAR and METAL sector. Investing in share market involves many factors and it is challenging depending upon various situations. Investors have to earn maximum return with reduced risk. Their investment criteria depend upon their capability and different forces in the share market. This portfolio construction will be helpful for the investors to take good investment decisions. It also support to make high return investment in the future in companies from metal sector based on the current changing trends in the market. There is no restriction to invest in only companies from one sector; they can diversify their venture in other sectors also to earn high returns.
Scope for further study
The study analyses securities in sugar and metal sectors only. Further research can be done involving all sectors which would be a more optimal portfolio rather than from specific sectors.
Sharpe Index model has its own limitations so in order to constract an optimal portfolio sharpe index model alone is not sufficient. Portfolio construction can be done with consideration of other models
REFERENCE
Erhan Bayraktar,Virginia Young, 2008. “Pricing options in incomplete equity markets via the instantaneous Sharpe ratio”, Annals of Finance, Volume 4, Number 4 399-429. Gunjan, M., Sanjeev, Kanika Gupta, Rumki Bandyopadhyay,
2012. "Financial challenges in the Indian hospitality industry", Worldwide Hospitality and Tourism Themes, Vol. 4 Iss: 2, pp.163 – 173
Hyunjoon Kim, Zheng Gu, 2003. “Risk-Adjusted Performance: A Sector Analysis of Restaurant Firms”,
Journal of Hospitality & Tourism, Vol. no.27 issue 2.
200-216
India - Road Ahead”, Opinion: International Journal of
Management, Opinion Vol. 2, No. 1, ISSN: 2231-5470
(Print), 32-36
Juan Franco-Laverde, Andrew Littlewood, Craig Ellis, Ingrid Schraner and Maria-Estela Varua, 2012. “FMCG Portfolio Budget Allocation to Price Promotions Using Modern Portfolio Theory (MPT)”, International Review of Business
Kei Keung Hung, Chi Chiu Cheung, Lei Xu
,
2000. “New Sharpe-ratio-related methods for portfolio selection”, Computational Intelligence for Financial Engineering, 2000. (CIFEr) Proceedings of the IEEE/IAFE/INFORMS 2000 Conference, Page(s): 34 – 37Michael Stutzer, 2000. “A Portfolio Performance Index”,
Financial Analysts Journal Vol. 56, No. 3 pp. 52-61
Murth B.P.S., Yoon K. Choi, Preyas Desa, 1997. “Efficiency of mutual funds and portfolio performance measurement: A non-parametric approach”, European Journal of Operational Research, Volume 98, Issue 2 Pages 408–418 Myong Jae Lee, SooCheong (Shawn) Jang, 2007. “Market
diversification and financial performance and stability: A study of hotel companies”, International Journal of
Hospitality Management, Volume 26, Issue 2 Pages 362–
375
Nateson, C., Parvathi, S., Suganya, D. 2012. “The Volatility of Sectoral Indices with Special Reference to National Stock Exchange in India”, European Journal of Scientific
Research, ISSN 1450-216X Vol.73 No.3, pp. 398-405
Oliver Ledoit, Michael Wolf, 2008. “Robust performance hypothesis testing with the Sharpe ratio”, Journal of
Empirical Finance, 15 850-859
Peter Woehrmann, Willi Semmler and Martin Lettau, 2005. “Nonparametric Estimation of the Time-varying Sharpe Ratio in Dynamic Asset Pricing Models”, Institute for Empirical Research in Economics, Working Paper Series ISSN 1424-0459, Working Paper No. 225.
Philippe Jorion, 1985. “International Portfolio Diversification with Estimation Risk”, The Journal of Business, Vol. 58, No. 3 pp. 259-278
Preety Wadhwa, Lokinder Kumar Tyagi, 2012. “A Study on Organized FMCG Retailing in
Richard B. Spurgin, 2001. “How to Game Your Sharpe Ratio”,
The Journal of Alternative Investments, Vol. 4, No. 3: pp.
38-46
Vinnie Jauhari, 2012. "Strategic growth challenges for the Indian hotel industry", Worldwide Hospitality and Tourism Themes, Vol. 4 Iss: 2, pp.118 - 130