5795
EVALUATION OF THE IT OUTSOURCING PERFORMANCE
IN THE DEVELOPMENT OF BIGDATA SYSTEMS
1*ELENA N. FOKINA, 2FEDOR YA. LEGOTIN, 3VERONIKA YU. CHERNOVA
1Chair of Business Informatics and Mathematics, Tyumen Industrial University, Russian Federation 2Chair of Corporate Economics, Ural State University of Economics, Russian Federation
3Chair of Marketing, Peoples’ Friendship University of Russia, Russian Federation E-mail: * [email protected]
ABSTRACT
The article considers the issue of outsourcing development in the field of information technologies. The work is devoted to the construction of a model that allows optimizing the organizational structure of the BigData information network and carrying out a comparative analysis of the effectiveness of its implementation in the format of IT outsourcing. In the process of research, the theoretical bases of outsourcing are analyzed and factors influencing the choice of the system implementation variant are generalized. In the critical review, a hypothetical assumption is made that the degree of IT outsourcing implementation effectiveness is inversely related to the degree of change in the characteristics of uncertainty, the frequency of queries and specificity. The study made it possible to characterize a set of indicators for evaluating the efficiency of outsourcing the BigData information system. The development model can be used to optimize the server complex of the network in order to reduce the number of cluster computing capacities involved during variable load. The criteria of the expediency of outsourcing application in practical activity of the companies are determined.
Keywords: Bigdata, IT Outsourcing, Information Uncertainty, Information Network Development
1. INTRODUCTION
In the ever increasing complexity of industrial complexes, there is a need to develop information systems, the internal processes of which are aimed at real-time processing and analyzing of large amounts of data [1]. Increasing the speed of making managerial decisions requires an operative response to changing external factors, which leads to stricter requirements for the accuracy and frequency of updating incoming information [2]. All this allows talking about the formation of BigData universal technological concept.
In most cases, BigData consists of unstructured data that not only differs in volumes, but also requires special approaches to storage and processing. The above factors, together with the fragmentation and low structuredness of the incoming data, lead to an almost exponential growth of environmental and decision-making uncertainty [3-4]. One way to level out the impact of the emerging uncertainty is to find tools for the effective use of computing power with the reduction of the time spent on solving information processing problems.
The problem of the lack of computing resources is observed in many areas and can exist
due to various reasons. In any case, the focus of attention is directed to the development of the optimal organizational structure of the BigData information system (designing) with the choice of one of two acceptable options for deployment – the implementation of the cluster on its own or transferring it to IT outsourcing. That is why the main goal of the research was the development of a methodical tool for comparative cost evaluation in the design and optimization of such systems through IT outsourcing of data processing services.
2. LITERATURE REVIEW
2.1. Provisions on IT Outsourcing
ISSN: 1992-8645 www.jatit.org E-ISSN: 1817-3195
5796 information network. When choosing an option for implementing IT outsourcing, various factors [5] are usually taken into account, including economic efficiency, requirements for the IT resources used, and the need to attract qualified specialists,
Different outsourcing-based development directions of enterprises found wide coverage in publications. At the same time, the theory of outsourcing and the practice of its application need further study. Many researchers of IT outsourcing used in their work the methodology of transaction costs as a basic theoretical basis [6-8]. This is explained by the theory that transaction costs comes from the limited rationality of the subjects. The main unit of analysis in this case is a transaction with uncertainty, frequency and specificity of assets. It becomes possible to further formulate a working hypothesis, which is that the degree of use of IT outsourcing is inversely related to the degree of change of these characteristics. And if the decision on IT outsourcing is based on this provision, then such a decision should be effective.
2.2. The Role Of Big Data In The Implementation Of Business Processes
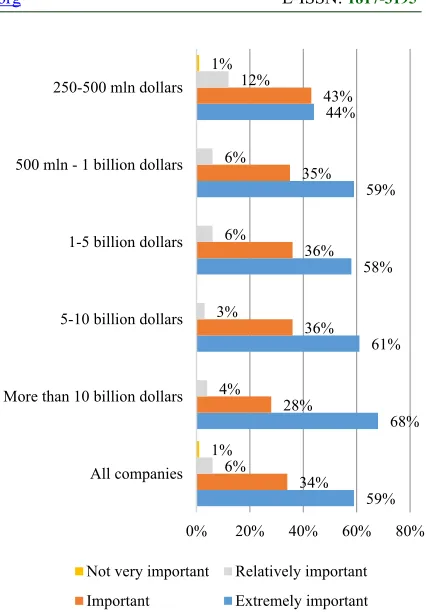
[image:2.612.313.526.79.385.2]Big Data is one of the fastest growing areas of information technology. According to statistics, the total amount of data received and stored doubles every 1.2 years [29]. According to the IDC Digital Universe research, the amount of data on the planet will reach 40 zettabytes in the next five years, which means that every person living on Earth will have 5200 GB each by 2020. According to the survey results [30, 31], big data represent a significant value for users who have implemented at least one cluster type information project. The overwhelming majority (92%) of users note that they are satisfied with the business results. In addition, 94% said that active usage of big data completely satisfies their needs. Large companies are more likely to feel the extremely high importance of big data for the implementation of their digital strategy (see Figure 1).
Figure 1: The Importance Of Big Data In Business Processes Depending On The Size Of The Company
Companies realize the importance of big Data for a wide range of strategic corporate purposes, from searching for sources of investment and entering new markets, to improving the quality of customer service and the efficiency of the enterprise as a whole. According to the study, the public sector and suppliers of energy and material resources show high interest in BigData, whereas it turns out that companies from banking and insurance sectors with huge databases have little idea of the necessity of some global changes in data processing. However, this can be explained by the fact that the banking sector has its established system of customer relations that has been functioning for many years and the managers simply do not see the need to change something in it. However, this does not mean that there will not be a need to analyze big data in the near future as this can happen a little later.
Many companies are just starting their first big data implementation projects and face serious problems:
1. Keeping large volumes of information requires special conditions, which is a matter of space and possibilities. Speed is associated not only with the possible deceleration and "slowdown"
59% 68% 61% 58%
59% 44%
34% 28%
36% 36% 35%
43%
6% 4% 3% 6% 6%
12%
1% 1%
0% 20% 40% 60% 80% All companies
More than 10 billion dollars 5-10 billion dollars 1-5 billion dollars 500 mln - 1 billion dollars 250-500 mln dollars
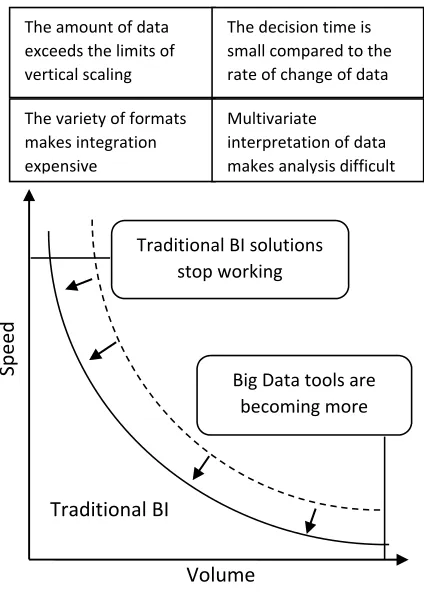
5797 caused by old methods of processing, it is also a matter of interactivity: the faster the process, the greater the return, the more productive the result. Each company has its own Big Data boundary. That is a technological barrier of some sort, showing that usage of traditional universal databases becomes inefficient beyond it. Inefficiency is revealed in the fact that analytical queries are executed by hours, sometimes even days, because the data set is too large to be processed by available means. In real life, this boundary can range from several terabytes to several tens of terabytes or higher. However, not only the volume, but also the reproduction speed and lifetime of data are important (see Figure 2).
Figure 2: The Boundaries Of Traditional BI- And Big Data Technologies Implementation
2. The problem of heterogeneity and unstructuredness arises because of the disparity of sources, formats and quality. In order to combine data and effectively process it, not only the operations to achieve workable form, but also certain analytical tools (information systems) are required.
3. There is the data "size" limit problem. It is difficult to establish, and it is difficult to predict which technologies and how much financial investments will be required for further development.
4. One more trigger point becomes obvious: there is a shortage of professionals who could be entrusted with in-depth analysis, creating reports to solve business problems and, as a result, extracting profits (return on investment) from Big Data.
These are the most obvious problems, presenting significant obstacle for the development of the industry.
Many companies consider information sources and the ways they are used differently (see Figure 3). Sources of big data are usually poorly structured and new types of data are constantly added.
Figure 3: Sources Of Big Data
Speaking about tools in Big Data approaches, it should be noted that the need to process qualitatively new volumes of structured and unstructured data has shown that traditional approaches to their storage and processing have become ineffective, and, therefore, new technologies are required. Given the scope of the tasks, the business faced not only the task of selecting an adequate tool for analyzing information, but also the task of building an optimal computing infrastructure that would be efficient and not very expensive. All this leads to a more complete definition of Big Data.
2.3. Provisions for BigData
In the global economy, data become an important decision-making asset in various operations [9]. As the review has shown, many researchers see large data both as a significant threat to competition and as potential for business
65% 60% 50% 48% 43% 38% 37% 34%
0% 20% 40% 60%
Large data files (20TB +) Enhanced analytics or
research Data obtained with the help of visualization tools
Social networks data Unstructured data Location information Social networks / monitoring / mapping
Telematics The amount of data
exceeds the limits of vertical scaling
The decision time is small compared to the rate of change of data
The variety of formats makes integration expensive
Multivariate
interpretation of data makes analysis difficult
Sp
eed
Volume Traditional BI solutions
stop working
Big Data tools are becoming more
[image:3.612.86.298.259.556.2]ISSN: 1992-8645 www.jatit.org E-ISSN: 1817-3195
5798 development [10-11]. Big data significantly change the approach to doing business at the operational level [12]. The idea of the innovative power of big data is not limited to technology companies; Sankaran K. and Ahmed M. see them as a new tool to improve competitiveness, regardless of industry and geography [13].
The cumulative effect of big data methods and technologies implementation by companies leads to transformational changes [14-16]. Big data increase the productivity of companies and improve the functioning of the public sector [17]. Researchers note that the active use of big data completely satisfies the commercial needs for strategic planning. Walker R. shows that working with big data inevitably leads the company into the field of innovation [18].
Despite the fact that such projects still involve a number of difficulties, it seems that the involvement of large companies is growing: a deeper understanding of the scale and points of big data value creation [19]; focusing on practical application and business results [20]; more serious intentions at the budget and specialists involvement levels [21]; clear understanding of the big data importance [22]. Big data is very useful for attracting new knowledge in modern business [23]. Hu F. assumes that the process of implementing big data will be simple until faced with the problems that begin with security and budget issues and end with relevant specialists or the lack of such in long-term customer service and the creation of internal support, as well as achieving the desired results [24]. The information security management system for outsourcing BigData systems should ensure the reliability of the functioning of information systems [25]. It is generally accepted that technologies for supporting distributed computing environments, including big data, were developed without taking the strict requirements for ensuring information security for them into account. Therefore, this issue is particularly relevant, but still is far from full resolution.
Obviously, over time the companies are increasingly moving to new technologies that extract more heterogeneous data into account than ever before. As a result, they receive a much more complex environment: architectures and analysis systems are constantly in operation mode; big data sets are continuously collected; big data create “more noise” around important signals.
When solving such time-consuming from the computational point of view tasks by classical methods, the computation time can reach critical values [26]. New methods and approaches for
finding the necessary data assume that it takes a long time to obtain analytical conclusions. Applying flexible approaches allows achieving a faster result. We will carry out a comparative analysis of the cost structure when designing BigData information systems taking such performance parameters as data volumes and queries for their processing. The first step is the methodological justification for the creation of a data center project. We will consider the design model in more detail.
3. METHODS
3.1. Designing A Cluster Network
To choose the BigData systems IT outsourcing option, we propose to use a fuzzy product model that takes the influence of the enterprise informatization level on the technological and operational process, based on theoretical calculations of Tutova N.V. [27] and Vorobyov A.I. [28]. The level of functioning of each element is estimated as a function of the level of its expenditures. As dependent variables in the model, we take the volume of production, and the total effect of IT outsourcing is calculated as the difference between the cost of own deployment of the system and the costs of transferring functions to outsourcing (cost savings). The proposed approach takes into account the transaction costs of IT outsourcing, which are associated with uncertainty, limited rationality and opportunism.
The theoretical solution of the information system designing (optimizing) problem is based on the reviewing of promising models that justify the expediency and cost-effectiveness of IT outsourcing of BigData systems. It is worth mentioning that service with processor sharing has become the main method of information network Web sites functioning, in fact replacing a classic model with a service in order of receipt. General resources of EPS systems are used by users whose queries are executed simultaneously. Considering the server complex of the BigData systems data center, which has a complex architecture with each link being a cluster of servers, it becomes possible to use this particular model for research purposes.
5799 through all the links of the system. Knowing the probabilities of request transitions between the nodes, you can determine the intensity of the request for each λi link and the average response time for the request is the time elapsed from the time the query was received by the system until it left the system, that is, the total time of the query passing through all links of the system:
1 n
i i
i i i
av
t t
N
(1)where ti is the processing time of the query by one cluster server i; ρi is the nominal load of the cluster; Ni is the number of servers in the i cluster.
In the server complex model, taking into account query classes for simulation of the calculation process, a virtual server with an infinite number of parallel independent service channels is introduced, which characterizes the problem solving time for the user. This allows reflecting the independence of time for thinking from the time of processing the query in the model.
Also, let k = 1,...K of query classes, G of different types of sessions, and g = 1,...,G of resources.
Each session type corresponds to one resource. Just as in the server complex model without query classes, suppose that user sessions of type g enter the system with the intensity lg and begin with a query of class k, where g = 1, ..., G. After executing the class k query, users with the g session type spend the random time tg on thinking. After that, they either return to the system with a query of class k 'with p`kk` probability, or exit the system, completing the session, with `
` 1 1 K g
kk k
p
probability.Suppose that the matrix of
`
g g
kk
K K P p dimension is the matrix of the probabilities of user transitions over the resources of the data center. This matrix determines the sequence of queries to the queuing network within the g user session and reflects the relationship between the queries of k and k' class from that user.
Let ʌgk denote the intensity of the arrival of class k queries from the g session, which is equal to:
` ` ` 1
Λg KΛg g , 1, k k k k g
k
p l g G
(2)The total intensity of class k queries for all queries will be:
1 Λ G
k g
k g
(3)Queries of k multi-factor system for a single visit can be different clusters. Probabilities can be identified into cells of clusters. The response time to the k – tavk class query is the time elapsed from the moment the query was received by the system until the moment it exits the system and represents the total time for the query to pass through all links
1
k k n
k i i
av k
i i i
t t
N
(4)where n is the number of clusters of the server complex; i – the number of servers in cluster;
i – nominal load of the cluster i;t
ik– the average response time for a k class query by the cluster server.The obtained calculations are the basis for setting the optimization tasks of the server complex of the data center information network. When optimizing the server complex of the data center, restrictions are imposed on the values of quality indicators.
3.2. Estimating The Cost Of Creating A Cluster Network
To date, one of the most well-known methods of cost accounting in the IT industry is the method based on the total cost of ownership by determining the costs of information systems and computing systems, which are calculated at all stages of their project life cycle taking the influencing uncertainty into account. The application of the theory of cycles in the process of outsourcing is very important for understanding market conditions and extrapolating forecasting trends in the future. Part of the likely losses in case of bankruptcy of the outsourcer can be connected with the choice of an unfavorable moment for making a decision on the implementation of the project, the question lies largely in the field of studying the survival of the company. One of the options for calculating costs is based on their division into capital and operational ones:
TCO
S CapEX OpEX T (5)
ISSN: 1992-8645 www.jatit.org E-ISSN: 1817-3195
5800 Considering the foregoing, the main optimization criteria are the maximum performance of processing requests and the minimum operational costs for the data center server complex.
Thus, for quality requirements without dividing the queries by classes, where a limit is set for the average response time, the statement of the problem looks like this:
1 1 n i i N i i n i i N i N max C Nt
min OpEx N OpEx N
(6)under the following restrictions
1 n
opt i i
i i i
max
i i i
t t N N N
(7)where n is the number of clusters in the data center; Ni – the number of servers in the cluster; C – the criteria of data center performance; OpEx – operational costs of the data center server complex; OpExi – operational costs per the cluster server i; λ – the intensity of the queries to the system; λi – the intensity of queries to the i cluster; ρi – nominal load of the i cluster with one server at λi load; Nimax – the maximum number of servers in the i cluster; ti – the average query processing time by the weakly loaded i cluster server; topt is the optimal average response time.
For quality requirements with separation of requests into classes with a restriction on the average response time:
1 1 1 1 n i i N i n i N K j i i jmin OpEx N OpEx N
N max C N
t K
(8)under the following restrictions
1
, 1, j j
n
j i i
j
i i i
max
i i i
t
T j K
N N N
(9)where n is the number of clusters in the data center; Ni – the number of servers in the cluster; C – the criteria of data center performance; OpEx –
operational costs of the data center server complex; OpExi – operational costs per the cluster server i;
j – the intensity of the receipt of class j requests into the system;
ij – the intensity of the receipt of class j requests in the cluster i; Nimax – the maximum possible number of servers in the cluster i;t
ij – average processing time of the j query by a weakly loaded cluster server;T
j– restriction on the average response time for a query of j class; Nimax – the maximum possible number of servers in the i cluster. The procedure for designing the data center server complex of the information network not taking query classes into account consists of a number of steps: 1) the average time for processing the query by the server in each cluster at low load values is determined; 2) the intensity of the queries to each cluster of servers λi is determined; 3) the maximum allowed average response time for a query is determined; 4) the weighting coefficients of performance criteria and operational costs
1, 2
are set, after which a system is formed using formulas of the proposed method.
From the above list of IT outsourcing areas of application, we will list the components by which we will further evaluate the effectiveness of IT outsourcing: costs, risks and benefits.
Own IT system maintenance cost is provided by the following:
IS BES R R MS
NET DSW E RS
PR AD TR
C t C t C t P t C t
C t C t C t A t C t
S t C t C t
(10)
where CBES
t is the cost of purchasing hardware and software; CNET
t – expenses for the development and creation of computer networks;
RC t – IT system hardware repair expenses; P tR
– repair necessity occurrence probability; CMS
t – expenses for material and technical support;
DSWC t – own software development cost; C tE
– IT system operation resources cost; A t
– depreciation; CRS
t – costs of programs updates;
PR5801 We define the fuzziness of variables in the formula by default.
Costs for IT outsourcing are set by the function:
ITO CT MI OS
C t C t C t C t (11)
where CCT
t – the transaction costs of choosing an outsourcer and executing the contract; CMI
t – the cost of monitoring the provision of services by the outsourcer; COS
t – cost of outsourcer services; t – the time point at which IT outsourcing costs are recorded.The theory of sensitivity is usually used to assess risks in economic and mathematical models. Possible losses will be calculated by the formula:
QO B S
O QP
WO t W t W t W t
W t W t
(12)
where WQO
t – losses from substandard outsourcer services; W tB
– losses from the bankruptcy of the outsourcer; W tS
– loss from violation of information security by the outsourcer; W tO
– losses from the outsourcer’s opportunism; WQP
t– losses from the decline in the skills of own workers; t – the time point at which losses are recorded.
Annual maintenance costs per/one server
-1
PC
С
:
1
WKPR
PR L H PR R E E
WK PC
PC SR
N
S C C C C C A N
C
N N
(13)
Annual maintenance costs for one program -
C
1SW:
1
WKPS WKPA
PS L H PR RS TS SW
WK SW
SW
N N
S C C C C C A
N C
N
(14)
where SPR – the cost of personnel (engineers and technicians); SPS – staff costs (programmers); (CL + CH + CPR) – other personnel costs (training, recruiting, health insurance); CR – spare parts costs; CE – the cost of electricity; AE – depreciation; NWKPR – personnel (engineers and technicians); NWK – total number of project employees; NPS – computers; NSR – servers; CRS – the cost of updating programs; CTS
– the cost of setting up programs; ASW – software depreciation; NWKPS – total programmers; NWKPA – total system administrators; NSW – number of programs.
Thus, if you transfer part of the information service functions to IT outsourcing, then the corresponding terms should be attributed to savings. The cost of IT outsourcing services, combined with the amount of possible losses, determines the total outsourcing costs.
4. RESULTS AND DISCUSSION
Consider a typical project of the BigData information system to be implemented in Russia. The initial data for carrying out the simulation are presented in Tables 1 and 2. We calculate the unit costs for the operation of the IT system elements.
Table 1: BigData information system standard project indicators
Indicator Symbol Unit Value
Quantity of personal computers
NPC pcs 60
Quantity of servers NSR pcs 6
Quantity of programs NPR pcs 197
Quantity of IT service employees
NWK people 18
The cost of the BigData information system is calculated on the basis of the current costs of the data center, which can be attributed to the operating costs of the current period. Operating costs can be calculated as direct costs.
Table 2: Expenses for the BigData information system, year/thousand rubles
Costs Symbol Value
Hardware costs: 1020.20
Spare parts CR 130.50
Depreciation AE 360.40
Operation resources CE 520.30
Software costsЖ: 700.65
Updating CRS 350.60
Adjustment CTS 190.20
Depreciation ASW 150.85
Employees cost SPR 1226.60
Administrative and
commercial expenses CAD 560.30
Other transaction costs CTR 240.60
Total CIS 3748.35
ISSN: 1992-8645 www.jatit.org E-ISSN: 1817-3195
[image:8.612.311.519.118.340.2]5802 and software. In general, according to the data of Table 1 and 2, and the provided above calculations of unit costs for the operation of new equipment and software, approximately 3748.35 thousand rubles per year are required. Thus, for 5 years of project implementation it will take up to 19 million rubles.
[image:8.612.89.293.224.543.2]Consider the option of transferring some of the IT functions to IT outsourcing.
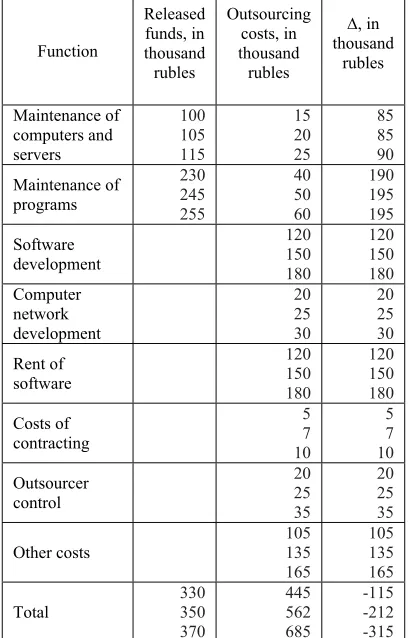
Table 3: Evaluation of released funds and possible outsourcing costs of BigData information system
Function Released funds, in thousand rubles Outsourcing costs, in thousand rubles ∆, in thousand rubles Maintenance of computers and servers 100 105 115 15 20 25 85 85 90 Maintenance of programs 230 245 255 40 50 60 190 195 195 Software development 120 150 180 120 150 180 Computer network development 20 25 30 20 25 30 Rent of software 120 150 180 120 150 180 Costs of contracting 5 7 10 5 7 10 Outsourcer control 20 25 35 20 25 35 Other costs 105 135 165 105 135 165 Total 330 350 370 445 562 685 -115 -212 -315
Table 3 shows the evaluation of funds released by the transfer of maintenance of computers and servers as well as program maintenance for IT outsourcing. Estimates for IT outsourcing expenses are also provided. In Tables 3 and 4, the data are presented as fuzzy triangular numbers, where the second number determines the mode, and the first and third numbers determine the left and right boundaries of the set respectively.
Table 4: Estimation of possible losses from IT outsourcing of the BigData system, in thousand rubles
Losses element Option
Low level Mediu m level High level Variable estimate
WQO(t) A
B C 150 200 250 200 250 300 250 300 350 200 250 300 WQO(t) A
B C 300 400 500 400 500 600 500 600 700 500 600 700 WQO(t) A
B C 100 150 200 150 200 250 200 250 300 100 150 200 WQO(t) A
B C 150 200 250 200 250 300 250 300 350 150 200 250 WQO(t) A
B C 50 100 150 100 150 200 150 200 250 100 150 200 Total cost (whole project) 1050 1350 1650
The results show that the usage of IT outsourcing generates the costs of the economic facility of approximately 350 thousand rubles per year and 1.65 million rubles for 5 years of the IT development project, respectively. Net saving will amount to 1.2 to 1.6 million rubles for the whole project, and the annual savings for the foregoing usage of IT outsourcing for maintenance of computers and servers as well as debugging programs will amount to approximately 230 thousand rubles. Thus, the usage of IT outsourcing provides cost savings and is appropriate.
The optimization of the network server complex allows reducing the number of involved servers of the complex under varying load. Implementation of the developed procedures for optimizing the server complex allows reducing operational costs by 6-15%, which increases the efficiency of the information network.
5. CONCLUSION
The research on companies’ performance indicates a close correlation between the development of outsourcing and the level of competitiveness. The analysis showed that the usage of BigData IT outsourcing systems allows reducing operating costs by 6-15%. Big data are of considerable value to users. Companies that successfully implement big data in practice do that in order to improve their business results.
5803 evaluation of such systems through data processing services IT outsourcing has become an important result of the current work. This makes it possible to determine the complexity of the implementation of each particular computing task considering the cluster size. It is revealed that the assignment of the task to the BigData field is established not only by the amount of data processed, but also by the effectiveness of the applied algorithms for designing the organizational structure of the information system. The developed design model reflects the features of the multi-level cluster structure functioning during BigData queries processing.
REFERENCES:
[1] V.V. Lezhebokov, “Management of Large Data Arrays Information Processing”, News of Volgograd State Technical University, Vol. 6, No. 54, 2009, pp. 56-59.
[2] I.V. Nekrasov, “Complexity and the Criteria for the Attribution of Computational Problems to the Field of ‘big data’”, Automated Technologies and Production, Vol. 1, No. 11, 2016, pp. 50-55.
[3] E.A. Kuzmin, “Fundamentals in Systematics of
Uncertainty Management Theory”,
Mediterranean Journal of Social Sciences, Vol. 6, No. 5, S2, 2015, pp. 380-389.
[4] E.A. Kuzmin, “Principles of Uncertainty Management”, Problems of Risk Analysis, Vol. 11, No. 4, 2014, pp. 52-69.
[5] R. Dias, “Outstanding Outsourcing: Business Process Outsourcing Trends and Strategies of the Professional Services Sector in Western Europe”, Master’s Thesis, GRIN Publishing, 2014.
[6] D.A. Buyanov, “IT Outsourcing and the Theory of Transaction Costs”, Bulletin of Omsk University. Series: Economy, No. 1, 2014, pp. 115-119.
[7] N. Kshetri, “Big Data's Big Potential in Developing Economies: Impact on Agriculture, Health and Environmental Security”, CABI, 2016.
[8] K.A. Kumar, “Emerging Cost Effective Big Data Architectures”, in A.Y. Zomaya, and S.
Sakr (Eds.), Handbook of Big Data
Technologies, Springer, 2017.
[9] S.J. Qin, “Process Data Analytics in the Era of Big Data”, AIChE Journal, Vol. 60, No. 9, 2014, pp. 3092-3100.
[10] A. Geoff, and O. Jillian (Eds.), “Dementia Research and Care – Can Big Data Help?”, OECD Publishing, 2015.
[11] C. Tang, “The Data Industry: The Business and Economics of Information and Big Data”, John Wiley & Sons, 2016.
[12] M. Toedt, “Data Revolution: How Big Data Will Change the Way of Doing Business?”, Epubli, 2015.
[13] K. Sankaran, and M. Ahmed, “Leadership and Information Technology”, in J. Marques, and S. Dhiman (Eds.), Leadership Today: Practices for Personal and Professional Performance, Springer, 2016.
[14] K. Florian, “Dealing with Digital Information Richness in Supply Chain Management: A Review and a Big Data Analytics Approach”, Kassel University press GmbH, 2015.
[15] N.R. Sanders, “Big Data Driven Supply Chain Management: A Framework for Implementing Analytics and Turning Information into Intelligence”, Pearson Education, 2014.
[16] T. Davenport, “Big Data at Work: Dispelling the Myths, Uncovering the Opportunities”, Harvard Business Review Press, 2014.
[17] M.M. Skoric, “The Implications of Big Data for Developing and Transitional Economies: Extending the Triple Helix?”, Scientometrics, Vol. 99, No. 1, 2014, pp. 175-186, doi: 10.1007/s 11192-013-1106-5
[18] R. Walker, “From Big Data to Big Profits: Success with Data and Analytics”, Oxford University Press, 2015.
[19] F.J. Ohlhorst, “Big Data Analytics: Turning Big Data into Big Money”, John Wiley & Sons, 2012.
[20] N. Lin, “Applied Business Analytics: Integrating Business Process, Big Data, and Advanced Analytics”, FT Press, 2014.
[21] K.C. Li, H. Jiang, and A.Y. Zomaya, “Big Data Management and Processing”, CRC Press, 2017.
[22] B. Akhgar, G.B. Saathoff, H.R. Arabnia, R. Hill, A. Staniforth, and P.S. Bayerl, “Application of Big Data for National Security: A Practitioner’s Guide to Emerging Technologies”, Butterworth-Heinemann, 2015.
ISSN: 1992-8645 www.jatit.org E-ISSN: 1817-3195
5804 [24] F. Hu (Ed.), “Big Data: Storage, Sharing, and
Security”, CRC Press, 2016.
[25] W. Han, and Y. Xiao, “Big Data Security Analytic for Smart Grid with Fog Nodes”, in G. Wang, I. Ray, J.M.A. Calero, and S.M. Thampi (Eds.), Security, Privacy, and Anonymity in Computation, Communication, and Storage: 9th International Conference, SpaCCS 2016, Zhangjiajie, China, November 16-18, 2016, Proceedings, Springer International Publishing, 2016.
[26] A. Aho, J. Hopcroft, and J. Ulman, “Construction and Analysis of Computational Algorithms”, Moscow: Mir, 1979.
[27] N.V. Tutova, “Development of the Technique for the Optimization of Distribution of Resources of the Centers of Data Processing on the Internet”, Doctor of Science Thesis, Moscow: Moscow Technical University of Communications and Informatics, 2009.
[28] A.I. Vorobyov, “Models and Methods of Increasing the Efficiency of Providing Information Services in Data Centers”, Doctor of Science Thesis, St. Petersburg: St. Petersburg State Electrotechnical University (LETI), 2012. [29] “Big Data, Bigger Digital Shadows, and Biggest Growth in the Far East report”, IDC Digital Universe. Website: https://www.emc.com. Data retrieved: 01.07.2017.
[30] I.A. Sizov, “Big Data – big data in business”, Economics. Business. Computer science, No. 3, 2016, pp. 8-23.