7321
EXTRACTION METHOD OF HUB TEXT ON WEB REVIEW
BY TEXT MINING AND NETWORK APPROACH
1JAEWON HONG, 2SEUNGBAE PARK*
1Department of Global Trade, Gyeongnam National University of Science and Technology, Jinju 52725,
Korea
2Department of Industrial Management, Seoil University, Seoul 02192, Korea
E-mail: 1[email protected], 2[email protected]
ABSTRACT
In this study, we tried to explore the hub text using web review of airline customers. To accomplish this, airline customer’s online review data were collected and text mining and network analysis were applied. The results of this study are as follows. First, we defined the hub text by text mining and network analysis. Second, we explored the characteristics of the hub text. Hub text is a word that is used in conjunction with other text and expresses customer experience. Third, the hub text was related to performance of company. Hub texts were more correlated with customer satisfaction than non - hub texts. In this study, it is meaningful to define the hub text and to characterize the hub text by using the customer's online review data. Also, we can confirm that the company can contribute to the performance through managing the hub text.
Keywords: Hub Text, Web, Text Mining, Text Analysis, Network Analysis
1. INTRODUCTION
With the recent big data era, companies are faced with large amounts of textual data generated daily. The future competitiveness of companies depends on how much data science is realized. AI technology, represented by the era of the fourth industrial revolution, is adding accuracy of prediction based on various types of big data including text data. There is also a big data analysis movement in the aviation service industry. Airbus and Boeing use the Big Data to adjust crew and flight schedules to improve efficiency [1]. Jeju Air uses Big Data to provide more granular and accurate travel curation capabilities [2]. Interpark Tour is predicting customers’ favorite travel destinations through the Air Big Data [3].
Meanwhile, research on the aviation service industry is actively being carried out. Some researcher [4-5] analyzed the needs of airline customers through Twitter data text mining.
Text Mining is increasingly a recent and interesting area of research that seeks to use automated techniques to investigate a high-level of information from huge amounts of textual data and present it in a useful form to its potential users. In this analysis, they conducted an analysis of consumer opinions on LCC and emotional analysis
showing customer satisfaction through text analysis. Kolari and Pranam [6] analyzed the needs of aviation customers through the mining of Web data. Bogicevic et al. [7] identify the key airline quality attributes from online review posts and to examine the effect of identified airline quality attributes on e-WOM communication.
In this study, we tried to explore hub text identification, hub text characteristics, and its roles by text analysis and network analysis based on customer’s online review in web.
2. RELAED WORK 2.1 Text Mining
Advances in the Web, digital libraries, technical documentation, and medical data have made it easier to access larger amounts of text documents, creating useful data resources. Thus, knowledge discovery of text mining or text databases is a difficult task because it meets the natural language depths used in most available documents [8].
7322 topic identification [9]. More specifically, the text mining methods include text categorization, text clustering, concept/entity extraction, sentiment analysis, and entity-relationship modeling, and so on [10].
Many statistical analysis or machine learning methods focus on numeric data types, which mean that these methods are not suitable for document data. The document must be converted into structured data suitable for the analytical model [11].
2.2. Text Clustering
Topic modeling is a powerful approach to analyzing a massive amount of unclassified text. A topic contains a batch of words that frequently occurs together. Each set of named entities is represented by a cluster that is related to one of the ongoing topics in the corpus. The process of topic tracking within dynamic text data has gained the interest from the researchers who are working on the subject of text clustering in the digital field [14]. To have a better management approach to the explosion of electronic document archives, it requires using new techniques and analytical approaches that deals with automatically organizing, searching, indexing, and browsing large collections [12].
Text clustering is based on the Cluster hypothesis which proposes that relevant documents must have more similarities with one another than the non-relevant ones. The Clustering technique is a trust-worthy technique that is generally employed for analyzing larger amounts of data like data mining [13]. It has been proven that text clustering is one of the most effective tools used for text theme analysis [14]. There are huge repositories of online documents, scientifically interesting blogs, news articles and literature that can be used for textual analysis. On the major trends in modeling textual data is the latent topic modeling that has become very popular in the domain of unsupervised techniques [14].
2.3. Clustering Method
The problem of classification, concentrates on predicting various sets of records in a way that each record is labeled based on the learned target values of the previous records. The k-mean
algorithm has an extensive application owing to its direct parallelization. Furthermore, the order of respective data does not affect the k-mean
algorithm which attributes the numerical characteristics to it. Therefore k-mean algorithm is
most widely used among a wide variety of classification techniques exist for quantitative or categorical data.
The k-mean approach divides the data set into k clusters, where every cluster is subjected to be
represented by the mean of points; called the centroid. A two-step repetitive process is employed for the application of the algorithm: (1) Assigning every point to the nearest centroid. (2) Evaluating the centroids for a recently developed group [8, 15]. That is, since text may be modeled as quantitative data with frequencies on the word attributes by k-means clustering, it is possible to employ most classification methods for text classification invalid source specified.
3. RESEARCH PROCESS
3.1 Data Collection
In this study, we used the review data of Korean FSC (full service carrier) customers conducted by global air evaluation agencies. The data used in the analysis are review data from 414 people in 40 countries including 2 missing cases. The largest number of respondents were from the United States (26.7%), followed by Australia (22.8%), United Kingdom (11.9%) and so on. Except for the above countries, most of the respondents in other countries were less than five. The data period is approximately three years from January 2013 to April 2016.
Table.1. Respondents by Country
Country N Country N
United States 110 China 7
Australia 94 Indonesia 7
United Kingdom 49 Japan 7
South Korea 25 Vietnam 6
New Zealand 16 Malaysia 5
Germany 12 Philippines 5
7323
Singapore 9 India 3
Thailand 9 Belgium 2
Hong Kong 8 Brazil 2
Here are a part of the reviews have written by some customer. “The food is not good anymore. They no longer provide the travel amenities kit. The bathroom was no more mist spray, moisturizer and mouth wash. I asked the FA she told me they no longer provide. In fairness the FA is really very attentive and accommodating. The entertainment is good.” This review includes his/her thoughts about a service experience. In other words, as a result of the service experience, the food and toilet were not good and entertainment was good.
These texts contain important words for improving customer service. In other words, the review contains a vivid picture of customers' experience of using their airline for good or bad. Text mining is a useful tool for finding these important words.
3.2 Text Analysis
Currently researchers can use this type of text analysis through different approaches such as
Binary Terms, Terms Frequency and, Term Frequency-Inverse Document Frequency[14].
In this study, we performed text mining by R program for our text analysis. As a result, a total of 128 words were extracted from the review data.
[image:3.612.87.525.70.136.2]Text mining proceeded as follows: 1) converted the customer review data into a document vector, 2) removed articles, postposition, numbers, special characters, etc. in the document vector, 3) extracted words from the document vector by ‘tm’ package of R program, 4) define the target words based on the occurrence frequency of words between documents.
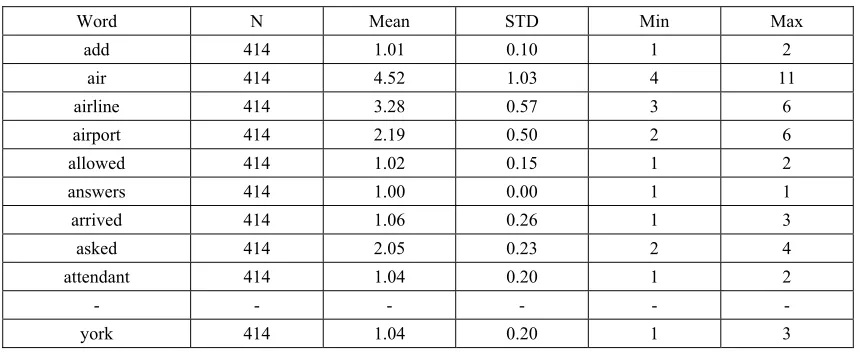
[image:3.612.92.524.410.586.2]Table 2 shows the frequency statistics of 128 words extracted through this text mining process. It shows add, air, airline, airport, and york etc. in alphabetical order A to Z. It shows that the average frequency of air, airline, and airport is high (See Table 2).
Table.2. Statistics of Extracted Words
Word N Mean STD Min Max
add 414 1.01 0.10 1 2
air 414 4.52 1.03 4 11
airline 414 3.28 0.57 3 6
airport 414 2.19 0.50 2 6
allowed 414 1.02 0.15 1 2
answers 414 1.00 0.00 1 1
arrived 414 1.06 0.26 1 3
asked 414 2.05 0.23 2 4
attendant 414 1.04 0.20 1 2
- - - -
york 414 1.04 0.20 1 3
3.3 Word Network and Hub Text
Before applying the underlying feature extraction, it is important to utilize text normalization techniques. Text normalization is defined as a process that consists of a series of steps to wrangle, clean, and standardize textual data into a form that could be consumed by other Natural Language Processing and analytic systems and applications as inputs. Often, tokenization is also a part of text normalization. Besides tokenization, various other techniques including cleaning text, case conversion, correcting spellings, removing
stop words and other unnecessary terms, stemming, and lemmatization are being used for text mining and pre-processing [8].
Hub can be seen as a person who has a lot of links with other people in the social network. And hub is located in the center of the social network structure and plays an important role by leading opinions based on many people linked with him/her [16-17].
7324 required to identify the hub text. In word network, a node is represented to a word, and a link is represented to a degree of simultaneous appearance. For example, if two words appear at the same time, a link is formed between the two words.
For the network analysis, the degree of simultaneous appearance for defining a link between words is set as a correlation between occurrence frequencies of words. This is because
the higher the correlation, the more likely there is a tendency to appear at the same time. In summary, we searched for the hub text by analyzing the word network based on the frequency of simultaneous occurrence of extracted words.
Table 3 shows the some part of correlation matrix between the 128 words. Only a few are presented on the paper.
Table.3. Correlation Matrix
add air airline - york
Add 1 0.05 0.12a - 0.23b
Air 0.05 1 0.03 - 0.07
Airline 0.12a 0.03 1 - 0.02
- - - -
York 0.23b 0.07 0.02 1
a<0.05, b<0.01
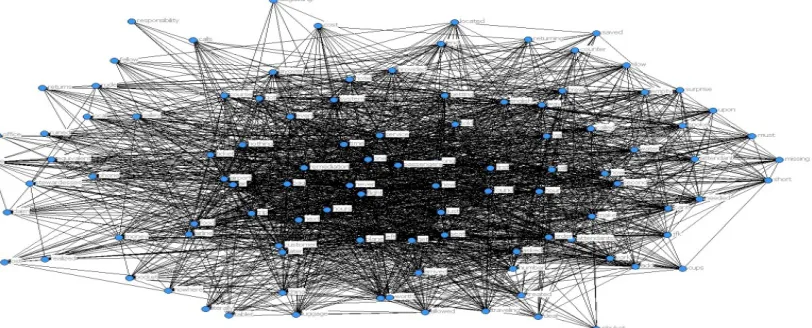
Considering the correlation of 128 words,
[image:4.612.99.505.398.562.2]the network is as follows. In this case, it can be seen that many nodes are connected regardless of the link strength.
Figure 1: 128 Words Network
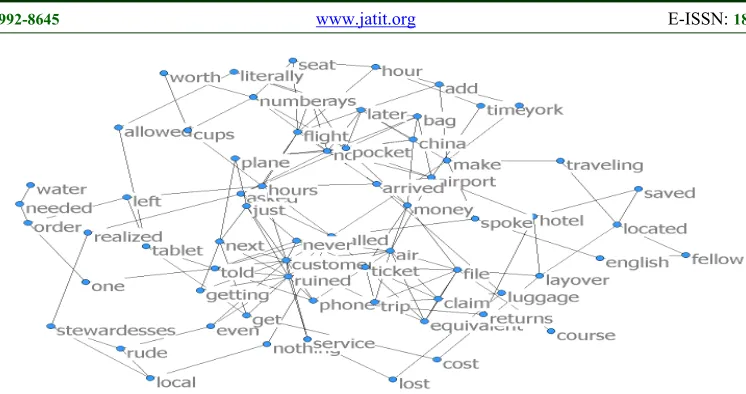
In order to analyze well, the word network was reconstructed with the correlation more 0.2. Figure 2 shows a word network based on a link defined by this criterion. In the following analysis
7325
Figure 2: 66 Words Network
Hub text can be defined in terms of the degree centrality in the network structure. That is, the degree centrality is more than 12, which corresponds to the third quartile. Based on these criteria, the hub text was classified in up to 19 words, including customer, ruined, ticket, air, called, nowhere, pocket, later, file, airport, flight, and appear etc.
The degree centrality of each defined hub texts are show in table 4. That is, customer’s degree was the highest at 28, followed by ruined, ticket, air, called, nowhere, and pocket. This is different from the simple frequency. In this study, we analyzed all the hub texts without selecting the service words separately.
Table.4. Hub Text List
Word Degree Word Degree
customer 28 flight 14
ruined 24 hours 14
ticket 22 claim 12
air 20 just 12
called 20 make 12
nowhere 20 money 12
pocket 20 never 12
later 18 next 12
file 16 trip 12
airport 14
Table 5 shows frequency statistics for 19
words categorized as hubs. The frequency of occurrence of the hub text ranged from 1 to 11 and the average frequency ranged from 1.0 to 4.5.
Table.5. Statistics of Hub Text
Word N Mean STD Min Max
customer 414 2.065 0.391 2 8
ruined 414 1.002 0.049 1 2
ticket 414 2.068 0.388 2 7
air 414 4.519 1.031 4 11
7326
nowhere 414 1.002 0.049 1 2
pocket 414 1.002 0.049 1 2
later 414 1.039 0.217 1 3
file 414 2.002 0.049 2 3
airport 414 2.191 0.497 2 6
flight 414 3.285 1.465 2 9
hours 414 1.174 0.471 1 5
claim 414 1.005 0.069 1 2
just 414 1.145 0.427 1 4
make 414 1.070 0.307 1 4
money 414 1.041 0.199 1 2
never 414 1.097 0.327 1 3
next 414 1.077 0.301 1 3
trip 414 1.133 0.405 1 4
4. EMPERICAL RESULT 4.1 Characteristics of Hub Text
To understand the characteristics of the hub text, we compared the frequency of words classified as hub texts with the non - hub text. Hub
text and non - hub text have similar average frequencies but differ in standard deviation and max value. That is, Hub text has larger standard deviation and max than non - hub text. Hub text indicates relatively high variability of appearance.
Table.6. Characteristics of Frequency
Variables Group t p
Hub Non-Hub
Mean 1.67 1.40 1.35 0.180
STD 0.35 0.20 2.65* 0.009
Min 1.53 1.32 1.05 0.297
Max 4.47 2.91 2.48* 0.022
*p<0.05
On the other hand, in terms of link strength, the hub text has a larger link strength than the non - hub text. Because of the high link strength,
the hub texts have an important position in relation to other text.
Table.7. Characteristics of Link Strength
group N Mean STD T p
Hub 19 0.134 0.082 3.46* 0.002
Non-Hub 19 0.058 0.049
*p<0.05
4.2 Effect of Hub
To explore if the emergence of hub text is an important signal to the company, we conducted the correlation analysis with customer satisfaction.
In this analysis, bottom 19 non-hub texts were used for comparison with the hub text.
7327 can see that the emergence of Hub text is an important signal for companies (See Table 8). Here, the correlation coefficient is expressed as negative (-) because it is mainly presented in the complaint position in referring to the hub text. The important
implication of this analysis is that the relevance to customer satisfaction is interpreted by the intensity of the correlation coefficient rather than the direction of the sign.
Table.8. Correlation with Customer Satisfaction
Hub Non-Hub
Word Correlation coefficient Word Correlation coefficient
customer -0.20* spoke -0.16*
ruined -0.14* stewardesses 0.00
ticket -0.21* allowed -0.17
air -0.15* cost 0.03*
called -0.20* english -0.07
nowhere -0.02 fellow 0.02
pocket -0.02 lost -0.06
later -0.14* needed -0.01
file -0.10* nothing -0.10
airport 0.01 one -0.10*
flight -0.22* realized 0.04
hours -0.24* returns 0.04
claim -0.06 saved 0.00
just -0.19* Time -0.06
make -0.17* Traveling -0.05
money -0.01 worth 0.00
never -0.25* york -0.10*
next -0.14* course -0.06
trip -0.07 water -0.05
*p<0.05, r=correlation coefficient
On the other hand, we examined whether the emergence of the hub text is an important signal to the enterprise at the individual hub text level. In other words, we tried to understand whether the hub text derived from the keyword analysis is an important word for the customer.
As a result, the group with high hub text occurrence showed lower customer satisfaction than the group with low hub text occurrence.
This means that the emergence of the hub text is associated with customer’s satisfaction, so we should be careful when the hub text appears. Also this suggests that the occurrence of the hub text is important, but the frequency of emergence is more important. In Table 9, ‘uc’ means that there is no or very small number of observations belonging to a particular group and cannot be calculated.
Table.9. With-in Effect of Hub Text
Word Group t P
Low High
customer 8.12 5.74 2.83* 0.011
ruined uc uc uc uc
ticket 8.10 6.21 2.40* 0.027
air 8.01 7.53 1.26 0.212
called 8.07 4.75 2.46* 0.043
7328
pocket uc uc uc uc
later 8.07 6.36 2.59* 0.010
file uc uc uc uc
airport 7.97 8.22 0.74 0.461
flight 8.50 7.74 3.43* 0.001
hours 8.11 4.09 3.73* 0.004
claim uc uc uc uc
just 8.16 6.90 2.82* 0.006
make 8.10 6.50 2.03* 0.053
money 8.10 7.88 0.22 0.831
never 8.21 5.94 3.83* 0.001
next 8.08 7.04 2.19* 0.029
trip 8.04 7.77 0.73 0.469
*p<0.05, uc: uncalculatable
5. CONCLUSIONS
The purpose of this study is to explore the hub text using the airline customer’s review data. For this purpose, this study applied existing text mining research [18-19] and word network analysis [20-21]. This study is expected to contribute to the management of pre-emptive customer service through airline customer reviews.
The results of this study are summarized as follows. First, we could find the hub text through text mining and network analysis based on the customer’s review data. This suggests that text mining and network analysis can be used to find the hub text for airline service management. Second, hub texts had unique characteristics. In other words, there is no difference between the average and minimum values of the appearance frequency of the hub text compared to the non - hub text, but there is a difference between the standard deviation and the maximum value. This means that the hub text has a large variance in appearance frequency. In other words, hub text is an extremely expressive word for customers. Third, the hub text has a strong link in the network. This implies that the hub text is a frequently used word with other words, suggesting that the text is important for the enterprise to monitor and manage. Fourth, the hub texts were related to performance. That is, the hub text has a higher correlation with customer satisfaction than the non - hub text. In addition, the hub text itself showed a different degree of satisfaction depending on the frequency of occurrence. This suggests that airlines need to manage hub text more actively for corporate performance, rather than simply monitoring customer reviews.
This study is meaningful in that it defined the hub text and characterized the hub text using the
customer’s review data. Also, it can be confirmed that the identified hub text can contribute to corporate performance.
Despite these implications, this study has some limitations. First, it is limited to generalization because it is targeted only Korean airline companies. Future research involving foreign airlines is needed. Second, we included all the texts with the service category in the text analysis. In the future, analysis focusing on the service category is needed. Third, we did not reflect the context because we analyzed by word. In the future, analysis considering sentence and context is required.
ACKNOWLEDGMENTS
This work was supported by Gyeongnam National University of Science and Technology Grant in 2018.
REFRENCES:
[1]http://www.dailysecu.com/?mod=news&act=artic leView&idxno=27280, 2017.12.22.
[2]http://biz.chosun.com/site/data/html_dir/2017/12/ 27/2017122700782.html, 2017.12.27.
[3]http://news.mk.co.kr/newsRead.php?year=2018& no=14335, 2018.01.08.
[4] Y. L. Bee and P. P. Tan, “Gaining customer knowledge in low cost airlines through text mining,” Industrial Management and Data
Systems, Vol. 114, No. 9, 2014, pp.1344-1359.
[5] Breen, J. O., “Mining twitter for airline consumer sentiment,” Practical text mining and statistical analysis for non-structured text data
7329 [6] Kolari, P. and Joshi, A., “Web mining: Research
and practice,” Computing in science and
engineering, Vol. 6, No. 4, 2004, pp.49-53.
[7] Bogicevic, V., Yang, W., Bujisic, M., and Bilgihan, A., “Visual data mining: analysis of airline service quality attributes,” Journal of
Quality Assurance in Hospitality and Tourism,
Vol. 18, No. 4, 2017, pp.509-530.
[8] Salloum, S. A., AlHamad, A. Q., Al-Emran, M., and Shaalan, K. "A Survey of Arabic Text
Mining." Intelligent Natural Language
Processing: Trends and Applications. Springer,
Cham, 2018, pp.417-431.
[9] Kumar, B. Shravan, and Vadlamani Ravi. "A survey of the applications of text mining in financial domain." Knowledge-Based Systems ,
Vol. 114, 2016, pp.128-147.
[10] Rekik, R., Kallel, I., Casillas, J., and Alimi, A. M., “Assessing web sites quality: A systematic literature review by text and association rules
mining,” International Journal of Information
Management, Vol. 38, No. 1, 2018, pp.201-216.
[11] Truyens, Maarten, and Patrick Van Eecke., "Legal aspects of text mining." Computer law and security review Vol. 30, No.2, 2014,
pp.153-170.
[12] He, Wu, Shenghua Zha, and Ling Li. "Social media competitive analysis and text mining: A case study in the pizza industry," International Journal of Information Management, Vol. 33,
No.3, 2013, pp.464-472.
[13] Mostafa, Mohamed M., "More than words: Social networks’ text mining for consumer
brand sentiments," Expert Systems with
Applications, Vol. 40, No.10, 2013, pp
4241-4251.
[14] Huang, A., “Similarity measures for text document clustering,” In Proceedings of the sixth New Zealand Computer Science Research Student Conference (NZCSRSC2008), Christchurch, New Zealand, pp. 49–56
[15] Ghosh, S., and Dubey, S. K., “Comparative analysis of k-means and fuzzy c-means algorithms,” International Journal of Advanced
Computer Science and Applications, Vol. 4, No.
4, 2013, pp.35-39.
[16] Goldenberg, J., Han, S., Lehmann, D. R., and Hong, J. W., “The role of hubs in the adoption process,” Journal of marketing, Vol. 73, No. 2,
2009, pp.1-13.
[17] K. Ohk and S. Han, “The Property of Sub-network in Earlier Stage of Information Diffusion,” Journal of Consumer Studies, Vol.
20, No. 1, 2009, pp.37-64.
[18] S. Park and J. Hong, “Relationship of Core Keywords and Marketing Performance Obtained by Using Text Mining: A Comparative Study,” New Physics: Sae Mulli,
Vol. 67, No. 5, 2017, pp.562-568.
[19] J. Hong and S. Park, “A Study on Extraction of Hub Text in Air Service Industry through Text Mining and Network Analysis,” The 3rd International Workshop on Convergence
Information Technology (IWCIT 2017), Busan
(2017).
[20] J. Lee and P. Jang, “Study on Research Trends in Airline Industry using Keyword Network Analysis: Focused on the Journal Articles in Scopus,” Journal of the Korea Convergence
Society, Vol. 8, No. 5, 2017, pp.169-178.
[21] K. H. Choi and J. A. Yoo, “A reviews on the social network analysis using R,” Journal of the
Korea Convergence Society, Vol. 6, No. 1, 2015,