IJPSR (2014), Vol. 5, Issue 7 (Research Article)
Received on 13 January, 2014; received in revised form, 31 March, 2014; accepted, 03 May, 2014; published 01 July, 2014
DEVELOPMENT AND VALIDATION OF HIGH PERFORMANCE THIN LAYER
CHROMATOGRAPHIC (HPTLC) METHOD FOR ESTIMATION OF TAPENTADOL HYDROCHLORIDE IN BULK AND ITS TABLET DOSAGE FORM
Pragati Amin*, Manisha Tayde and Prakruti Amin
Department of Pharmaceutical Chemistry, M.G.V’S Pharmacy College, Panchavati, Nasik-422 003, Maharashtra, India
Keywords:
High performance thin layer chromatography (HPTLC), Tapentadol Hydrochloride, validation,
Estimation, Densitometric evaluation.
Correspondence to Author:
Pragati Mukund Amin
M.Pharm (Pharmaceutical Chemistry) 01, Om Mahalaxmi Society Satana Naka, Near Patel Nagar, Malegaon, 423203Dist. (Nasik), Maharashtra, India.
E-mail:[email protected]
INTRODUCTION: Tapentadol is a novel
centrally acting opioid analgesic drug with dual mode of action as an agonist to the µ-opioid receptor and as a norepinephrine reuptake inhibitor. It is used for the treatment of moderate to severe
acute or chronic pain in adults 1, 2. The Tapentadol
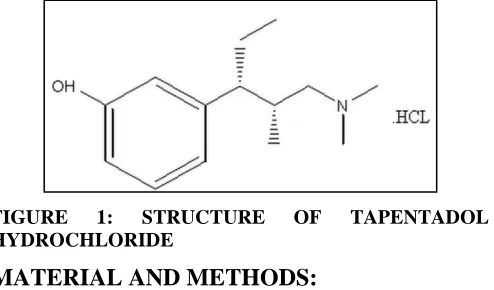
is chemically
3[3-(Dimethylamino)-1-ethyl-2-methylpropyl] phenol hydrochloride (Figure 1).
The empirical formula is C14H23NO.HCl and
molecular weight 257.799 g/mol 3. It is having
potency between morphine and tramadol 4. It is not
official in any Pharmacopoeia. Literature survey revealed that very few methods are developed for determination of Tapentadol Hydrochloride such as
UV- Spectrophotometric method 5, Stability
Indicating RP-HPLC method and liquid
Chromatography-Mass Spectrometry (LC/MS) 6, 7,
8
. So far not a single High Performance Thin Layer
Chromatographic method is reported for
quantitative determination of Tapentadol
Hydrochloride. Hence an attempt has been made to develop simple chromatographic HPTLC method
for quantitative estimation of Tapentadol
Hydrochloride in bulk and its tablet dosage form which is an accurate, sensitive and precise.
ABSTRACT: A simple, accurate, rapid and sensitive high performance thin layer chromatographic method has been developed for the estimation of Tapentadol Hydrochloride in bulk and its tablet dosage form. Chromatographic separation of the drugs was performed
on aluminum plates precoated with silica gel 60 F254 as the stationary
phase and the solvent system consisted of methanol: toluene (4:1v/v). Densitometric evaluation of the separated zones was performed by
UV detector at 272 nm. The drug was satisfactorily resolved with Rf
value 0.5 ± 0.02.The method was linear over concentration range of 1500-2000 (1.5-2.0 µL) ng/spot. The analytical percent recovery was found to be 99.92%.The intra and interday precision with percent relative standard deviation (%RSD) values in the range of 0.0895 to 0.0892. The validation of the method was carried as per ICH guidelines. The proposed HPTLC method was successfully employed for routine analysis of bulk drug and its commercial tablet dosage form.
QUICK RESPONSE CODE
DOI:
10.13040/IJPSR.0975-8232.5(7).2651-56
Article can be accessed online on: www.ijpsr.com
FIGURE 1: STRUCTURE OF TAPENTADOL HYDROCHLORIDE
MATERIAL AND METHODS:
Reagents and chemicals: Pure analytical sample of Tapentadol Hydrochloride was procured from MSN Laboratories Ltd. Hyderabad, (India) as a gift sample. The drug Tapentadol Hydrochloride was used without further purification and certified to contain 99.85% (w/w) on dry weight basis. The pharmaceutical tablet dosage form used in the study was Tydol-50 (Ranbaxy Laboratories Ltd.) labeled to contain 50 mg of Tapentadol Hydrochloride purchased from local pharmacy. All solvents and chemicals used in the study were Merck analytical grade.
Instrumentation: Micro-syringe (Linomat syringe Hamilton-Bonadzu Schweiz, Camag, Switzerland),
pre-coated aluminum plates with silica gel G 60F254
with 250 µm thickness (Merck Germany), Linomat 5 applicator, twin tough chamber (20×10 cm; Camag), UV chamber (Camag Switzerland), TLC scanner 4 (Camag Switzerland), win CATS version 1.4.2 software were used for study.
Selection of Mobile Phase and Chromatographic Conditions: For optimization of mobile phase sample was the spotted (100 ng/spot) in form of band, 8 mm from bottom and 15 mm from side edges and was developed by linear ascending development using solvents such as ethyl acetate, toluene, methanol, acetonitrile. After several trials, binary composition of methanol: toluene (4:1, v/v) was chosen as the mobile phase for analysis with chamber saturation time of 20 min at room temperature. The length of chromatogram run was 7 cm and development time was about 15 minutes. Plates were scan by using TLC scanner 4 in absorbance mode with scanning speed of 10 mm/sec. The radiation source utilized was deuterium lamp (D2) with spectrum wavelength emitted between 200-400 nm.
Preparation of standard stock solution: Standard stock solution of Tapentadol Hydrochloride was prepared by dissolving 10 mg of drug in 10 ml of methanol to obtained final concentration of 1.0 mg/ml.
Preparation of sample stock solution: Twenty tablets (Tydol-50) were weighed accurately and powdered. Powder equivalent to 100 mg of Tapentadol Hydrochloride was weighed and transferred to 100 ml volumetric flask, dissolved in 30 ml methanol by ultra-sonication of the flask for 15 minutes and solution was filtered through Whatmann paper no. 41.The final volume was made up to the mark to obtained tablet stock solution of 1.0 mg/ml.
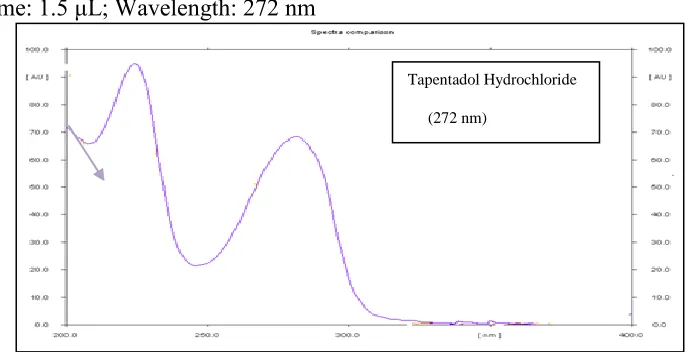
Selection of detection wavelength: After chromatographic development, from standard stock solution bands of different concentration were scanned over range of 200-400 nm. It was observed that drug showed considerable absorbance at 272 nm.
Method Validation: The method was validated as per ICH Q2 guidelines. The following parameters were used for validation of proposed method.
Linearity: From standard stock solution 1.5, 1.6, 1.7, 1.8, 1.9 and 2.0 µl of Tapentadol Hydrochloride spotted on the TLC plate to obtain final concentration of 1500, 1600, 1700, 1800,
1900, and 2000 ng/spot of Tapentadol
Hydrochloride. The plates were developed in 20×10 cm twin through chamber using freshly prepared developing phase (5 ml) i.e. methanol: toluene (4:1 v/v) and scanned at 272 nm. Peaks were integrated. The Response area was plotted against the corresponding concentrations to obtain the calibration curve.
Precision: Precision of proposed method was determined by repeatability and intermediate precision (Intraday and Interday). Intermediate precision i.e. intraday precision was determined by analyzing three replicates of different concentration of standard Tapentadol Hydrochloride (1500 ng/spot, 1700 ng/spot, and 1900 ng/spot) for three the times in same day and for interday precision
same concentrations were used for three
Accuracy: Accuracy of proposed method was ascertained on the basis of recovery study. Recovery studies were carried out by addition of standard working solution to pre-analyzed tablet solution at three different levels, 50 %, 100 % and 150 %. At each levels of the amount, three determinations were performed.
Robustness: In the robustness study, the influence of small, deliberate variations of the analytical parameters such plate activation time, chamber saturation time and concentration of mobile phase was checked. The effect of change in these
parameters on Response factor (Rf) values and peak
areas were evaluated by calculating relative standard deviations (%RSD).
Specificity: Specificity of proposed method was checked by analyzing the interference of commonly used excipients in the formulation. Pure Tapentadol Hydrochloride was spiked with common excipients such as talc, magnesium stearate and starch and then assayed by proposed method.
RESULT AND DISCUSSION: A number of
experimental parameters, such as activation time, saturation time, mobile phase composition, scan modes, detection wavelength were optimized during method development. Promising results were obtained by using mobile phase methanol and toluene in the ratio of 4:1 v/v and maximum
resolution with Rf value found to be 0.52 ± 0.02
Figure 2. Optimum wavelength for detection was 272 nm at which good detection for Tapentadol
[image:3.612.139.476.307.497.2]Hydrochloride was obtained Figure 3.
FIGURE 2: HPTLC DENSITOGRAM OF TAPENTADOL HYDROCHLORIDE
Mobile phase: Methanol: Toluene (4: 1: v/v)
Rf =0.52±0.02, Concentration: 1000 μg/mL for Tapentadol Hydrochloride
Application volume: 1.5 μL; Wavelength: 272 nm
FIGURE 3: SPECTRODENSITOGRAM OF TAPENTADOL HYDROCHLORIDE (WAVELENGTH 272 nm) Tapentadol Hydrochloride
[image:3.612.131.475.551.727.2]Linearity of calibration curve: Linear correlation was obtained between peak area and concentration of Tapentadol Hydrochloride in the range 1500-2000 ng/spot with correlation coefficient r=0.9987.
The linear regression equation was found to be y =
2.3199x+830.36 Figure 4, Table 1. The peak areas
[image:4.612.124.486.112.265.2]of Tapentadol Hydrochloride were reproducible by low coefficient variation.
FIGURE 4: CALIBRATION CURVE FOR TAPENTADOL HYDROCHLORIDE (1500-2000 ng/spot)
TABLE 1: OPTICAL CHARACTERISTICS OF PROPOSED METHOD
Precision: Precision of proposed method was determined by intermediate precision. The % RSD value proposed method was found less than 2
%.These low values of RSD indicate good
[image:4.612.50.536.442.717.2]precision of developed method Table 2, 3.
TABLE 2: PRECISION OF PROPOSED METHOD (INTRADAY)
TABLE 3: PRECISION OF PROPOSED METHOD (INTERDAY)
Sr. No. Concentration (ng/spot)
Interday Area
Average % RSD
Day1 Day2 Day 3
1 1500 4313.1 4314.1 4298.2 2 1500 4314.3 4443.1 4318.1 3 1500 4401.3 4308.3 4314.5
4 1700 4698.2 4762.1 4768.1 0.0892
5 1700 4696.3 4769.2 4768.1 6 1700 4612.1 4698.1 4730.1
% RSD 0.0980 0.0856 0.0882
y = 2.319x+830.36 R² = 0.9987
0 1000 2000 3000 4000 5000 6000
0 500 1000 1500 2000 2500
Series1 Linear (Series1)
Concentration (ng/spot) Area
Parameter Values
Detection wavelength ( nm) Beer’s law limit (ng/spot)
272.00 nm 1500-2000 (ng/spot) Régression Equation (y = mx + c) y = 2.3199x+830.36
Slope (m) 2.3199
Intercept (c) 830.36
Corrélation coefficient (r) 0.9987 Limit of detection (LOD) 1.116 Limit of quantitation (LOQ) 1.129
Sr. No. Concentration (ng/spot)
Interday Area
Average % RSD Morning Afternoon Evening
1 1500 4314.2 4412.1 4408.2
2 1500 4269.3 4342.1 4506.1
3 1500 4298.5 4298.3 4404.8
4 1700 4769.4 4725.1 4768.5 0.0895
5 1700 4783.2 4680.2 4750.1
6 1700 4766.2 4698.8 4772.1
Analysis of marketed formulation: The proposed method was successfully applied for determination of Tapentadol Hydrochloride in commercial tablet dosage form with label claim 50 mg/tablet. The
amount of Tapentadol Hydrochloride estimated was found to 49.99 mg/tablet with % label claim of
99.98 % Table 4 and the Rf value was in the same
range i.e. 0.52 ± 0.02.
TABLE 4: RESULT OF ANALYSIS OF MARKETED FORMULATION (ASSAY)
Accuracy: The accuracy the proposed method was ascertained by performing recovery study at three concentration levels i.e. 50%, 100% and 150%. The mean recovery of added drug at each level was
found to be 99.92 0.65% with standard deviation
of 0.292- 0.659 Table 5.
TABLE 5: RECOVERIES STUDIES FOR TAPENTADOL HYDROCHLORIDE Level of recovery Amount taken
(ng/spot)
Amount added (ng/spot)
Total amount
obtained (ng/spot) % recovery ± SD
50% 100% 150%
1600 1600 1600
800 1600 2400
2399 3196 3998
99.95 99.87 99.95
0.259 0.438 0.292
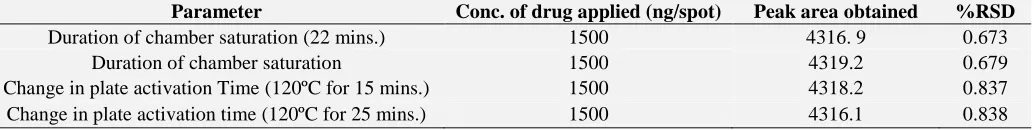
Robustness: Results of robustness study indicate that the selected factors such as chamber saturation time and plate activation time remained unaffected
by small variations with percent relative standard in
the range of 0.673 -0.838 Table 6.
TABLE 6: ROBUSTNESS DATA FOR TAPENTADOL HYDROCHLORIDE IN TEARMS OF PEAK ARE AND %RSD
Parameter Conc. of drug applied (ng/spot) Peak area obtained %RSD
Duration of chamber saturation (22 mins.) 1500 4316. 9 0.673 Duration of chamber saturation 1500 4319.2 0.679 Change in plate activation Time (120ºC for 15 mins.) 1500 4318.2 0.837 Change in plate activation time (120ºC for 25 mins.) 1500 4316.1 0.838
CONCLUSION: The results of percent recovery obtained using proposed HPTLC method indicates non-interference from the excipients used in the formulation. The result of analysis of marketed tablet formulation are highly reproducible with good percent label claim. So the proposed HPTLC method is found to be rapid, sensitive reproducible and precise. It can be used for the routine analysis of formulation containing this drug without any modification in assay procedure.
ACKNOWLEDGEMENT: The authors are
thankful to Head of the Department of Chemistry and the Principal Dr. R.S. Bhamber, M.G.V’S
Pharmacy College, Panchavati, Nasik (Maharashtra)
for providing all the necessary facilities. Authors are grateful to MSN Laboratories, Hyderabad for providing gift sample of Tapentadol Hydrochloride.
REFERENCES:
1 Goud Kiran S.D and Reddy Krishna V: RP-HPLC determination of related substances of Tapentadol in bulk and pharmaceutical dosage form. International Journal of Pharmacy and Biological Sciences 2012; 2(3):01-09.
2 Tzschentke TM, Jahnel U and Kogel B: “Tapentadol hydrochloride” a next generation, centrally acting analgesic with two mechanism of action in a single molecule. Drugs of Today 2009; 45:483-496.
3 Omkar Sherikar D and Mehta Priti J: Development and validation of RP-HPLC, UV-Spectrometric and Spectrophotometric method for estimation of Tapentadol Hydrochloride in bulk and in laboratory sample of tablet dosage form. Journal of Chemical and Pharmaceutical Research 2012, 4(9):4134-4140. 4 Tayal G, Grewal A, Mittal R and Bhatia N:
“Tapentadol” A -Novel Analgesic. Journal of Anaesth Clinical Pharmacology 2009; 25(4): 463-466.
5 Aditya Pavan B, Mahesh J and Vijayalakshmi M: Spectrophotometric estimation of Tapentadol Hydrochloride in bulk and its pharmaceutical Drug Amt. of drug in Amt. of drug Amt. of drug found % label claim ± SD ± RSD formulation(mg/tablet) applied (ng/spot)
TPH 50 1500 1495 99.98 0.568 0.002
[image:5.612.51.568.408.473.2]formulation. Journal of Chemical and Pharmaceutical Science 2012; 5(2): 52-55.
6 Dasu Deva Ch, Eshwar G, Silpakala E and Shalini R.N: Development of New Spectrophotometric Methods for the Quantitative Analysis of Tapentadol in Pharmaceutical Dosage Form. Current Pharma Research 2012; 3(1):718-726.
7 Ramanaiah G, Ramchachandran D, Shrinivas G, Jaipal G and Rao P: Development and validation of stability
indicating RP-LC method for simultaneous estimation of Tapentadol and Paracetamol in bulk and its pharmaceutical formulations. Journal of Chemical and Analytical Science 2012; 4(7):391-396.
8 Bhatasana Purvi T. and Parmar Ashok R: Development and validation of RP-HPLC method for estimation of Tapentadol Hydrochloride in its tablet dosage form. Pelagia Research Library (Der Pharmacia Sinica) 2012; 3(4):4222-426.
All © 2013 are reserved by International Journal of Pharmaceutical Sciences and Research. This Journal licensed under a Creative Commons Attribution-NonCommercial-ShareAlike 3.0 Unported License
This article can be downloaded to ANDROID OS based mobile. Scan QR Code using Code/Bar Scanner from your mobile. (Scanners are available on Google Playstore)
How to cite this article: