SINGLE SPEED GEAR BOX OPTIMIZATION USING GENETIC ALGORITHM
M. Chandrasekaran1, Padmanabhan S.2, and V. Srinivasa Raman3
1Faculty of Mechanical Engineering, Vels University, Chennai, India
2Department of Mechanical and Production Engineering, Sathyabama University, Chennai, India 3Department of Mechanical Engineering, R.V.S. College of Engineering and Technology, Dindigul, India
E-mail:[email protected]
ABSTRACT
Gears are used in almost all mechanical devices and they do several important jobs, but most important, they provide a gear reduction. This is vital to ensure that even though there is enough power there is also enough torque. Gear box has to produce maximum power with minimum weight. In many real-life problems, objectives under consideration conflict with each other, and optimizing a particular solution with respect to a single objective can result in unacceptable results with respect to the other objectives. Multi-objective formulations are realistic models for many complex engineering optimization problems. A reasonable solution to a multi-objective problem is to investigate a set of solutions, each of which satisfies the objectives at an acceptable level without being dominated by any other solution. In this paper, genetic algorithms developed specifically for a single speed gear box problem with multiple objectives.
Keywords: single speed gear box, design optimization, genetic algorithm, spur gear.
1. INTRODUCTION
Gears are machine elements used to transmit rotary motion between two shafts, normally with a constant ratio. Spur gears are the most common type of gear they have straight teeth and are mounted on parallel shafts. The main reason for the popularity of spur gears is their simplicity in design, easy manufacturer and maintenance. However due to their design spur gears create large stress on the gear teeth.
The development and use of optimization models is well established. However, the use of many models has been restricted in some fields of economic analysis where the problem is large in size and there are a large number of non-linear interactions. In most cases, the use of linear approximations or simplification of the model has been necessary in order to derive a solution.
Chaoli Sun et al. [1] have developed a modified particle swarm optimization with feasibility-based rules for mixed-variable optimization problems. Mehmet Bozca and Peter Fietkau [2] have proposed an empirical model based optimization of gearbox geometric design parameters to reduce rattle noise in an automotive transmission unit. Yong sheng Lian et al. [3] reviewed the recent progress in design optimization using evolutionary algorithms to solve real-world aerodynamic problems, such as design of turbo pump, compressor, and micro-air vehicles etc. Davoud Sedighizadeh and Ellips Masehian [4] have surveyed PSO methods and its application. Ming Chang [5] have developed a new proposal of using particle swarm optimization algorithms to solve multi-objective optimization problems was presented.
S Padmanabhan et al. [6] have evaluated worm and worm wheel gear pair with multi objectives such as maximizing power, efficiency and minimizing weight, center distance using Metaheuristic algorithms. Ruifeng Bo et al. [6] have analyzed, concept optimization problem based on an Ant Colony System (ACS) and by analyzing
the similarity between concept solving and Traveling Salesman Problem.
Zhou et al. [7] proposed an ant colony algorithm to solve the prematurity and unsteadiness problem in GA for job shop scheduling with the objective of minimization make span. S. M. Kannan et al. [8] have proposed a PSO for minimizing assembly variation in selective assembly problem. S Padmanabhan et al. [9] have evaluated bevel gear pair with multi objectives such as maximizing power, efficiency and minimizing weight, center distance using Metaheuristic algorithms. Majid Jaberipour et al. [10] have described about two new harmony search meta-heuristic algorithms for engineering optimization problems with continuous design variables. Lin C et al. [11] proposed a new immune algorithm makes use of the PSO advantages to improve the mutation mechanism in the immune algorithm. Wang et al. [12] proposed an improved algorithm named bi-directional convergence ant colony optimization (ACO) algorithm based on the graphic definition of the job-shop problem. Davoud Sedighizadeh and Ellips Masehian [13] have surveyed PSO methods and its application. V. Savsani et al. [14] have evaluated minimum weight of a spur gear train using particle swarm optimization (PSO) and simulated annealing (SA).
In this paper, Single speed gear box optimization have concentrated on investigating the combined objective function, which minimizes the volume and centre distance and maximizes power and efficiency with the constrained bending and crushing stresses, displacement acting on the gear tooth with regard to space requirements.
2. GEAR BOX DESIGN
found in most people’s everyday life from clocks to cars rolling mills to marine engines. Gears are the most common means of transmitting power in mechanical engineering.
Spur gears or straight-cut gears are the simplest type of gear. They consist of a cylinder or disk with the teeth projecting radially, and although they are not straight-sided in form, the edge of each tooth is straight and aligned parallel to the axis of rotation. These gears can be meshed together correctly only if they are fitted to parallel shafts.
a) Design of single speed gear box
This section describes about the design objectives, constraints, considered in this work. This work uses a combined objective function, which minimizes the volume and centre distance and maximizes power and efficiency.
Table-1. Specification of gear box. Gear box Single speed Gear Ratio 3.5
Power 18 kW
Speed on Pinion 1200 rpm Gear material C45 Bending stress 140 N/mm2 Crushing stress 500 N/mm2 Young’s modulus 2.15 N/mm2 Density 7.85 x 10⁻⁶ kg/mm3 Factor of safety 2
The objective functions considered in this work are given below and represents in equations (1), (2), (3) and (7).
Maximization of power delivered by the gear box (f1)
Minimization of the over all weight – which is indirectly related to the volume of the gears (f2)
Maximization of the efficiency of the gear box (f3)
Minimization of the center distance between the input and output shafts (f4).
Design constraints are to be considered for the design of above gear box is, crushing stress (8), bending stress (9), center distance (10), module (11) and number teeth (12) represented in eqns.
The objective functions are reduced in terms of design variables Power (P), module (m), number teeth on pinion (Z1) and thickness of the gear (b). The following objective functions and design constraints are adopted from [15] and [16].
The complete problem is,
Maximize f1= P (1)
Minimize f2= 8.172 ×10⁻⁵ × b × (mZ1)2 (2)
Maximize f3 = 100 – PL (3)
PL =
Cos
f
50
×)
H
H
(
)
H
H
(
t s 2 t 2 s
(4)PL = 4.256 ×
)
H
H
(
)
H
H
(
t s 2 t 2 s
Ht = 1.28 ×
0
.
883
0
.
342
Z
2
1
5 . 0 2 1 (5)HS = 4.5 ×
342
.
0
883
.
0
Z
571
.
0
1
5 . 0 2 1 (6) Minimize f4 = 2.25 mZ1 (7)Subject to,
mZ1 × (b)0.5 x (P)-0.5 ≥ 317.16 (8)
(Z1 + 8) × m2× b x P-1 ≥ 607.92 (9)
m Z1 x P-(1/3) ≥ 53.648 (10)
m3× P-1 (Z
1+8) ≥ 31.4523 (11)
Zi ε I, for i = 14, 16,18,20,22,24,26,28 (12)
and
Combined Objective Function =
4 3 2 1 . . . min . max . min . max xNW dist cent dist cent xNW efficiency efficiency xNW weight weight xNW power power (13) Where NW1, NW2, NW3 and NW4 = 0.25.
3. GENETIC ALGORTHM
Genetic algorithms (GA) are an evolutionary optimisation approach which is an alternative to traditional optimization methods. GA is most appropriate for complex non-linear models where location of the global optimum is a difficult task. It may be possible to use GA techniques to consider problems which may not be modeled as accurately using other approaches. Therefore, GA appears to be a potentially useful approach.
which encode candidate solutions (called individuals, creatures, or phenotypes) to an optimization problem, evolves toward better solutions. Traditionally, solutions are represented in binary as strings of 0s and 1s, but other encodings are also possible. The evolution usually starts from a population of randomly generated individuals and happens in generations. In each generation, the fitness of every individual in the population is evaluated, multiple individuals are stochastically selected from the current population (based on their fitness), and modified (recombined and possibly randomly mutated) to form a new population. The new population is then used in the next iteration of the algorithm. Commonly, the algorithm terminates when either a maximum number of generations has been produced, or a satisfactory fitness level has been reached for the population. If the algorithm has terminated due to a maximum number of generations, a satisfactory solution may or may not have been reached.
The GA consists of four main stages: evaluation, selection, crossover and mutation. The evaluation procedure measures the fitness of each individual solution in the population and assigns it a relative value based on the defining optimization criteria. Typically in a non-linear programming scenario, this measure will reflect the objective value of the given model. The selection procedure randomly selects individuals of the current population for development of the next generation. Various alternative methods have been proposed but all follow the idea that the fittest have a greater chance of survival. The crossover procedure takes two selected individuals and combines them about a crossover point thereby creating two new individuals. Simple reproduction can also occur which replicates a single individual into the new population. The mutation procedure randomly modifies the genes of an individual subject to a small mutation factor, introducing further randomness into the population. The algorithm as follows,
1. Generate random population of n chromosomes (Generation).
2. Evaluate the fitness f(x) of each chromosome x in the population (Evaluation).
3. Create a new population by repeating following steps until the new population is complete (New population)
i. Select two parent chromosomes from a population according to their fitness (Selection)
ii. With a crossover probability cross over the parents to form a new offspring (children). (Crossover) iii. With a mutation probability mutate new offspring at each locus (position in chromosome). (Mutation) Place new offspring in a new population.
4. Use new generated population for a further run of algorithm.
5. If the end condition is satisfied, stop, and return the best solution in current population.
Or Go to Evaluation step.
This iterative process continues until one of the possible termination criteria is met: if a known optimal or acceptable solution level is attained; or if a maximum number of generations have been performed. Generally, the last of these criteria applies as convergence slows to the optimal solution.
b) GA for gear box design optimization
The size of population adopted in this work is 20. For an illustration of the implementation of the population size of ‘5 strings’ is taken and it is given bellow. The range of module is taken as 4 to 8 mm.
i. Generation
Mixed integer generation is used for the control variables. The module, thickness, number of teeth in pinion, the power, maximum power, minimum weight, maximum efficiency, minimum cone distance and COF are represented in a control string. Module, thickness of gear pair & power are represented as continuous variables within limits. The number of teeth is represented as discrete variable. The control string will be as per the eqn (14).
X= [P, b, Z1, m, f1, f2, f3, f4, COF] (14) The strings are having the variables, which satisfy all the
constraints the corresponding objective functions and COF.
ii. Tournament selection
The tournament selection provides a selective pressure by holding a tournament competition among individuals. The best individual (the winner) from this group is selected as parent. That is, any two strings are randomly selected from this population and the COF value is compared. The string having the lowest COF will be stored in the new mating pool.
For example if the string 1 and 3 are selected randomly, string 3 is stored in the new mating pool. If any string having the lowest COF is selected more than one time, it will be stored that much time in the pool. This process is repeated until the mating pool for generating new offspring is filled. Tournament selection is used as selection mechanism in order to avoid premature convergence.
iii. Crossover
The crossover performs the crossover variable-wise using crossover operator. It creates children solutions in proportion to the difference in parent solutions. The two properties which give its search power are,
The extend of children solution is in proportion to the parent solutions.
Near parent solutions are more likely to be chosen as children solutions than solutions distant from parents.
satisfaction and COF has to be updated. If there is any constraint violation, the process has to be repeated. The parents and their variables are randomly selected and the
process is repeated until 80% of the pool got crossover to generate new offspring
Table-2. Numerical generation of the control strings for GA.
Generation P b Z1 m F1 F2 F3 F4 COF
1 19.583 26.58 16 4.244 19.583 10.00693 97.88525 152.784 1 2 19.583 26.58 16 4.244 19.583 10.00693 97.88525 152.784 0.966676 3 18.599 20 20 4.194 18.599 11.48952 98.30621 188.73 0.987705 4 18.599 20 20 4.194 18.599 11.48952 98.30621 188.73 0.958951 5 18.599 20 20 4.194 18.599 11.48952 98.30621 188.73 0.958951
iv. Mutation
Newly generated offspring undergo mutation operation. Like in the crossover operator, the probability distribution can also be a polynomial function, instead of a normal distribution. The mutation probability is taken as 0.2. That is 20 % of the offspring, which is having higher value of COF will undergo this operation, to improve their fitness. In this operator the shape of the probability distribution is directly controlled by the external parameter m and distribution is not dynamically changed with
generations. Newly generated individuals replace their parents and forms the parents for the next generation. Stopping criteria: This COF followed in this work, is to stop the computation after reaching the required number of iterations. The maximum number of iterations adopted here is 10. For each iteration, the population is generated continuously by 100 times.
4. RESULTS AND DISCUSSION
Initially, the input values are generated randomly with their variable limits. If the generated values satisfy the design constraints, then the values of objective functions f1, f2, f3 and f4 are computed along with COF. The optimum values of objective function and design variables corresponding to the minimum COF value obtained by the GA.
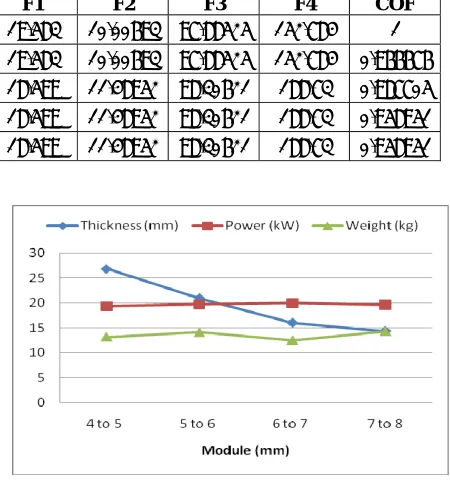
Table 3. Results of gearbox using GA.
Parameters 4 to 5 mm
5 to 6 mm
6 to7 mm
7 to8 mm
Module (mm) 4.065 5.354 6.162 7.055
Thickness(mm) 26.87 20.99 16.01 14.35
No. of teeth in
pinion 18 16 16 16
Power (kW) 19.351 19.756 19.966 19.649
Weight (kg) 13.22 14.16 12.51 14.35
Efficiency (%) 97.86 97.88 97.88 97.88
Center
[image:4.612.311.536.167.408.2]distance (mm) 164.63 192.74 194.10 253.98
Figure-1. Comparison of GA results.
5. CONCLUSIONS
The above results indicate that the GA is highly capable of minimizing the weight of gear box without deviating all the framed constraints. Weight reduction reduces the amount of material consumed while manufacturing the gears. The material consumption is directly proportional to the cost. If the designer of automobile and machine tool gearboxes takes the benefit of optimization of GA in to account while designing, the manufacturers can confidently face the aggressive environment of producing the gearboxes at reasonable cost. As a future work, the GA can be evaluated by optimizing various gear design like helical, worm and bevel, epicyclic gear train and gear box etc.
Notations
GA = Genetic Algorithm
Hs = Specific sliding velocity at start of approach action
Ht = Specific sliding velocity at end of recess action. P = Power transmitted in kW
σb = Induced bending stress in N/mm2 [σb] = Allowable bending stress in N/mm2 a = Centre distance between shafts in mm b = Thickness of gear and pinion in mm PL = Percentage of power loss
[Mt] = Design twisting moment in N-mm η = Percentage efficiency
y = Form factor
f = Average coefficient of friction m = Normal Module in mm Φ = Pressure angle in
REFERENCES
[1] Chaoli Sun, Jianchao Zeng and Jeng-Shyang Pan. 2011. “A modified particle swarm optimization with Feasibility-based rules for mixed-variable Optimization problems”, International Journal of Innovative Computing, Information and Control ,Vol. 7, No. 6, pp. 3081- 3096.
[2] Mehmet Bozca and Peter Fietkau. 2010. “Empirical model based optimization of gearbox geometric design parameters to reduce rattle noise in an automotive transmission”, Mechanism and Machine Theory, Vol. 45, pp. 1599–1612.
[3] Yongsheng Lian, Akira Oyama and Meng-Sing Liou. 2010. “Progress in design optimization using evolutionary algorithms for aerodynamic problems”, Progress in Aerospace Sciences, Vol. 46, pp. 199– 223.
[4] Davoud Sedighizadeh and Ellips Masehian. 2009. “Particle Swarm Optimization Methods, Taxonomy and Applications” International Journal of Computer Theory and Engineering, Vol. 1, No. 5, December.
[5] Shu-Kai S. Fan and Ju-Ming Chang. 2009. “A parallel particle swarm optimization algorithm for multi-objective optimization problems”, Engineering Optimization, Vol. 41, No. 7, pp. 673–697.
[6] Padmanabhan S., M. Chandrasekaran and V. Srinivasa Raman. 2010. “Optimization Of Worm And Worm Wheel Design Using Metaheuristic Algorithms”, IETECH Journal of Mechanical Design, Vol. 4, No. 2, pp 043 – 047.
[7] Ruifeng Bo, Ruiqin Li and Hongxia Pan. 2008. “Concept optimization for mechanical product by using ant colony system”, Journal of Mechanical Science and Technology, Vol. 22, pp. 628-638.
[8] Zhou P., Li X-P. and Zhang H-F. 2004. “An ant colony algorithm for job shop scheduling problem”, Proceedings of the 5th worldcongress on intelligent control and automation, China, 15–19, pp. 2899– 2903.
[9] S. M. Kannan, R. Sivasubramanian and V. Jayabalan. 2009. “Particle swarm optimization for minimizing assembly variation in selective assembly”, Int Jour. Adv Manuf Technology, Vol 42, pp. 793–803.
[10]Padmanabhan S., M. Chandrasekaran and V. Srinivasa Raman. 2012. “Evaluation of the Performance of Ant Colony Optimization over Particle Swarm Optimization”, International Journal of Computer Applications (0975 – 8887) Vol. 38, No.6, pp. 12-18.
[11]Majid Jaberipour and Esmaile Khorram. 2010. “Two improved harmony search algorithms for solving engineering optimization problems”, Commun Nonlinear Sci Numer Simulat, Vol. 15, pp. 3316– 3331.
[12]Lin C., Liu Y. and Lee C. 2008. “An efficient neural fuzzy network based on immune particle swarm optimization for prediction and control applications”, Journal of Innovative Computing, Information and Control Vol.4, No.7, pp.1711-1722.
[13]Wang C-Q, Cao Y-F and Dai G-Z. 2004. “Bi-directional convergence ACO for job-shop scheduling”, Computer Integrated Manufacturing System Vol.10, No. 7, pp. 820–824.
[14]Davoud Sedighizadeh and Ellips Masehian. 2009. “Particle Swarm Optimization Methods, Taxonomy and Applications” International Journal of Computer Theory and Engineering, Vol. 1, No. 5, December.
[15]V. Savsani, R.V. Rao and D.P. Vakharia. 2010. “Optimal weight design of a gear train using particle swarm optimization and simulated annealing algorithms”, Mechanism and Machine Theory, Vol.45, pp. 531–541.
[16]Design Data Book, Faculty of Mechanical Engineering, PSG College of Technology, Coimbatore- 641004,Tamilnadu ,India.
[17]Dudley D.W. 1954. Practical Gear Design, McGraw – Hill Book Co, New York.
Notations
GA : Genetic Algorithm
Hs : Specific sliding velocity at start of approach action
Ht : Specific sliding velocity at end of recess action. P : Power transmitted in kW
σc : Induced crushing stress in N/mm2 [σc] : Allowable crushing stress in N/mm2 σb : Induced bending stress in N/mm2 [σb] : Allowable bending stress in N/mm2 a : Centre distance between shafts in mm b : Thickness of gear and pinion in mm PL : Percentage of power loss
[Mt] : Design twisting moment in N-mm
η : Percentage Efficiency y : Form factor