www.hydrol-earth-syst-sci.net/20/1547/2016/ doi:10.5194/hess-20-1547-2016
© Author(s) 2016. CC Attribution 3.0 License.
Assessing the impact of climate variability and human
activities on streamflow variation
Jianxia Chang, Hongxue Zhang, Yimin Wang, and Yuelu Zhu
State Key Laboratory Base of Eco-hydraulic Engineering in Arid Area, Xi’an University of Technology, Xi’an 710048, China Correspondence to: Jianxia Chang ([email protected])
Received: 29 September 2015 – Published in Hydrol. Earth Syst. Sci. Discuss.: 10 December 2015 Revised: 28 March 2016 – Accepted: 29 March 2016 – Published: 22 April 2016
Abstract. Water resources in river systems have been chang-ing under the impact of both climate variability and human activities. Assessing the respective impact on decadal stream-flow variation is important for water resource management. By using an elasticity-based method and calibrated TOP-MODEL and VIC hydrological models, we quantitatively isolated the relative contributions that human activities and climate variability made to decadal streamflow changes in the Jinghe basin, located in the northwest of China. This is an important watershed of the Shaanxi province that supplies drinking water for a population of over 6 million people. The results showed that the maximum value of the moisture in-dex (E0/P) was 1.91 and appeared in 1991–2000, and the decreased speed of streamflow was higher since 1990 com-pared with 1960–1990. The average annual streamflow from 1990 to 2010 was reduced by 26.96 % compared with the multiyear average value (from 1960 to 2010). The estimates of the impacts of climate variability and human activities on streamflow decreases from the hydrological models were similar to those from the elasticity-based method. The maxi-mum contribution value of human activities was 99 % when averaged over the three methods, and appeared in 1981–1990 due to the effects of soil and water conservation measures and irrigation water withdrawal. Climate variability made the greatest contribution to streamflow reduction in 1991–2000, the values of which was 40.4 %. We emphasized various source of errors and uncertainties that may occur in the hy-drological model (parameter and structural uncertainty) and elasticity-based method (model parameter) in climate change impact studies.
1 Introduction
Catchment hydrology and water resources are driven by cli-mate and strongly modulated by human activities. Clicli-mate variability affects catchment streamflow, chiefly through pre-cipitation and the variability of potential evaporation (Scan-lon et al., 2007; Chien et al., 2013; Ward et al., 2009; Chang et al., 2010). Human activities include land use/cover change, reservoir operations, and direct water extraction from surface water and groundwater, all of which can alter river stream-flow. It is important to separate and quantify the effects of climate variability and human activities so that they can be used for land use planning, water extraction and water re-source management. With the increasing scarcity of water resources, hydrologists, decision makers, and policy mak-ers have paid considerable attention to how much of the ob-served change in annual streamflow can be attributed to cli-mate variability and human activities (Zhang et al., 2008; Tomer and Schilling, 2009; Roderick and Farquhar, 2011; Destouni et al., 2013).
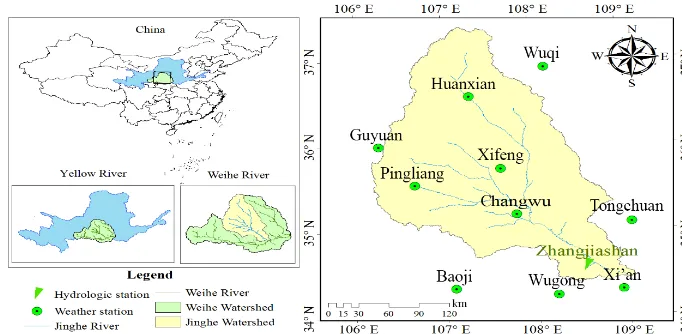
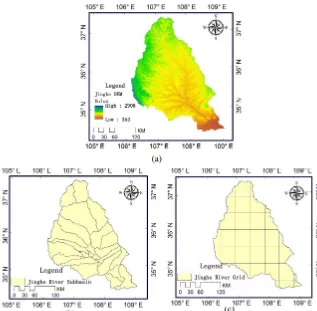
Sta-Figure 1. Location of hydrological and meteorological stations along the Jinghe River.
tistical methods for identifying the contributions of climate and human impacts on runoff were also used, especially in regions where long-term climate and hydrological data were available (Hamed, 2008; Notebaert et al., 2011; Ren-ner et al., 2012; Roudier et al., 2014). Among the statisti-cal methods, streamflow elasticity was commonly used to quantify the influence of changes in precipitation and po-tential evapotranspiration on streamflow (Sankarasubrama-nian et al., 2001; Chiew, 2006; Fu et al., 2007; Roderick and Farquhar, 2011). Streamflow elasticity can be obtained non-parametrically from observations or by employing a paramet-ric model, such as the Budyko hypothesis or other models. The Budyko hypothesis was widely used, as it was an easy method with a limited requirement for climate data (Dono-hue et al., 2007; Liu et al., 2009; Wang and Hejazi, 2011; Wang et al., 2013).
Climate change and human activities have had tremen-dous impact on the water resources of China’s highly ur-banized regions. One such river basin is the Jinghe River, which is the secondary tributary of the Yellow River, the largest tributary of the Weihe River in China, with an area of 45 400 km2 and an average annual natural streamflow of 12.3×10⁸m3. This is an important watershed of the Shaanxi province that supplies drinking water for a population of over 6 million people. The area is an important economic cen-ter of the Shaanxi province in China, and the wacen-ter shortage became a bottleneck for economic progress. Human activi-ties, such as water withdrawal, soil and water conservation projects, have become extensive in the Jinghe River during the last several decades. Climate change studies in the Yel-low River basin reported warming trends at a rate of 1.28◦C over 50 years, while the average precipitation dropped by ap-proximately 8.8 % over the second half of the 20th century (Yang et al., 2004). A combination of these effects reduced the streamflow (Gao et al., 2013; Chang et al., 2015). Few studies were devoted to using the methods of elasticity mod-eling together with hydrological modmod-eling to quantitatively
analyze the contributions of climate variability and human activities to streamflow variation in the Jinghe River basin.
The aims of this study were to (1) present a generic frame-work that investigate the impact of climate variability and human activities on streamflow using the concept of stream-flow elasticity and hydrological models, the TOPMODEL and VIC models, which are fundamentally different in regard to their representation of streamflow generation and (2) com-pare these methods. The elasticity-based method only pro-vides results at a mean annual timescale, whereas the hydro-logical modeling results are at a monthly and daily scale, and they are aggregated to the mean annual timescale for com-parison with those obtained from the statistical method.
The Jinghe River basin (JRB) was chosen as the study area, which has presented a significantly decreasing trend of annual streamflow since 1990 (Chang et al., 2015; Du and Shi, 2012). This paper is organized as follows: Sect. 2 de-scribes the study area and data sources; Sect. 3 is devoted to introducing the methods used; Sect. 4 provides hydrologi-cal modeling and the elasticity method results; Sect. 5 com-pares the results from the hydrological modeling with the elasticity-based method; and Sect. 6 discusses several con-clusions generated from the present study.
2 Study area and data
[image:2.612.127.468.66.233.2]streamflow between July and October is approximately 65 % of the mean annual streamflow. The Zhangjiashan station is the downstream hydrometric station on the main stream of the Jinghe River.
Human activities have become extensive in the JRB dur-ing the last several decades. Water withdrawal has increased rapidly due to the increase of the population, industry, and agricultural water demand. Thick and highly erodible loess, unevenly distributed rainfall, and the relatively high inten-sity of rainstorms have led to high soil loss rates across the basin. To reduce soil loss, soil and water conservation mea-sures have been undertaken since the 1970s, which have re-sulted in an increase in vegetation cover. Therefore, climate variability combined with human activities has contributed to the decrease of the streamflow in the JRB (Chang et al., 2015; Du and Shi, 2012).
In this study, the catchment information data set, including the catchment boundary and runoff ratio, was from the Min-istry of Water Resources of the People’s Republic of China. The daily, monthly, and annual climate variables and ob-served streamflow were used. The daily meteorological data, including precipitation, air temperature, sunshine hours, rel-ative humidity, and wind speed, of 10 stations during 1960– 2010 were collected from the China Meteorological Admin-istration. The monthly and annual precipitation was then es-tablished from the collected data, and annual maximum, an-nual minimum, and multianan-nual mean air temperature val-ues were then calculated according to the daily data. The monthly potential evaporation was calculated according to the monthly wind speed, sunshine hours, relative humid-ity, and air temperature using the Penman–Monteith method. The daily streamflow data of the Zhangjiashan hydrological station for the same period were gathered from the Shaanxi Hydrometric and Water Resource Bureau. The DEM data were obtained from the SRTM 30 m digital elevation data. The soil data were extracted from the FAO two-layer 5 min 16-category global soil texture maps. Figure 1 also shows the location of the meteorological stations and hydrological sta-tion in the basin.
3 Methodology
3.1 Framework of analysis
The historic streamflow series can be split into two subseries according to the streamflow break year, and human activities in the recorded years prior to the break year can be negligible. The recorded years prior to this break year were defined as the baseline period, while the recorded years after this break year were defined as the changed period. The difference be-tween the mean annual streamflow during the changed period (Q2)and the mean annual streamflow during the baseline pe-riod (Q1)represent the total change of the streamflow (1Q) after the break year. The1Qcan be regarded as a function of climatic variables and the integrated effects of topography,
soil, land use/cover and human activities, such as water with-drawal. Under the assumption that the topography and soil of the study area did not vary during the study period,1Qwas referred to as a combination of climate variability and human activities and can be estimated as the formulation
1Q=Q2−Q1, (1)
where1Qis the total change in the mean annual streamflow, andQ1 andQ2are the average annual streamflows before and after an abrupt change, respectively.
The total change in the mean annual streamflow can be estimated as
1Q=1QC+1QH, (2)
where1QCand1QH are the changes in the mean annual streamflow due to climate and human activities, respectively. 3.2 Climate elasticity model for1QC
The concept of streamflow elasticity was first introduced by Schaake (1990) to evaluate the sensitivity of streamflow to climate change. It represents the proportional change in streamflow divided by the proportional change in a climatic variable (X), such as precipitation or potential evapotranspi-ration, and is expressed as
ε=∂Q/Q
∂X/X. (3)
Thus, precipitation elasticity and evapotranspiration elastic-ity of streamflow were defined by Schaake (1990) as
εP(P , Q)= dQ/Q
dP /P =
dQ
dP P
Q (4)
εE0(E0, Q)= dQ/Q
dE0/E0
= dQ
dE0 E0
Q, (5)
whereP,E0, and Qare precipitation, potential evapotran-spiration, and streamflow, respectively.εP andεE0 are the elasticity of streamflow with respect to P andE0, respec-tively. Changes in these factors could lead to streamflow variation, and the relationship can be estimated (Milly and Dunne, 2002) as
1QC= εP1P /P+εE01E0/E0
Q, (6)
where1P and1E0are the changes in precipitation and po-tential evapotranspiration, respectively, andεP+εE0=1. To estimate1QCusing Eq. (6), the estimate of the precipita-tion elasticity of streamflowεP is needed. In this paper, the Budyko hypothesis was used to estimateεP.
by water availability and atmospheric demand. The water availability can be approximated by precipitation. The at-mospheric demand represents the maximum possible evap-otranspiration and is often equated with potential evapotran-spiration. The role of the landscape properties on the mean annual water balance is mainly implicit and is deemed to be subservient to the dominant role of climate. In some for-mulations of the Budyko formulation, the role of the land-scape is represented by a separate lumped parameter (Sun et al., 2014; Donohue et al., 2007), which is nevertheless esti-mated empirically. According to the long-term water balance equation (Q=P−Ea)and the Budyko hypothesis, the ac-tual evapotranspiration (Ea)is a function of the aridity index (8=E0/P ) and the precipitation and potential evapotran-spiration elasticity of streamflow can be expressed as (Arora, 2002; Dooge et al., 1999)
εP =1+∅F0(∅)/(1−F (∅))andεP +εE0=1. (7) A couple of mathematical functions were proposed to rep-resent the Budyko hypothesis (e.g., Fu, 1996; Milly, 1993). We used the Budyko formulation of Fu (1981) who combined a dimensional analysis with mathematical reasoning and de-veloped analytical solutions for the mean annual actual evap-otranspiration
F (∅)=1+∅−(1+∅w)1/w, (8)
whereF ()is a function proposed by the Budyko, which not only satisfies the boundary conditions under the land sur-face evapotranspiration but also remains independent from the balance equation of hydrothermal coupling (the water balance and energy balance). wis a model parameter with range [1,∞], which is related to vegetation type, soil hy-draulic property, and topography (Fu, 1996). w was set to 2.0, according to Li et al. (2013).
3.3 Modeling-based approach for1QCor1QH Hydrological models can also be used to assess the impact of climate change and human activities on streamflow. A hy-drological model was calibrated and validated to estimate
1QC and 1QH by using the data from the baseline pe-riod. The model was run using climate data (e.g., precipi-tation and temperature) during the changed period with hu-man activities (i.e., land use and hu-management) and during the baseline period. 1QC was estimated as the difference between the mean annual average of simulated streamflow during the changed period and the mean annual average of simulated streamflow during the baseline period. 1QH was estimated as the difference between the mean annual average of the simulated streamflow during the changed period and the mean annual average of the observed streamflow during the changed period.
In this study, two hydrological models, the TOPMODEL and the VIC model, were used to investigate the effects of
climate variability and human activities on streamflow. TOP-MODEL (Beven and Kirkby, 1979) is a semidistributed vari-able contributing area hydrological model. It is based on sim-ple physical reasoning and assumes that there is a steady transfer of water in the saturated zone along hillslopes, with a water table nearly parallel to the ground surface. It considers two streamflow sources: (shallow) groundwater and satura-tion overland flow. The model assumes an exponential de-cay of soil transmissivity with increasing water table depth, and it considers two main parameters for the dynamics of the saturated store: the recession parameterm[L] and the aver-age soil transmissivity at saturationT [LT−1]. The classical form for the topographic index that follows from the expo-nential assumption,λi=ln(a/tanb) was used, whereais the drained area per unit length of the contour curve and b is the topographic gradient. All of the points in the catchment with the same topographic index were predicted as having the same deficit, i.e., they were considered to be hydrologically similar. The original TOPMODEL had four parameters: the maximum allowable root storage deficit (SRmax), the trans-missivity of the soil in the saturated state (T ), the maximum moisture max deficit (Szm), and the recharge delay param-eter (Td). Since the early 1990s, TOPMODEL has widely been applied to watersheds all over the world because it can provide spatially distributed hydrological information with available input requirements (e.g., Digital Elevation Model (DEM) data) (Seibert et al., 1997, Chen and Wu, 2012; Fu-rusho et al., 2013). Some studies also applied TOPMODEL in semiarid area basins, such as the Yellow River in China, and the results showed that this model was applicable over a wide range of environments (Xiong and Guo, 2004; Boston et al., 2004; Gumindoga et al., 2014).
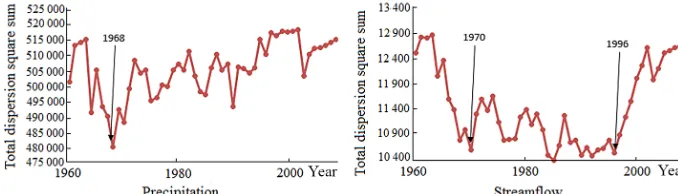
Figure 2. The abrupt change points of precipitation and streamflow in the JRB with sequential cluster.
Figure 3. Changes of the annual streamflow and precipitation of the JRB.
(Wang et al., 2010; Bao et al., 2012; Su and Xie, 2003; Liu et al., 2013).
We obtained the break points of precipitation and stream-flow series in the JRB by means of a sequential cluster anal-ysis method, and the break points appeared in 1968 and 1970 (Fig. 2), respectively, so we used 1960–1970 as the baseline period for this study. The TOPMODEL and the VIC model were calibrated using the historical data from 1960 to 1966 and validated against the observation during the period of 1967 to 1970. During the calibration, adjustments were made to minimize the sum of squares of the difference between the modeled and recorded monthly streamflow. Nash–Sutcliffe efficiency coefficients (NSE) and relative water balance er-ror percentage (WBE) were used for the model assessment using the observed data and model estimates.
NSE=1−
N
P
i=1
(Qo, i−Qs, i)2 N
P
i=1
(Qo, i−Qo)2
(9)
WEB=
100×(
N
P
i=1 Qs, i−
N
P
i=1 Qo, i)
N
P
i=1 Qo, i
(10)
Here, Qo, i is the observed streamflow of periodi,Qs, i is the simulated streamflow of periodi, andQois the mean of observed streamflow.
4 Results
4.1 The analysis of streamflow, precipitation, potential evaporation, and temperature
The regional average precipitation, potential evaporation and temperature in the JRB during 1960–2010 were calculated using the Thiessen polygon method of ArcGIS 9.3, according to the corresponding data of 10 hydrometeorology stations.
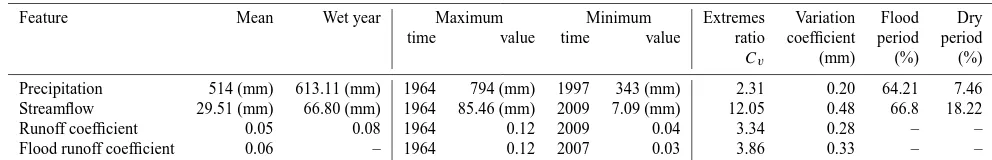
Table 1. Characteristics of the inter-annual streamflow and precipitation of the JRB.
Feature Mean Wet year Maximum Minimum Extremes Variation Flood Dry time value time value ratio coefficient period period
Cv (mm) (%) (%)
[image:6.612.102.490.203.271.2]Precipitation 514 (mm) 613.11 (mm) 1964 794 (mm) 1997 343 (mm) 2.31 0.20 64.21 7.46 Streamflow 29.51 (mm) 66.80 (mm) 1964 85.46 (mm) 2009 7.09 (mm) 12.05 0.48 66.8 18.22 Runoff coefficient 0.05 0.08 1964 0.12 2009 0.04 3.34 0.28 – – Flood runoff coefficient 0.06 – 1964 0.12 2007 0.03 3.86 0.33 – –
Table 2. The average monthly estimated potential evaporation and temperature value of the JRB from 1960 to 2010.
Month Mar Apr May Jun Jul Aug Sep Oct Nov Dec Jan Feb
E0(mm) 61 90 118 131 126 108 70 49 32 24 26 34
Mean (mm) 90 (Spring) 122 (Summer) 50 (Autumn) 28 (Winter)
T (◦C) 4.1 10.7 15.8 20 21.8 20.3 15.2 9.2 2.4 −3.3 −4.7 −1.7
Mean (◦C) 10.2 20.7 8.9 −3.3
Note:E0was the potential evaporation;Twas the temperature.
Table 3. Statistical values of the potential evaporation and temperature of the JRB from 1960 to 2010.
Feature Mean Cv Cs Maximum Minimum
time value time value
E0 870 (mm) 0.08 0.53 2004 1092 (mm) 1964 713 (mm)
T 9.1 (◦C) 0.07 0.09 1998 10.2 (◦C) 1967 7.6 (◦C)
[image:6.612.126.470.355.524.2]Note: the mean was the multiyear average value;Cvwas the deviation coefficient;Cswas the skewness coefficient.
Figure 4. Changes of the annual potential evaporation and temperature of the JRB.
from water withdrawal and other reasons, such as changes in groundwater. The precipitation and streamflow during the flood season (from July to October) accounted for 64.21 and 66.80 %, respectively, and the proportion of the dry pe-riod (from November to March of next year) was 7.46 and 18.22 %, respectively. The proportion of precipitation that became runoff was low, with a mean annual runoff ratio of 0.05, but increased during the wet years. The runoff ratios during the wet year and wet season were 0.08 and 0.06, re-spectively.
The result of Mann–Kendall’s test showed the same de-creasing trend for the annual precipitation and streamflow in
JRB from 1960 to 2010. TheZvalue of streamflow and pre-cipitation was−4.26 (confidence level was 99 %) and−1.39 (confidence level was 90 %), respectively, which meant that the decreasing trend for streamflow was significant, but was insignificant for precipitation ata=0.05 level.
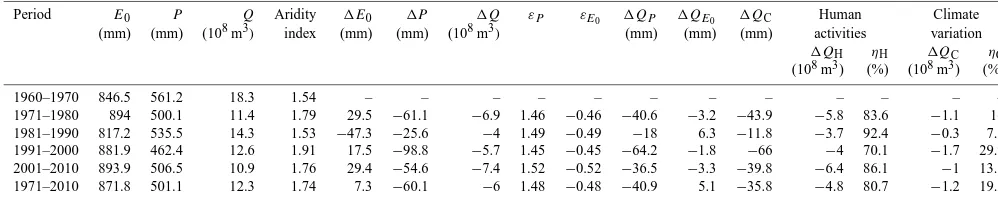
Table 4. The impact of climate variability and human activities on streamflow with the climate elasticity model.
Period E0 P Q Aridity 1E0 1P 1Q εP εE0 1QP 1QE0 1QC Human Climate
(mm) (mm) (108m3) index (mm) (mm) (108m3) (mm) (mm) (mm) activities variation
1QH ηH 1QC ηC
(108m3) (%) (108m3) (%)
1960–1970 846.5 561.2 18.3 1.54 – – – – – – – – – – – – 1971–1980 894 500.1 11.4 1.79 29.5 −61.1 −6.9 1.46 −0.46 −40.6 −3.2 −43.9 −5.8 83.6 −1.1 16 1981–1990 817.2 535.5 14.3 1.53 −47.3 −25.6 −4 1.49 −0.49 −18 6.3 −11.8 −3.7 92.4 −0.3 7.5 1991–2000 881.9 462.4 12.6 1.91 17.5 −98.8 −5.7 1.45 −0.45 −64.2 −1.8 −66 −4 70.1 −1.7 29.9 2001–2010 893.9 506.5 10.9 1.76 29.4 −54.6 −7.4 1.52 −0.52 −36.5 −3.3 −39.8 −6.4 86.1 −1 13.5 1971–2010 871.8 501.1 12.3 1.74 7.3 −60.1 −6 1.48 −0.48 −40.9 5.1 −35.8 −4.8 80.7 −1.2 19.3
evaporation and temperature are shown in Fig. 4 and Ta-ble 3. The mean annual potential evaporation in the 1980s (822 mm) decreased compared with the values from the 1960s (861 mm) and started to increase slowly in the 1990s (973 mm). The temperature showed a slight upward trend in the 1970s and 1980s and had a sharp upward trend in the 1990s era. TheZ values of potential evaporation and tem-perature for Mann–Kendall’s test were 0.4 and 4.12, respec-tively, which meant that the potential evaporation presented an insignificant increasing trend, but the temperature had a significant increasing trend.
4.2 Climate elasticity model results
To assess the impact of climate variability on streamflow, the climate elasticity of streamflow was calculated using Eqs. (3)–(8) based on the annual precipitation and annual po-tential evapotranspiration of the period from 1971 to 2010. Table 4 summarizes the annual precipitation (P ), potential evapotranspiration (E0), precipitation elasticity (εP), evapo-transpiration elasticity (εE0)of streamflow for different peri-ods, and percentage change in streamflow results for differ-ent periods when using the elasticity-based approaches. The variation of εP was between 1.45 and 1.52, while the vari-ation of εE0 was between−0.45 and −0.52. As shown in Table 4, for the period of 1971 to 2010, the values ofεP and
εE0 obtained were 1.48 and−0.48, respectively. The results indicated that a 10 % decrease in precipitation would result in a 14.8 % drop in streamflow, while a 10 % decrease in po-tential evapotranspiration would induce a 4.8 % increase of streamflow. According to Eq. (3), with the calculatedεP and
εE0, it was estimated that the 60.1 mm decrease in precip-itation in 1971–2010 might have decreased the streamflow by 40.9 mm; meanwhile, the 7.3 mm increase in the poten-tial evapotranspiration may have caused a 5.1 mm decrease in streamflow.
The reductions in streamflow from 1971 to 2010 due to cli-mate variability ranged between 7.5 and 29.9 %, with a me-dian of 19.3 %, for the JRB when using the Budyko frame-work method. The maximum and minimum values of the moisture index (E0/P, Willmott et al., 2011; Willmott and Feddema, 1992) were 1.91 and 1.53, respectively, and ap-peared in 1991–2000 and 1981–1990, respectively.
Com-pared with the 1960–1970 baseline period, the reductions in
1Qfor 1991–2000 and 1981–1990 were 5.7×10⁸m3 and 4.0×10⁸m3, respectively, with climate variability making the greatest and smallest contributions (i.e., 29.9 and 7.5 %, see Table 4).
4.3 Hydrological model calibration and validation During the hydrological model simulation, the digital eleva-tion quadrangles at a 30 m resolueleva-tion in the study area were used (Fig. 5). In TOPMODEL, several sub-basins were de-lineated according to the flow accumulation by means of ArcGIS, and the flow direction and accumulation were ex-tracted in ArcGIS to calculate the topographic index-area ra-tio of sub-basin. The monthly precipitara-tion, potential evapo-transpiration and observed streamflow acted as the input data. Figure 6 shows the simulated and recorded streamflow for the calibration and validation periods. A calibrated VIC model was also employed to separate the hydrological impacts of land use change and climate change. The VIC model was used for the streamflow simulation at a 0.5◦spatial and daily temporal resolution in the JRB (Fig. 5). Figure 6 shows the simulated and observed streamflows for the calibration and validation periods, with outputs computed on a monthly ba-sis.
sug-Figure 5. (a) Elevation maps of the study area at a 30 m resolution. (b) Sub-basin of TOPMODEL. (c) Grid of the VIC model.
Figure 6. The simulated and observed streamflow for TOPMODEL
and the VIC model. (a) Calibration period. (b) Validation period.
gested that both the rainfall–runoff models and the calibra-tion method used in this study were robust for the calibrated model to be used over an independent simulation period ad-equately. Additionally, the results justified the suitability of the models applied for assessing the change in streamflow due to climate variability and human activities.
4.4 Hydrological model simulation results
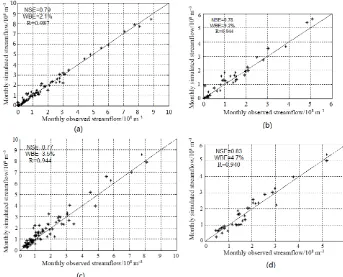
The calibrated model parameters for both the models from the baseline periods of 1960 to 1970 were used with the me-teorological time series to simulate the streamflow for the changed period of 1971 to 2010 and to investigate the effects of climate variability and human activities. The scatter plots in Figs. 8 and 9 show the comparison of the simulated and observed monthly and annual streamflow time series for the JRB for the entire modeling period (1971–2010) for TOP-MODEL and the VIC model, respectively.
[image:8.612.61.273.421.660.2]ob-Figure 7. Comparison of the observed and modeled monthly streamflows for the calibration and validation periods. (a,b) Calibration and
[image:9.612.126.469.68.345.2]validation streamflow for TOPMODEL. (c,d) Calibration and validation streamflow for the VIC model.
Figure 8. Comparison of the observed and modeled monthly streamflow in 1971–2010. (a) TOPMODEL. (b) The VIC model.
served streamflow was 26 years, from 1970 to 2010, for TOPMODEL, and 25 years for the same period for the VIC model. Additionally, most of the years appeared before 1990 or after 2005 for both of the models, and in the rest of the years the simulated streamflow was similar or lower to the observed value. The effect of climate variability was elimi-nated from the simulations for the changed periods by using the actual observed climate to drive the calibrated models. The difference in the observed and simulated streamflows during the changed period was due to the difference in land cover and other human activities. The results indicated that human activities caused significant reductions in streamflow,
and these results were consistent with other studies (Chang et al., 2015; Tang et al., 2013; Zhan et al., 2014).
4.5 Influence of human activities and climate variability
[image:9.612.128.468.394.522.2]activi-Table 5. The impact of climate variability and human activities on streamflow with TOPMODEL.
Period QB Annual mean streamflow Human activities Climate variation (108m3) 1Q(108m3) QS(108m3) 1QH(108m3) ηH(%) 1QC(108m3) ηC(%)
1960–1970 18.3 – – – – – –
1971–1980 11.4 −6.9 17.0 −5.6 81.2 −1.3 18.8
1981–1990 14.3 −4.0 18.1 −3.8 95 −0.2 5
1991–2000 12.6 −5.7 15.6 −3.0 52.6 −2.7 47.4
2001–2010 10.9 −7.4 17.0 −6.1 82.4 −1.3 17.6
[image:10.612.82.513.85.186.2]1971–2010 12.3 −6.0 16.9 −4.6 76.7 −1.4 23.3
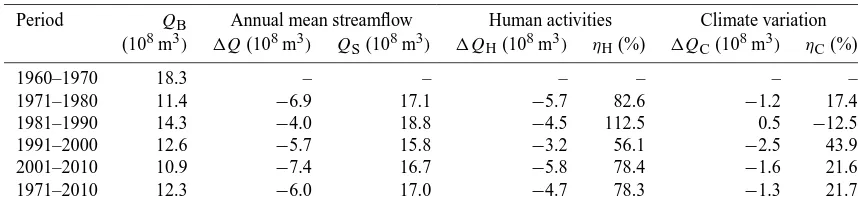
Table 6. The impact of climate variability and human activities on streamflow with the VIC model.
Period QB Annual mean streamflow Human activities Climate variation (108m3) 1Q(108m3) QS(108m3) 1QH(108m3) ηH(%) 1QC(108m3) ηC(%)
1960–1970 18.3 – – – – – –
1971–1980 11.4 −6.9 17.1 −5.7 82.6 −1.2 17.4
1981–1990 14.3 −4.0 18.8 −4.5 112.5 0.5 −12.5
1991–2000 12.6 −5.7 15.8 −3.2 56.1 −2.5 43.9
2001–2010 10.9 −7.4 16.7 −5.8 78.4 −1.6 21.6
1971–2010 12.3 −6.0 17.0 −4.7 78.3 −1.3 21.7
Figure 9. Time series of the observed and modeled annual
stream-flow for the entire modeling period.
ties. Tables 5 and 6 summarize the mean annual statistics of the observed and simulated streamflow for the different pe-riods of the 1970s, 1980s, 1990s, and 2000s. The third col-umn provides the values for1Q, which were the differences between the observed streamflow (QB)during the changed periods and the baseline. The fourth column shows the sim-ulated streamflow (QS)for the changed periods when using climate and calibrated parameter values from the baseline pe-riod.1QH was the difference betweenQB andQS for the changed periods, and1QCwas the difference betweenQS for the changed period and QB of the baseline.ηCandηH were the contribution ratios of climate change and human activities to streamflow, respectively.
The results showed that the average annual streamflow for 1971–2010 (12.3×10⁸m3)was less than that of the base-line period (18.3×10⁸m3), which meant that the recorded streamflow in the JRB markedly decreased over the past
few decades. The total reduction1Qin streamflow for the changed period of 1971 to 2010 (compared to the baseline period) due to human activities and climate variability for the JRB were 4.6×10⁸m3 and 1.4×10⁸m3 for the TOP-MODEL, which was approximately 76.7 and 23.3 % of the total reduction, respectively. The corresponding reductions were 4.7×10⁸m3 (78.3 %) and 1.3×10⁸m3 (21.7 %) for the VIC model.
For the different periods of 1970s, 1980s, 1990s, and 2000s, the reductions in streamflow due to human activities were 5.6×10⁸m3(81.2 % of the total change), 3.8×10⁸m3 (95 % of the total change), 3.0×10⁸m3 (52.6 % of the to-tal change), and 6.1×10⁸m3(82.4 % of the total change) for TOPMODEL model, respectively. For the VIC model, the reductions in streamflow due to human activities for the 1970s, 1980s, 1990s, and 2000s were and 5.7×10⁸m3 (82.6 % of the total change), 4.5×10⁸m3 (112.5 % of the total change), 3.2×10⁸m3 (56.1 % of the total change), and 5.8×10⁸m3(78.4 % of the total change), respectively. Compared to the baseline period of 1960 to 1970, stream-flow greatly decreased during 2001–2010. The change im-pacts (i.e., 1QHand 1QC) in 2001–2010 were approxi-mately 77.4 % (1QH)and 22.6 % (1QC)of the total reduc-tion when averaged over the two methods.
5 Discussion
5.1 Results of comparing the three methods
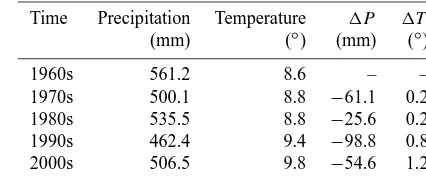
[image:10.612.83.512.224.324.2] [image:10.612.49.285.318.455.2]activi-ties from that of climate variability. The climate elasticity method is relatively simple and can easily be transplanted to other areas, and it provides a general streamflow change with less data and parameters (Ma et al., 2010). On the contrary, the hydrological modeling method more precisely distinguishes the streamflow change, such as the monthly change or daily change. In this paper, the three methods were implemented independently at different timescales (cli-mate elasticity method based on the yearly scale, TOP-MODEL based on the monthly scale and the VIC model hydrological simulation based on the daily scale (Peng and Xu, 2010). For the whole JRB, the contribution ratios of cli-mate variability in 1971–2010 were 23.3, 21.7, and 19.3 % from TOPMODEL, the VIC hydrological modeling method, and the elasticity method, respectively, and the mean contri-bution ratio was 21.4 %. The most significant climate vari-ability impacts were 2.7×10⁸m3 (47.4 %), 2.5×10⁸m3 (43.9 %), and 1.7×10⁸m3 (29.9 %) for TOPMODEL, the VIC model and the elasticity-based model, respectively, ap-pearing in the 1990s. The most significant human activities impacts were 3.8×10⁸m3 (95 %), 4.5×10⁸m3 (112.5 %) and 3.7×10⁸m3(92.4 %) for TOPMODEL, the VIC model, and the elasticity-based model, respectively, appearing in the 1980s. The analysis showed that the results from the two hy-drological models were similar to those from the commonly used elasticity-based approach. Additionally, the results of the three methods showed that the significant climate vari-ability impacts appeared in the 1990s, and the significant human activities impacts appeared in the 1980s. The pre-cipitation and temperature are the dominant factors of cli-mate changes, and it is shown that the maximum decrease of precipitation appeared in the 1990s, compared with the baseline period (1960s), and the minimum decrease was in the 1980s (Table 7). The temperature showed a significant increase in the 1990s, but an insignificant increase in the 1980s. The changes of precipitation and temperature for dif-ferent decades verified that the significant climate variabil-ity impacts appeared in the 1990s. We concluded that the three methods were in good agreement in terms of the dom-inant contributor, i.e., human activities played a more im-portant role in the streamflow decrease than the change in climate in the JRB. The main result of this research agreed with the findings of other studies in northwest China. Tang et al. (2013) used the climate elasticity method and the Soil and Water Assessment Tool (SWAT) model to evaluate the impact of climate variability on streamflow in the Yel-low River basin, these two methods gave consistent results. Zhan et al. (2014) developed an improved climate elastic-ity method based on the original climate elasticelastic-ity method and conducted a quantitative assessment of the impact of cli-mate change and human activities on the streamflow decrease in the Wei River basin. The results from the improved cli-mate elasticity method yielded a climatic contribution to the streamflow decrease of 22–29 % and a human contribution of 71–78 %.
Table 7. Changes of the inter-annual precipitation and temperature
of the JRB.
Time Precipitation Temperature 1P 1T
(mm) (◦) (mm) (◦)
1960s 561.2 8.6 – –
1970s 500.1 8.8 −61.1 0.2
1980s 535.5 8.8 −25.6 0.2
1990s 462.4 9.4 −98.8 0.8
2000s 506.5 9.8 −54.6 1.2
Note:1Pand1Tare the changes in precipitation and temperature, respectively.
There are still differences in terms of the magnitude of each attributor. Compared to the results of the hydrologi-cal model, TOPMODEL, and the VIC model, the stream-flow variation caused by climate variability estimated from the elasticity-based methods was smaller and that caused by human activities was larger, which agreed with the results of Li et al. (2012) and Sun et al. (2014). Except for the annual precipitation change, which was the most important factor in the streamflow change, the inter-annual and intra-annual pre-cipitation variability, as second-order climate effects, could lead to a significant change in streamflow. However, these second-order climate effects cannot be taken into account in the elasticity-based methods, while they can be considered in the dynamic hydrological modeling method, which may par-tially explain the difference in the results (Potter and Chiew, 2011).
5.2 Errors and uncertainties with each approach The elasticity-based assessment of environmental change on streamflow has more advantages than the hydrological mod-eling approach because it does not require detailed spa-tial input data. In this paper, the elasticity coefficient (i.e., the sensitivity coefficient of streamflow to climatic variable changes) was estimated. While it was commonly suggested that catchment properties were spatially and temporally var-ied and were influential on the streamflow of the watershed (Roderick and Farquhar, 2011; Donohue et al., 2011), the er-rors from both the model structure (Budyko equations) and the model parameter in Fu’s model (w), which we assumed to be temporally consistent, caused the elasticity-based anal-ysis to not be free of error.
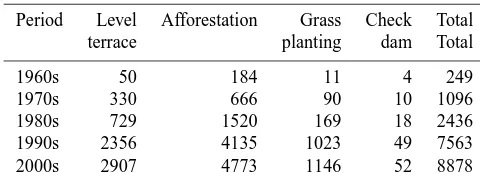
Table 8. Cumulative area (km2) of soil and water conservation in the JRB at the end of different years.
Period Level Afforestation Grass Check Total
terrace planting dam Total
1960s 50 184 11 4 249
1970s 330 666 90 10 1096
1980s 729 1520 169 18 2436
1990s 2356 4135 1023 49 7563
2000s 2907 4773 1146 52 8878
5.3 The cause for streamflow change
The results indicated that human activities were the dom-inant factors (approximately 80 %) for the streamflow de-crease in 1971–2010 in the study area. There were several types of human activities that influenced streamflow, includ-ing water conservancy projects, large hydraulic projects, and water withdrawal for industry and agricultural demand. The human-induced reduction in streamflow in the JRB was pri-marily caused by soil and water conservation measures and water withdrawal (Shi, 2013; Zhao et al., 2013). From Ta-ble 8, it can be observed that the large-scale soil conservation area expanded with time to prevent soil and water loss since the 1970s. As shown in Table 8, the amount of afforesta-tion and level terrace land steadily increased since 1970 and that the amount of grass-planting land markedly increased since 1990. As of the 2000s, newly increased soil and water conservation areas in the basin were composed of 2907 km2 of terrace land, 4773 km2of afforestation land, 1146 km2of grassland and 52 km2of dammed land. These soil conserva-tion practices intercept precipitaconserva-tion, change local character-istics, improve the infiltration rate of water flow, slow down or retain the streamflow, and consequently delay or even re-duce streamflow. Additionally, during the past few decades, there were dramatic increases in the population and the ir-rigated area in the study area, which could have resulted in increased water withdrawal from the river. The evaluation of the individual effects on the hydrological regime still poses a challenge for hydrologists.
6 Conclusions
This paper investigated the impact of human activities and climate variability on streamflow using observed data and three methods (an elasticity-based method, a calibrated TOP-MODEL, and a VIC model) for the JRB in China.
1. The variability of streamflow, precipitation, potential evaporation, and temperature in the JRB was analyzed. The annual precipitation and streamflow both showed a statistically decreasing trend, while the streamflow had a larger decrease, and the decrease in speed was higher since 1990. The potential evaporation presented an
in-significant increasing trend; however, the temperature had a significant increasing trend.
2. The precipitation elasticity (εP)and evapotranspiration elasticity (εE0)of streamflow for different periods were calculated using the Budyko formulation of Fu. The results indicated that a 10 % decrease in precipitation would result in a 14.8 % drop in streamflow, while a 10 % decrease in potential evapotranspiration would in-duce a 4.8 % increase of streamflow.
3. Compared to the baseline period of 1960 to 1970, streamflow in the JRB greatly decreased during 2001– 2010. Climate variability and human activities impacts from the hydrological models were similar to those from the elasticity-based method.
4. The maximum contribution value of human activities appeared in 1981–1990 due to the effects of soil and water conservation measures and water withdrawal for industry and agricultural water demand, whereas cli-mate variability made the greatest contributions to the streamflow reduction in 1991–2000. The contribution ratios of human activities and climate variability were 99 and 40.4 % when averaged over the three methods.
Acknowledgements. This research was supported by the Natural
Science Foundation of China (51190093) and Key Innovation Group of Science and Technology of Shaanxi (2012KCT-10). Sincere gratitude is extended to the editor and the anonymous reviewers for their professional comments and corrections.
Edited by: F. Tian
References
Arora, V. K.: The use of the aridity index to assess climate change effect on annual runoff, J. Hydrol., 265, 164–177, 2002. Bao, Z., Zhang, J., Wang, G., Fu, G., He, R., Yan, X., Jin,
J., Liu, Y., and Zhang, A.: Attribution for decreasing stream-flow of the Haihe River basin, northern China: Climate vari-ability or human activities, J. Hydrol., 460–461, 117–129, doi:10.1016/j.jhydrol.2012.06.054, 2012.
Beven, K. J. and Kirkby, M. J.: A physically based variable con-tributing area model of basin hydrology, Hydrological Sciences Bulletin, 24, 43–69, 1979.
Boston, T., Xia, J., and Zhu, Y.: Pre-processing rainfall data from multiple gauges to improve TOPMODEL simulation results in a large semi-arid region, Hydrol. Process., 18, 2313–2325, doi:10.1002/hyp.5530, 2004.
Chang, F.-J., Chang, L.-C., Kao, H.-S., and Wu, G.-R.: Assessing the effort of meteorological variables for evaporation estimation by self-organizing map neural network, J. Hydrol., 384, 118–129, 2010.
Chen, J. and Wu, Y.: Advancing representation of hydro-logic processes in the Soil and Water Assessment Tool (SWAT) through integration of the TOPographic MODEL (TOPMODEL) features, J. Hydrol., 420–421, 319–328, doi:10.1016/j.jhydrol.2011.12.022, 2012.
Chien, H., Yeh, P. J.-F., and Knouft, J. H.: Modeling the potential impacts of climate change on streamflow in agricultural water-sheds of the Midwestern United States, J. Hydrol., 491, 73–88, doi:10.1016/j.jhydrol.2013.03.026, 2013.
Chiew, F. H. S.: Estimation of rainfall elasticity of streamflow in Australia, Hydrolog. Sci. J., 51, 613–625, 2006.
Destouni, G., Jaramillo, F., and Prieto, C.: Hydroclimatic shifts driven by human water use for food and energy production, Nat. Clim. Change., 3, 213–217, doi:10.1038/nclimate1719, 2013. Donohue, R. J., Roderick, M. L., and McVicar, T. R.: On the
impor-tance of including vegetation dynamics in Budyko’s hydrological model, Hydrol. Earth Syst. Sci., 11, 983–995, doi:10.5194/hess-11-983-2007, 2007.
Donohue, R. J., Roderick, M. L., and McVicar, T. R.: Assess-ing the differences in sensitivities of runoff to changes in cli-matic conditions across a large basin, J. Hydrol., 406, 234–244, doi:10.1016/j.jhydrol.2011.07.003, 2011.
Dooge, J. C., Bruen, M., and Parmentier, B.: A simple model for estimating the sensitivity of runoff to long-term changes in pre-cipitation without a change in vegetation, Adv. Water Resour., 23, 153–163, 1999.
Du, J. and Shi, C.: Effects of climate factors and human activities on runoff of the Weihe River in recent decades, Quatern. Int., 282, 58–65, 2012.
Fu, B. P.: On the calculation of the evaporation from land surface, Chinese Journal of Atmospheric Sciences, 5, 23–31, 1981. Fu, B. P.: On the calculation of evaporation from land surface in
mountainous areas, Scientia Meteorologica Sinica, 6, 328–335, 1996.
Fu, G., Charles, S. P., and Chiew, F. S. H.: A two-parameter cli-mate elasticity of streamflow index to assess clicli-mate change ef-fects on annual streamflow, Water Resour. Res. 43, W11419, doi:10.1029/2007WR005890, 2007.
Furusho, C., Chancibault, K., and Andrieu, H.: Adapting the cou-pled hydrological model ISBA-TOPMODEL to the long-term hydrological cycles of suburban rivers: evaluation and sensitiv-ity analysis, J. Hydrol., 485, 139–147, 2013.
Gao, H., Bohn, T. J., Podest, E., McDonald, K. C., and Lettenmaier, D. P.: On the causes of the shrinking of lake Chad, Environ. Res. Lett., 6, 034021, doi:10.1088/1748-9326/6/3/034021, 2011. Gao, P., Geissen, V., Ritsema, C. J., Mu, X.-M., and Wang, F.:
Im-pact of climate change and anthropogenic activities on stream flow and sediment discharge in the Wei River basin, China, Hy-drol. Earth Syst. Sci., 17, 961–972, doi:10.5194/hess-17-961-2013, 2013.
Grimson, R., Montroull, N., Saurral, R., Vasquez, P., and Camilloni, I.: Hydrological modelling of the Iberá Wet-lands in southeastern South America, J. Hydrol., 503, 47–54, doi:10.1016/j.jhydrol.2013.08.042, 2013.
Gumindoga, W., Rientjes, T. H. M., Haile, A. T., and Dube, T.: Pre-dicting streamflow for land cover changes in the Upper Gilgel Abay River Basin, Ethiopia: a TOPMODEL based approach, Phys. Chem. Earth, 76–78, 3–15, 2014.
Hamed, K. H.: Trend detection in hydrologic data: the Mann– Kendall trend test under the scaling hypothesis, J. Hydrol. 349, 350–363, 2008.
Li, D., Pan, M, Cong, Z., and Wood, E.: Vegetation control on water and energy balance within the Budyko framework, Water Resour. Res. 49, 969–976, doi:10.1002/wrcr.20107, 2013.
Li, H., Zhang, Y., Vaze, J., and Wang, B.: Separating effects of veg-etation change and climate variability using hydrological mod-elling and sensitivity-based approaches, J. Hydrol., 420–421, 403–418, 2012.
Liang, X., Lettenmaier, D. P., Wood, E. F., and Burges, S. J.: A sim-ple hydrologically based model of land surface water and energy fluxes for GSMs, J. Geophys. Res., 99, 415–428, 1994. Lin, S.-H., Liu, C.-M., Huang, W.-C., Lin, S.-S., Yen, T.-H., Wang,
H.-R., Kuo, J.-T., and Lee, Y. C.: Developing a yearly warning index to assess the climatic impact on the water resources of Tai-wan, a complex-terrain island, J. Hydrol., 390, 13–22, 2010. Liu, H., Tian, F., Hu, H. C., Hu, H. P., and Sivapalan, M.: Soil
mois-ture controls on patterns of grass green-up in Inner Mongolia: an index based approach, Hydrol. Earth Syst. Sci., 17, 805–815, doi:10.5194/hess-17-805-2013, 2013.
Liu, Q., Yang, Z., Cui, B., and Sun, T.: Temporal trends of hydro-climatic variables and runoff response to hydro-climatic variability and vegetation changes in the Yiluo River basin, China, Hydrol. Pro-cess., 23, 3030–3039, 2009.
Ma, H., Yang, D., Tan, S. K., Gao, B., and Fu, Q.: Impact of cli-mate variability and human activity on streamflow decrease in the Miyun Reservoir catchment, J. Hydrol., 389, 317–324, 2010. Milly, P. C. D.: An analytic solution of the stochastic storage prob-lem applicable to soil water, Water Resource Res., 29, 3755– 3758, 1993.
Milly, P. C. D. and Dunne, K. A.: Macroscale water fluxes 2. Water and energy supply control of their inter-annual variability, Water Resour. Res., 38, 241–249, 2002.
Notebaert, B., Verstraeten, G., Ward, P., Renssen, H., and Van Rompaey, A.: Modeling the sensitivity of sediment and water runoff dynamics to Holocene climate and land use changes at the catchment scale, Geomorphology, 126, 18–31, 2011. Peng D. Z. and Xu, Z. X.: Simulating the impact of climate change
on streamflow in the Tarim River basin by using a modified semi-distributed monthly water balance model, Hydrol. Process. 24, 209–216, doi:10.1002/hyp.7485, 2010.
Petchprayoon, P., Blanken, P. D., Ekkawatpanit, C., and Husseinc, K.: Hydrological impacts of land use/land cover change in a large river basin in central–northern Thailand, Int. J. Climatol., 30, 1917–1930, 2010.
Potter, N. J. and Chiew, F. H. S.: An investigation into changes in climate characteristics causing the recent very low runoff in the southern Murray– Darling Basin using rainfall–runoff models, Water Resour. Res., 47, W00G10, doi:10.1029/2010WR010333, 2011.
Renner, M., Seppelt, R., and Bernhofer, C.: Evaluation of water-energy balance frameworks to predict the sensitivity of stream-flow to climate change, Hydrol. Earth Syst. Sci., 16, 1419–1433, doi:10.5194/hess-16-1419-2012, 2012.
Roudier, P., Ducharne, A., and Feyen, L.: Climate change impacts on runoff in West Africa: a review, Hydrol. Earth Syst. Sci., 18, 2789–2801, doi:10.5194/hess-18-2789-2014, 2014.
Sankarasubramanian, A., Vogel, R. M., and Limbrunner, J. F.: Cli-mate elasticity of streamflow in the United States, Water Resour. Res., 37, 1771–1781, 2001.
Scanlon, B. R., Jolly, I., Sophocleous, M., and Zhang, L.: Global impacts of conversion from natural to agricultural ecosystem on water resources: quantity versus quality, Water Resour. Res., 43, W03437, doi:10.1029/2006WR005486, 2007.
Schaake, J. C.: From climate to flow, in: Climate Change and U.S. Water Resources, edited by: Waggoner, P. E., John Wiley, New York, USA, 177–206, 1990.
Seibert, J., Bishop, K. H., and Nyberg, L.: A test of TOPMODEL’s ability to predict spatially distributed groundwater levels, Hydrol. Process. 11, 1131–1144, 1997.
Shi, C., Zhou, Y., Fan, X., and Shao, W.: A study on the annual runoff change and its relationship with water and soil conser-vation practices and climate change in the middle Yellow River basin, Catena, 100, 31–41, 2013.
Su, F. and Xie, Z.: A model for assessing effects of climate change on runoff of China, Prog. Nat. Sci., 13, 701–707, 2003. Sun, Y., Tian, F., Yang, L, and Hu, H.: Exploring the spatial
variabil-ity of contributions from climate variation and change in catch-ment properties to streamflow decrease in a mesoscale basin by three different methods, J. Hydrol., 508, 170–180, 2014. Tang, Y., Tang, Q., Tian, F., Zhang, Z., and Liu, G.: Responses
of natural runoff to recent climatic variations in the Yellow River basin, China, Hydrol. Earth Syst. Sci., 17, 4471–4480, doi:10.5194/hess-17-4471-2013, 2013.
Teng, J., Vaze, J., Chiew, F. H. S., Wang, B., and Perraud, J. M.: Es-timating the relative uncertainties sourced from GCMs and hy-drological models in modelling climate change impact on runoff, J. Hydrometeorol., 13, 122–139, 2012.
Tesfa, T. K., Li, H.-Y., Leung, L. R., Huang, M., Ke, Y., Sun, Y., and Liu, Y.: A subbasin-based framework to represent land surface processes in an Earth system model, Geosci. Model Dev., 7, 947– 963, doi:10.5194/gmd-7-947-2014, 2014.
Tomer, M. D. and Schilling, K. E.: A simple approach to distinguish land-use and climate-change effects on watershed hydrology, J. Hydrol., 376, 24–33, 2009.
Tuteja, N. K., Vaze, J., Teng, J., and Mutendeudzi, M.: Partitioning the effects of pine plantations and climate variability on runoff from a large catchment in southeastern Australia, Water Resour. Res., 43, 199–212, doi:10.1029/2006WR005016, 2007. Van Lill, W. S., Kruger, F. J., and Van Wyk, D. B.: The effect of
afforestation with Eucalyptus Grandis Hill ex Maiden and Pi-nus Patula Schlecht. et Cham. On streamflow from experimental catchments at Mokobulaan, Transvaal, J. Hydrol., 48, 107–118, 1980.
Wang, D. and Hejazi, M.: Quantifying the relative contribution of the climate and direct human impacts on mean annual streamflow in the contiguous United States, Water Resour. Res., 47, W00J12, doi:10.1029/2001wr000760, 2011.
Wang, D., Hagen, S. C., and Alizad, K.: Climate change im-pact and uncertainty analysis of extreme rainfall events in the Apalachicola River basin, Florida, J. Hydrol., 480, 125–135, 2013.
Wang, D. B., Zhao, J. S., Tang, Y., and Sivapalan, M.: A ther-modynamic interpretation of Budyko and L’vovich formulations of annual water balance: Proportionality Hypothesis and max-imum entropy production, Water Resour. Res., 51, 3007–3016, doi:10.1002/2014WR016857, 2015
Wang, J. H., Hong, Y., Gourley, J., Adhikari, P., Li, L., and Su, F. G.: Quantitative assessment of climate change and human impacts on long-term hydrologic response: a case study in a sub-basin of the Yellow River. China, Int. J. Climatol., 30, 2130–2137, doi:10.1002/joc.2023, 2010.
Ward, P. J., van Balen, R. T., Verstraeten, G., Renssen, H., and Van-denberghe, J.: The impact of land use and climate change on late Holocene and future suspended sediment yield of the Meuse catchment, Geomorphology, 103, 389–400, 2009.
Willmott, C. J. and Feddema, J. J.: A more rational climatic moisture index, Prof. Geogr., 44, 84–88, doi:10.1111/j.0033-0124.1992.00084.x, 1992.
Willmott, C. J., Robeson, S. M., and Feddema, J. J.: Influence of spatially variable instrument networks on climatic averages, Geophys. Res. Lett., 18, 2249–2251, 1991.
Xiong, L. and Guo, S.: Effects of the catchment runoff coefficient on the performance of TOPMODEL in rainfall–runoff modelling, Hydrol. Process., 8, 1823–1836, doi:10.1002/hyp.1449, 2004. Xu, X., Yang, H., Yang, D., and Ma, H.: Assessing the impacts
of climate variability and human activities on annual runoff in the Luan River Basin, China, Hydrol. Res., 44, 940–952, doi:10.2166/nh.2013.144, 2013.
Yang, D., Li, C., Hu, H., Lei, Z., Yang, S., Kusuda, T., Koike, T., and Musiake, K.: Analysis of water resources variabil-ity in the Yellow River of China during the last half cen-tury using historical data[J], Water Resour. Res., 40, 308–322, doi:10.1029/2003WR002763, 2004.
Yang, H., Yang, D., Lei, Z., and Sun, F., New analytical derivation of the mean annual water-energy balance equation, Water Resour. Res., 44, W034103, doi:10.1029/2007WR006135, 2008. Zhan, C. S., Jiang, S. S., Sun, F. B., Jia, Y. W., Niu, C. W., and
Yue, W. F.: Quantitative contribution of climate change and hu-man activities to runoff changes in the Wei River basin, China, Hydrol. Earth Syst. Sci., 18, 3069–3077, doi:10.5194/hess-18-3069-2014, 2014.
Zhang, C., Peng, Y., Chu, J., Shoemaker, C. A., and Zhang, A.: Integrated hydrological modelling of small- and medium-sized water storages with application to the upper Fengman Reser-voir Basin of China, Hydrol. Earth Syst. Sci., 16, 4033–4047, doi:10.5194/hess-16-4033-2012, 2012.
Zhang, L., Dawes, W. R., and Walker, G. R.: Response of mean an-nual evapotranspiration to vegetation changes at catchment scale, Water Resour. Res., 37, 701–708, 2001.
Zhang, X., Zhang, L., Zhao, J., Rustomji, P., and Hairsine, P.: Re-sponses of streamflow to changes in climate and land use/cover in the Loess Plateau, China, Water Resour. Res., 44, W00A07, doi:10.1029/2007WR006711, 2008.