ORIGINAL RESEARCH
Normal-Appearing White Matter Changes Vary
with Distance to Lesions in Multiple Sclerosis
H. Vrenken J.J.G. Geurts D.L. Knol C.H. Polman J.A. Castelijns P.J.W. Pouwels F. Barkhof
BACKGROUND AND PURPOSE:Multiple sclerosis (MS) disease processes in normal-appearing white matter (NAWM) may be different close to MR-visible lesions than farther from these lesions. We aimed to investigate the relationship of NAWM changes to the distance to the lesions.
METHODS: We measured B1-corrected T1 and magnetization transfer ratio (MTR) maps in 63 patients with MS (11 primary progressive, 34 relapsing-remitting, 18 secondary progressive). We used histo-gram analyses to assess the global properties of lesions, of 4 consecutive 1-mm pixel layers of NAWM around the lesions, and of distant NAWM located at least 4-mm from lesions in all directions. In 22 healthy controls, we measured white matter MTR and T1 histograms. Histogram parameters were statistically analyzed by using a linear mixed model.
RESULTS: The first and second NAWM pixel layers around the lesions had a significantly lower MTR histogram peak position than distant NAWM, whereas T1 histogram peak position was similar between all types of NAWM. Furthermore, MTR histograms of distant NAWM were statistically indistinguishable from those of control white matter, whereas T1 histograms of distant NAWM had significantly decreased peak height for relapsing-remitting MS and secondary progressive MS and significantly increased peak position for secondary progressive MS.
CONCLUSION:Our results may suggest that axonal damage and demyelination in NAWM mainly arise as a secondary result of visible lesions, with the largest effect close to these lesions. NAWM disease farther from the lesions may be mainly characterized by subtle blood-brain barrier damage, with leakage of fibrinogen into the parenchyma and microplaque formation, processes that are detected with T1 but not with MTR.
M
ultiple sclerosis (MS) is an inflammatory demyelinating disease of the central nervous system, typically charac-terized by lesions in the white matter that can be visualized by using MR imaging. Because the correlations between MR-vis-ible lesion volumes and clinical disability measures are only moderate, much attention has been paid in recent years to the normal-appearing white matter (NAWM). Several quantita-tive MR techniques have been used, including measurements of T1 relaxation times and of the magnetization transfer ratio (MTR). Increases of T1 relaxation times have been demon-strated in NAWM, both in regional and global analyses. Glo-bally, substantial T1 histogram changes have been observed in MS that suggest that large parts of NAWM are affected by the disease,1,2whereas regional analyses have reported increasedT1 in NAWM in many parts of the cerebrum.2-4However, the
histopathologic substrate of these T1 increases remains un-known.5MTR has been found to be decreased in MS NAWM
in vivo in regional3,6,7and global analyses,8-11though the MTR histogram changes appear to be smaller than those for T1, consisting mainly of an increase of the height of the low-MTR tail of the histogram, whereas T1 histogram changes appear also to involve a shift of the histogram peak. Combined
MR-histopathologic studies suggest that decreased MTR reflects demyelination and/or axonal damage or loss.5,12
Global properties of both MTR and T1 in NAWM are cor-related with clinical disability measures,13-15in part
indepen-dently of MR-visible lesions.16Compatible with this finding,
correlations of T1 and MTR histogram parameters of NAWM with MR-visible lesion volumes are at best moderate.1,17,18
The relationship of MS NAWM changes to the visible lesions remains unclear.
The histogram changes found for MTR in MS NAWM ap-pear to be smaller than those found for T1, suggesting that the MTR changes involve a smaller fraction of MS NAWM than the T1 changes. The differences in spatial heterogeneity be-tween the MTR and T1 changes in MS NAWM may well result from different relationships to the MR-visible lesions. Specif-ically, the question arises whether NAWM close to MR-visible lesions (perilesional NAWM) differs from NAWM remote from MR-visible lesions (distant NAWM), as has been sug-gested.19Relatively few studies have addressed this issue in
vivo. A difference between perilesional and distant NAWM has been demonstrated concerning MTR, especially in pa-tients with progressive MS.6Another study demonstrated
dif-ferences in T1 relaxation times between lesions, NAWM sur-rounding lesions, and NAWM distant from lesions, by using a region-of-interest approach.20
This study aimed to systematically explore T1 and MTR histograms of NAWM progressively farther from MS lesions in a relatively large number of patients. Specifically, we inves-tigated whether NAWM in 4 consecutive perilesional layers around lesions differs from distant NAWM, how both types of NAWM compare with control white matter, whether the his-togram parameters differ between different clinical types of Received September 19, 2005; accepted after revision January 24, 2006.
From the Departments of Radiology (H.V., J.J.G.G., J.A.C., F.B.), Clinical Epidemiology and Biostatistics (D.L.K.), Neurology (C.H.P.), and Physics and Medical Technology (P.J.W.P.), MR Center for MS Research, VU University Medical Center, Amsterdam, the Netherlands.
The VU University Center for MS Research is supported by the Dutch MS Research Foundation, Voorschoten, the Netherlands. H. Vrenken (grant 98-371 MS) and J.J.G. Geurts (grant 00 – 427 MS) are also supported by the Dutch MS Research Foundation, Voorschoten, the Netherlands.
Please address correspondence to H. Vrenken, PhD, VU University Medical Center, De-partment of Radiology, De Boelelaan 1117, 1081 HV Amsterdam, the Netherlands; e-mail: [email protected]
BRAIN
ORIGINAL
MS, and how the changes in the different types of NAWM relate to clinical disability.
Subjects and Methods
Subjects
Sixty-three patients with clinically definite MS21and 22 healthy
con-trols without neurologic disease were included in the study. Inclusion criteria were age between 18 and 70 years, and for the patients with MS, no recent disease activity (relapse within the previous 4 weeks). Of the patients with MS, 11 had primary progressive MS, 34 had relapsing-remitting MS, and 18 had secondary progressive MS. Sub-ject group characteristics are listed in Table 1. Of the patients with relapsing-remitting MS, 15 (44%) were under treatment with inter-feron beta. No patients used other disease-modifying treatments. The research protocol was approved by the institutional ethics review board, and all subjects gave written informed consent. The patients with MS were subjected to a neurologic examination in which Ex-panded Disability Status Scale (EDSS)22and Multiple Sclerosis
Func-tional Composite (MSFC)23scores were determined.
MR Imaging Protocol
All MR imaging was performed on a Magnetom Vision scanner op-erating at 1.5T (Siemens, Erlangen, Germany). In a single session, conventional images and images for mapping of T1, MTR, and B1
were acquired. Conventional images were oblique axial dual-echo fast spin-echo proton density (Pd)/T2-weighted images (TR/TE1/TE2, 2625/16/98 ms; number of excitations [NEX], 2), acquired in 2 inter-leaved sets of 16 sections (section thickness, 4 mm; field of view [FOV], 256 mm; in-plane resolution, 1⫻1 mm2). For T1-mapping,
6 sets of 3D fast low-angle shot (FLASH) images (TR/TE, 20/4 ms; NEX, 1) were acquired covering the same volume as the Pd/T2-weighted images, also with section thickness, 4 mm; FOV, 256 mm; and in-plane resolution, 1⫻1 mm2. Nominal flip angles were 2°, 5°,
10°, 15°, 20°, and 25°, respectively, for the 6 series. For MTR mapping, 2 sets of 3D FLASH images (TR/TE, 27/4 ms; flip angle, 20°; NEX, 2), again with section thickness, 4 mm; FOV, 256 mm; and in-plane resolution, 1⫻1 mm2, were acquired, 1 with a gaussian MT-prepulse
(duration, 7.68 ms; offset, 1500 Hz; effective flip angle, 500°) and 1 without. For B1mapping, 5 additional sets of 3D FLASH images (TR/ TE, 25/5 ms; NEX, 1) were acquired with a 200-mm sagittal 3D slab completely enclosing the head, 4-mm section thickness, 2⫻2 mm2
in-plane resolution, and nominal flip angles of 140°, 160°, 180°, 200°, and 220°.
T1 and MTR Calculations
Following the method described by Venkatesan et al,24pixel-by-pixel
T1 calculations were performed with B1correction. First, B1maps
were generated from the 5-image series with nominal flip angles be-tween 140° and 220° by determining, after spatial smoothing to in-crease the signal-to-noise ratio, for each pixel the ratio between the actual and nominal flip angle. The 6-image series with flip angles between 2° and 25° were coregistered by using linear image registra-tion,25and then T1 was determined for each pixel through a nonlinear
least squares fit by using the resliced B1map.24The 2 sets of images
with and without MT prepulse were coregistered, and then MTR was calculated for each pixel as the relative signal intensity decrease due to the application of the magnetization transfer prepulse. A post hoc correction for B1-induced variation was applied as described by
Ropele et al.26
First the relation between MTR and B1was derived for
NAWM (identified by using the procedure described in this article), and then this result was generalized to calculate a B1-corrected MTR
value for all pixels in the image.
Identification of Seven Tissue Classes
The voxels used in both the MTR and T1 measurements were far from isotropic, with in-plane pixels of 1⫻1 mm2and 4-mm section
thick-ness. It was, therefore, not possible with this dataset to investigate NAWM in consecutive layers around lesions in 3D. Therefore, we considered layers of NAWM that were defined in-plane. For both the MTR and T1 measurements, we wanted to avoid any unnecessary data manipulation through coregistration, so MTR and T1 maps were separately investigated, each in their original domain. The following procedure was, therefore, carried out twice, once for the T1 analysis and once for the MTR analysis, leading to small differences between the 2 analyses in the numbers of pixels in each class.
First, all MR-visible lesions (both focal and diffuse) were outlined by an experienced observer on the fast spin-echo Pd/T2-weighted images, and from these, the total cerebral lesion volume—referred to as “lesion load”—was calculated. The lesion masks were then trans-ferred to the T1 and MTR maps by using linear image registration. We used a trilinear interpolation that marked T1 and MTR map pixels as lesion pixels if there was a contribution of 1% or more of a pixel marked as a lesion pixel on the fast spin-echo Pd/T2-weighted images. In other words, only if the lesion contribution was⬍1%, pixels were not marked as lesion pixels. This conservative approach ensured that all T1 and MTR map pixels not marked as lesions were at least 99% free of overlap with the lesion masks drawn on the fast spin-echo Pd/T2-weighted images. This introduces some heterogeneity in the lesion pixels because of the inclusion of pixels that contain mostly nonlesional tissue, but it ensures that pixels around the overestimated lesion masks do not accidentally contain visible lesions. The NAWM pixels defined in the next steps are thus each at least 99% free of marked lesions.
[image:2.585.54.532.62.153.2]Secondly, a NAWM mask was constructed by skull-stripping27
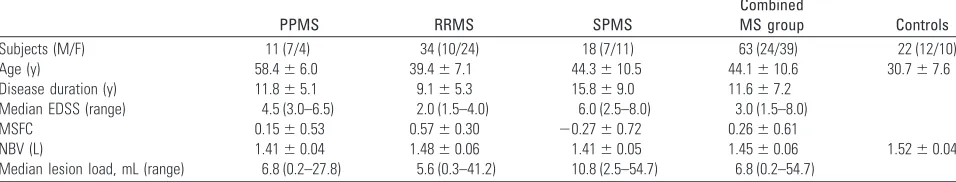
Table 1: Subject group characteristics
PPMS RRMS SPMS
Combined
MS group Controls
Subjects (M/F) 11 (7/4) 34 (10/24) 18 (7/11) 63 (24/39) 22 (12/10) Age (y) 58.4⫾6.0 39.4⫾7.1 44.3⫾10.5 44.1⫾10.6 30.7⫾7.6 Disease duration (y) 11.8⫾5.1 9.1⫾5.3 15.8⫾9.0 11.6⫾7.2
Median EDSS (range) 4.5 (3.0–6.5) 2.0 (1.5–4.0) 6.0 (2.5–8.0) 3.0 (1.5–8.0) MSFC 0.15⫾0.53 0.57⫾0.30 ⫺0.27⫾0.72 0.26⫾0.61
NBV (L) 1.41⫾0.04 1.48⫾0.06 1.41⫾0.05 1.45⫾0.06 1.52⫾0.04 Median lesion load, mL (range) 6.8 (0.2–27.8) 5.6 (0.3–41.2) 10.8 (2.5–54.7) 6.8 (0.2–54.7)
T1-weighted 3D FLASH images, segmenting white matter by using an automated segmentation algorithm,28eroding the white matter mask
in-plane by 2 pixel layers to avoid partial volume effects at tissue boundaries, and subtracting the (conservatively) coregistered lesion masks. Because of poor segmentation in deep gray matter regions, a mask including deep gray matter and the lateral ventricles was man-ually drawn for each subject to remove these structures to ensure that no non-NAWM pixels could enter the analysis. Infratentorial tissue and remaining nonbrain tissue were also manually removed to obtain cerebral NAWM masks.
Using the cerebral NAWM masks and the (conservatively) coreg-istered lesion masks, we then defined 7 mutually exclusive pixel classes by using the following procedure: Through in-plane erosion by 1 pixel layer, the coregistered lesion masks were subdivided into the 2 pixel classes: “lesion rim,” which contains the outer pixel layer of each lesion marking, and “lesion core,” which contains the remaining central part.
Four consecutive in-plane pixel layers of NAWM around the le-sion masks were then constructed. This was done by in-plane dilation, each time by 1 pixel layer, and checking each pixel against the NAWM mask to prevent inclusion of non-NAWM pixels. The 4 classes of NAWM pixels in consecutive pixel layers around lesions thus defined were labeled “layer 1” through “layer 4”.
Finally, the seventh and last pixel class, “distant NAWM,” was defined by removing the pixels in the previous 6 pixel classes from the NAWM mask and additionally removing all pixels that were above or below pixels belonging to 1 of these 6 pixel classes (through-plane). This last step ensured that all pixels in the class distant NAWM were removed at least 4 mm from the conservatively coregistered lesion masks in all directions.
As indicated previously, the procedure just described was per-formed twice, once for the T1 maps and once for the MTR maps. Figure 1 illustrates how the 7 pixel classes were defined for a sample patient. The mean numbers of pixels in each class were the following: lesion core, 2164; lesion rim, 3466; layer 1, 1597; layer 2, 1675; layer 3, 1709; layer 4, 1712; distant NAWM, 22670.
Controls, Histograms, and Brain Volume
For the controls, white matter masks were generated through auto-mated segmentation as described previously, followed by in-plane erosion by 2 pixel layers to minimize partial volume effects at tissue boundaries.
For each patient, MTR and T1 histograms were generated for each of the 7 pixel classes, with bin sizes of 0.1% for MTR and 1 millisecond for T1. For the controls, MTR and T1 histograms were generated by using the white matter mask. The histograms were normalized to the total pixel count, smoothed, and characterized by 2 parameters: peak position and peak height. For each subject, the normalized brain vol-ume was calculated by using an automated procedure with manual editing.29
Statistical Analysis
All statistical analyses were performed by using SPSS for Windows, version 12.0 (SPSS, Chicago, Ill 2003). In the main analysis, the prop-erties of the 7 pixel classes were analyzed for the patients with MS only. Four separate models were constructed, 1 for each of the histo-gram parameters (peak position and peak height) of MTR and T1. A general linear mixed model was used with the 7 pixel classes nested within patients and an unstructured covariance matrix. The model further contained disease type (primary progressive,
relapsing-remit-ting, or secondary progressive MS), and subject age. We performed pairwise comparisons between pixel classes, as well as pairwise com-parisons between disease types, all with Bonferroni correction for multiple comparisons.
In addition to the main analysis, we performed comparisons with control white matter. The T1 and MTR histogram parameters of the 7 pixel classes were compared with the corresponding white matter histogram parameter of the controls. The same models were used, but this time with the controls as an additional diagnostic category, with data for only 1 pixel class for the controls. For the histogram param-eters of all pixel classes, Bonferroni-corrected pairwise comparisons were performed between each MS disease type and controls, as well as an overall comparison of MS versus controls by averaging over the 3 MS disease types. Values are reported as mean⫾SD unless indicated otherwise. Bonferroni-correctedP⬍.05 was considered statistically significant.
For the histogram parameters of layer 1 through layer 4 and dis-tant NAWM, correlations with lesion load and with the EDSS score were explored by using the Spearman rank correlation coefficient (). Correlations with normalized brain volume, disease duration, and MSFC score were investigated by using the Pearson correlation coef-ficient (r). All correlations were assessed in the combined MS group. Because of the large number of correlations, only those withP⬍.001 were considered significant.
Results
[image:3.585.302.535.43.263.2]for each of the 7 pixel classes and the white matter histogram parameters for the control group. The results of statistical comparisons are indicated in Table 2. There were no signifi-cant interactions for any combination of subject age, disease type, and pixel class, so these were all excluded from the models.
Peak Positions
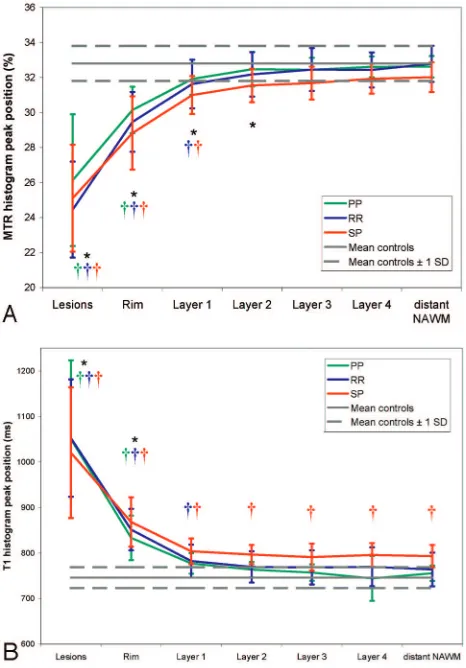
Figure 2 graphically displays the results for MTR and T1 his-togram peak position. As expected, the MTR and T1 peak position of the pixel classes, lesion core, and lesion rim, were highly significantly different from those of control white mat-ter; and with increasing distance to the MR-visible lesions, the T1 peak position decreased and the MTR peak position increased.
Both for T1 peak position and MTR peak position, the 4 perilesional NAWM layers (layer 1 through layer 4) were not statistically significantly different from each other. In the com-parison of the perilesional NAWM layers with distant NAWM, independent of disease type, MTR and T1 peak position showed different behavior. The perilesional layers 1 through 4 were not significantly different from distant NAWM regard-ing T1 peak position, but MTR peak position was significantly higher in distant NAWM than in the perilesional layers 1 and 2, with Bonferroni-correctedP⬍.001 for layer 1 andP⫽.033 for layer 2.
The additional comparison of peak positions with those of control white matter also showed a difference between the results for MTR and T1 peak position. T1 peak position was significantly increased in secondary progressive MS compared with that of control white matter in all 4 layers, whereas MTR peak position was significantly decreased compared with that
of controls only in layer 1 (P⫽.008 for relapsing-remitting MS,P⫽.004 for secondary progressive MS, andP⫽.014 averaged over disease types). For distant NAWM, T1 peak position was significantly higher in secondary progressive MS than in controls (Bonferroni-correctedP⫽.016), but MTR peak position was not significantly different from controls (Bonferroni-correctedP⫽1).
Peak Heights
Lesion core and lesion rim had significantly lower MTR and T1 peak heights compared with those of control white matter and compared with those of all classes of NAWM. The 4 peri-lesional NAWM layers were not significantly different from each other in terms of either T1 or MTR peak height. However, MTR and T1 peak heights were significantly lower for distant NAWM compared with the perilesional layers, with all Bon-ferroni-correctedP⬍.007 for T1 peak height andPbetween .002 (layer 2) and .022 (layer 1) for MTR peak height. Com-pared with control white matter, distant NAWM was not sig-nificantly different in terms of MTR peak height, but T1 peak height of distant NAWM was significantly reduced in relaps-ing-remitting MS (P⫽.002), in secondary progressive MS (P⫽.0001), and averaged over disease types (P⫽.003). MTR peak height was further significantly increased in relapsing-remitting MS compared with that of control white matter in layers 2, 3, and 4 (Pbetween .013 and .023).
Relationship of NAWM Histogram Parameters with Clinical Status and MR-Visible Lesions
[image:4.585.53.532.68.326.2]There were no statistically significant differences between MS disease types. Although there were trends toward a correlation of the EDSS score with T1 peak height of perilesional NAWM
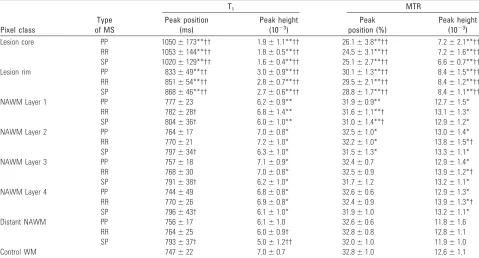
Table 2: Magnetization transfer ratio (MTR) and T1histogram parameters of lesion and normal-appearing white matter (NAWM) pixel classes
and of control white matter (WM)
Pixel class
Type of MS
T1 MTR
Peak position (ms)
Peak height (10⫺3)
Peak position (%)
Peak height (10⫺3)
Lesion core PP 1050⫾173**†† 1.9⫾1.1**†† 26.1⫾3.8**†† 7.2⫾2.1**†† RR 1053⫾144**†† 1.8⫾0.5**†† 24.5⫾3.1**†† 7.2⫾1.6**†† SP 1020⫾129**†† 1.6⫾0.4**†† 25.1⫾2.7**†† 6.6⫾0.7**†† Lesion rim PP 833⫾49**†† 3.0⫾0.9**†† 30.1⫾1.3**†† 8.4⫾1.5**†† RR 851⫾54**†† 2.8⫾0.7**†† 29.5⫾2.1**†† 8.4⫾1.2**†† SP 868⫾46**†† 2.7⫾0.6**†† 28.8⫾1.7**†† 8.4⫾1.1**†† NAWM Layer 1 PP 777⫾23 6.2⫾0.9** 31.9⫾0.9** 12.7⫾1.5*
RR 782⫾28† 6.8⫾1.4** 31.6⫾1.1**† 13.1⫾1.3* SP 804⫾36† 6.0⫾1.0** 31.0⫾1.4**† 12.9⫾1.2* NAWM Layer 2 PP 764⫾17 7.0⫾0.8* 32.5⫾1.0* 13.0⫾1.4* RR 770⫾21 7.2⫾1.0* 32.2⫾1.0* 13.8⫾1.5*† SP 797⫾34† 6.3⫾1.0* 31.5⫾1.3* 13.3⫾1.1* NAWM Layer 3 PP 757⫾18 7.1⫾0.9* 32.4⫾0.7 12.9⫾1.4* RR 768⫾30 7.0⫾0.8* 32.5⫾0.9 13.9⫾1.2*† SP 791⫾38† 6.2⫾1.0* 31.7⫾1.2 13.2⫾1.1* NAWM Layer 4 PP 744⫾49 6.8⫾0.8* 32.6⫾0.6 12.9⫾1.3* RR 770⫾26 6.9⫾0.8* 32.4⫾0.9 13.9⫾1.3*† SP 796⫾43† 6.1⫾1.0* 31.9⫾1.0 13.2⫾1.1* Distant NAWM PP 756⫾17 6.1⫾1.0 32.6⫾0.6 11.8⫾1.6
RR 764⫾25 6.0⫾0.9† 32.8⫾0.8 12.8⫾1.1 SP 793⫾37† 5.0⫾1.2†† 32.0⫾1.0 11.9⫾1.0 Control WM 747⫾22 7.0⫾0.7 32.8⫾1.0 12.6⫾1.1
Note:—Values are observed means and SDs. Symbols indicate statistically significant differences: *P⬍.05, **P⬍.001 versus distant NAWM, †P⬍.05, ††P⬍.001 versus control
layers, none of these correlations reachedP⬍.001. The MSFC score correlated with distant NAWM MTR peak height (r⫽
0.443,P⫽.0003), whereas trends were observed for the peri-lesional layers and for MTR peak position and T1 peak height in the perilesional layers and distant NAWM. There were no correlations with disease duration.
The cerebral lesion load correlated with T1 peak height of distant NAWM (⫽ ⫺0.615,P⬍.0001) and all perilesional layers (⬍ ⫺0.52,P⬍.0001) and with MTR peak height of distant NAWM (⫽ ⫺0.603,P⬍.0001) and layers 1, 2, and 4 (⬍ ⫺0.52,P⬍.0001). Interestingly, only for layer 1, lesion load also correlated with peak position of both MTR (⫽
⫺0.441,P⫽.0003) and T1 (⫽0.432,P⫽.0004), though there were trends in the other layers and distant NAWM.
Discussion
Because part of the methods applied in this study is unusual, we first discuss the credibility of these methods. Because of time constraints and signal-to-noise ratio considerations, this study used a large section thickness of 4 mm. As a result, only in-plane effects could be studied. Although the results would be even more convincing if obtained with isotropic 1⫻1⫻1 mm3voxels and equal signal-to-noise ratio for example, the
current results stand up to scrutiny. Because the coregistration of lesions masks defined on fast spin-echo Pd/T2-weighted images to the MTR and T1 map domains is very conservative toward NAWM, partial volume contributions from lesions to NAWM pixels are virtually absent. The present global in-plane analysis may, therefore, be less sensitive to differences, but the results presented here adequately reflect the properties of the investigated tissue. The successive perilesional NAWM pixel classes are on average progressively farther away from actual lesions, and the distant NAWM pixels are in all directions remote from actual lesions. Of course, a similar investigation with isotropic voxels may be more convincing, and this re-mains a future goal. Possible regional variation of NAWM changes was not taken into account with the present global type of analysis, which possibly also renders this method less sensitive to changes. This aspect should be addressed in future studies.
NAWM in the first 2 in-plane perilesional pixel layers had significantly lower MTR peak positions than distant NAWM. This is in agreement with findings of Filippi et al,6who, by
using a region-of-interest approach, have shown that perile-sional NAWM exhibits lower MTR than distant NAWM, es-pecially in patients with secondary progressive MS. Further-more, in our study, the MTR histograms of distant NAWM were statistically indistinguishable from those of control white matter, concerning both peak position and peak height. These results suggest that the pathologic substrates for MTR de-crease, both demyelination and axonal damage, may occur to a much larger degree in perilesional NAWM than in distant NAWM and become less pronounced with increasing distance to the MR-visible lesions. Demyelination and axonal damage may occur mainly as a secondary result of MR visible lesions and thus show a stronger effect close to those lesions. The larger MTR peak height of perilesional NAWM compared with distant NAWM suggests that perilesional NAWM ap-pears to be relatively homogeneously damaged.
Although relatively little has been reported on the patho-logic abnormalities in MS NAWM, some investigators have found reduced quantities of myelin.30,31The extent of axonal
damage in NAWM is small,32is larger in perilesional than in
distant NAWM,33and in selected parts of the corpus callosum was found to be related to lesions in projecting regions.34
Strikingly, in patients without active lesions, there was no sig-nificant acute axonal injury either in perilesional or distant NAWM.33 These results suggest that axonal injury in MS NAWM is strongly linked to the MS lesions and that it is more prominent in perilesional than in distant NAWM. In vivo, by using long-TR, short-TE MR spectroscopy, it has been shown that in a large volume of interest without lesions, no evidence for axonal damage can be found.35,36Because such large
vol-umes contain mostly distant NAWM as it was defined in the present study, this further suggests that in distant NAWM, axonal damage may be limited.
In contrast to the observations for MTR peak position, there was no significant difference between perilesional and distant NAWM in T1 peak position, and in all classes, second-ary progressive MS had significantly higher T1 peak position than that in controls. The latter is in agreement with the find-ings of Castriota-Scanderbeg et al,20who reported increased
T1 in secondary progressive MS both in perilesional and dis-Fig 2.MTR (A) and T1 (B) histogram peak positions for the 7 pixel classes in each of the
[image:5.585.53.286.44.378.2]tant NAWM compared with that in control white matter. Cas-triota-Scanderbeg et al also observed significantly higher mean T1 values in perilesional than in distant NAWM, whereas in this study, although T1 peak positions in layer 1 were slightly (but not significantly) higher, perilesional and distant NAWM were statistically indistinguishable in terms of T1 peak posi-tion. The statistical discrepancy probably derives from the dif-ferences between the region-of-interest approach in that study and the whole-brain histogram approach in this study.
Furthermore, we found significantly lower T1 peak height in distant NAWM, both compared with that in perilesional NAWM and with that in controls, reflecting greater heteroge-neity of T1 values in distant NAWM. In part, this may derive from differences in anatomic localization: Distant NAWM may contain pixels from more anatomic regions than perile-sional NAWM, because lesions arise predominantly in prefer-ential locations and there is regional variation in T1.2 How-ever, regional variation of the same degree is known to exist for MTR37,38—and was in fact also observed in the controls of this
study (data not shown)—yet the MTR peak height of distant NAWM is statistically indistinguishable from that of control white matter. Therefore, pathologic processes must play a role in the decrease of T1 peak height of distant NAWM.
It thus appears that whereas distant NAWM is relatively normal in terms of MTR, it is abnormal for secondary progres-sive MS in terms of T1, suggesting that (spatially heteroge-neous) disease processes occur in distant NAWM that are not picked up by the MTR. This is compatible with results of an MR imaging study on patients with early relapsing-remitting MS, which argued that in NAWM, MTR, and T1 provide, to a large degree, independent information.39The T1 relaxation
time is a sensitive but unspecific parameter, and increases in T1 may reflect, besides demyelination or axonal damage, a range of other processes, especially those that involve changes in water content such as edema, widening of the extracellular space, subtle blood-brain barrier leakage, or glial prolifera-tion.40,41In a combined histopathology-MR imaging study, Schmierer et al5found that neither MTR nor T1 was correlated
with the extent of gliosis. Increased water content of MS NAWM compared with that of control white matter has been reported in vivo by using T2 relaxation time measurements.42 Activated microglia have been observed in MS NAWM,30but
these small cells, especially when scattered, may not contribute enough water to account for the observed changes. Therefore, diffuse T1 increases may very well reflect subtle blood-brain barrier damage, with leakage of fibrinogen into the paren-chyma and microplaque formation.
The hypothesized greater severity of demyelination and ax-onal damage close to visible lesions was not corroborated by closer correlations with clinical disability measures for perile-sional NAWM. Also, the volume of MR-visible lesions is thus related to heterogeneity of T1 and MTR values in all NAWM, both perilesional and distant. The link between lesion volume and heterogeneity of NAWM may derive in part from the fact that if a patient has a larger number of lesions, there may be more different types of lesions with different pathologic char-acteristics.43,44As a result, the secondary damage in NAWM resulting from these lesions may also be more heterogeneous. In addition, there may be a link between the MR visible lesions and the diffuse disease processes that appear to leave the
ma-trix relatively intact. Whether these diffuse disease processes pave the way for focal lesion formation or whether both local-ized and diffuse disease activity are different aspects of the same disease process remains unsolved.
In conclusion, in MS NAWM, MTR decreases occur pri-marily around lesions, whereas T1 increases are more wide-spread. Our data— backed by available literature—suggest that demyelination and axonal damage in NAWM occur for the most part as a secondary result of demyelination and ax-onal damage within MR-visible lesions. This secondary dam-age is naturally most visible in perilesional NAWM, where damaged axons emerge from the lesions, leading to lower MTR values in perilesional than in distant NAWM. Distant NAWM is mainly affected by disease processes that involve significant changes in water content, but no matrix destruc-tion. These changes in distant NAWM are detected by T1 re-laxation time measurements, but not by MTR measurements.
Acknowledgments
The authors would like to thank the patients and control vol-unteers that participated in this study.
References
1. Vaithianathar L, Tench CR, Morgan PS, et al.White matter T(1) relaxation time histograms and cerebral atrophy in multiple sclerosis.J Neurol Sci2002; 197:45–50
2. van Walderveen MA, van Schijndel RA, Pouwels PJ, et al.Multislice T1 relax-ation time measurements in the brain using IR-EPI: reproducibility, normal values, and histogram analysis in patients with multiple sclerosis.J Magn Reson Imaging2003;18:656 – 64
3. Griffin CM, Chard DT, Parker GJ, et al.The relationship between lesion and normal appearing brain tissue abnormalities in early relapsing remitting multiple sclerosis.J Neurol2002;249:193–99
4. Stevenson VL, Parker GJ, Barker GJ, et al.Variations in T1 and T2 relaxation times of normal appearing white matter and lesions in multiple sclerosis.
J Neurol Sci2000;178:81– 87
5. Schmierer K, Scaravilli F, Altmann DR, et al.Magnetization transfer ratio and myelin in postmortem multiple sclerosis brain.Ann Neurol2004;56:407–15 6. Filippi M, Campi A, Dousset V, et al.A magnetization transfer imaging study
of normal-appearing white matter in multiple sclerosis.Neurology1995;45: 478 – 82
7. Loevner LA, Grossman RI, Cohen JA, et al.Microscopic disease in normal-appearing white matter on conventional MR images in patients with multiple sclerosis: assessment with magnetization-transfer measurements.Radiology
1995;196:511–15
8. Catalaa I, Grossman RI, Kolson DL, et al.Multiple sclerosis: magnetization transfer histogram analysis of segmented normal-appearing white matter.
Radiology2000;216:351–55
9. Cercignani M, Bozzali M, Iannucci G, et al.Magnetisation transfer ratio and mean diffusivity of normal appearing white and grey matter from patients with multiple sclerosis.J Neurol Neurosurg Psychiatry2001;70:311–17 10. Dehmeshki J, Chard DT, Leary SM, et al.The normal appearing grey matter in
primary progressive multiple sclerosis: a magnetisation transfer imaging study.J Neurol2003;250:67–74
11. Ge Y, Grossman RI, Udupa JK, et al.Magnetization transfer ratio histogram analysis of normal-appearing gray matter and normal-appearing white mat-ter in multiple sclerosis.J Comput Assist Tomogr2002;26:62– 68
12. van Waesberghe JH, Kamphorst W, De Groot CJ, et al.Axonal loss in multiple sclerosis lesions: magnetic resonance imaging insights into substrates of dis-ability.Ann Neurol1999;46:747–54
13. Parry A, Clare S, Jenkinson M, et al.White matter and lesion T1 relaxation times increase in parallel and correlate with disability in multiple sclerosis.
J Neurol2002;249:1279 – 86
14. Santos AC, Narayanan S, de Stefano N, et al.Magnetization transfer can predict clinical evolution in patients with multiple sclerosis.J Neurol2002;249: 662– 68
15. van Buchem MA, Grossman RI, Armstrong C, et al.Correlation of volumetric magnetization transfer imaging with clinical data in MS.Neurology1998;50: 1609 –17
measures derived from T2-weighted, T1-weighted, magnetization transfer, and diffusion tensor MR imaging.AJNR Am J Neuroradiol2001;22:1462– 67 18. Phillips MD, Grossman RI, Miki Y, et al.Comparison of T2 lesion volume and
magnetization transfer ratio histogram analysis and of atrophy and measures of lesion burden in patients with multiple sclerosis.AJNR Am J Neuroradiol
1998;19:1055– 60
19. Miller DH, Thompson AJ, Filippi M.Magnetic resonance studies of abnormal-ities in the normal appearing white matter and grey matter in multiple scle-rosis.J Neurol2003;250:1407–19
20. Castriota-Scanderbeg A, Fasano F, Filippi M, et al.T1 relaxation maps allow differentiation between pathologic tissue subsets in relapsing-remitting and secondary progressive multiple sclerosis.Mult Scler2004;10:556 – 61 21. Poser CM, Paty DW, Scheinberg L, et al.New diagnostic criteria for multiple
sclerosis: guidelines for research protocols.Ann Neurol1983;13:227–31 22. Kurtzke JF.Rating neurologic impairment in multiple sclerosis: an expanded
disability status scale (EDSS).Neurology1983;33:1444 –52
23. Cutter GR, Baier ML, Rudick RA, et al.Development of a multiple sclerosis functional composite as a clinical trial outcome measure.Brain1999;122: 871– 82
24. Venkatesan R, Lin W, Haacke EM.Accurate determination of spin-density and T1 in the presence of RF-field inhomogeneities and flip-angle miscalibration.
Magn Reson Med1998;40:592– 602
25. Jenkinson M, Bannister P, Brady M, et al.Improved optimization for the ro-bust and accurate linear registration and motion correction of brain images.
Neuroimage2002;17:825– 41
26. Ropele S, Filippi M, Valsasina P, et al.Assessment and correction of B1-in-duced errors in magnetization transfer ratio measurements.Magn Reson Med
2005;53:134 – 40
27. Smith SM.Fast robust automated brain extraction.Hum Brain Mapp2002;17: 143–55
28. Zhang Y, Brady M, Smith S.Segmentation of brain MR images through a hidden Markov random field model and the expectation-maximization algo-rithm.IEEE Trans Med Imaging2001;20:45–57
29. Smith SM, Zhang Y, Jenkinson M, et al.Accurate, robust, and automated lon-gitudinal and cross-sectional brain change analysis.Neuroimage2002;17: 479 – 89
30. Allen IV, McQuaid S, Mirakhur M, et al.Pathological abnormalities in the normal-appearing white matter in multiple sclerosis.Neurol Sci2001;22: 141– 44
31. Bot JC, Blezer EL, Kamphorst W, et al.The spinal cord in multiple sclerosis: relationship of high-spatial-resolution quantitative MR imaging findings to histopathologic results.Radiology2004;233:531– 40
32. Trapp BD, Peterson J, Ransohoff RM, et al.Axonal transection in the lesions of multiple sclerosis.N Engl J Med1998;338:278 – 85
33. Kornek B, Storch MK, Weissert R, et al.Multiple sclerosis and chronic auto-immune encephalomyelitis: a comparative quantitative study of axonal in-jury in active, inactive, and remyelinated lesions.Am J Pathol2000;157:267–76 34. Evangelou N, Esiri MM, Smith S, et al.Quantitative pathological evidence for axonal loss in normal appearing white matter in multiple sclerosis.Ann Neu-rol2000;47:391–95
35. Helms G, Stawiarz L, Kivisakk P, et al.Regression analysis of metabolite con-centrations estimated from localized proton MR spectra of active and chronic multiple sclerosis lesions.Magn Reson Med2000;43:102–10
36. Vrenken H, Barkhof F, Uitdehaag BM, et al.MR spectroscopic evidence for glial increase but not for neuro-axonal damage in MS normal-appearing white matter.Magn Reson Med2005;53:256 – 66
37. Armstrong CL, Traipe E, Hunter JV, et al.Age-related, regional, hemispheric, and medial-lateral differences in myelin integrity in vivo in the normal adult brain.AJNR Am J Neuroradiol2004;25:977– 84
38. Mehta RC, Pike GB, Enzmann DR.Magnetization transfer MR of the normal adult brain.AJNR Am J Neuroradiol1995;16:2085–91
39. Griffin CM, Parker GJ, Barker GJ, et al.MTR and T1 provide complementary information in MS NAWM, but not in lesions.Mult Scler2000;6:327–31 40. Allen IV, McKeown SR.A histological, histochemical and biochemical study
of the macroscopically normal white matter in multiple sclerosis.J Neurol Sci
1979;41:81–91
41. Vos CM, Geurts JJ, Montagne L, et al.Blood-brain barrier alterations in both focal and diffuse abnormalities on postmortem MRI in multiple sclerosis.
Neurobiol Dis2005;20:953– 60. Epub 2005 Jul 21
42. Laule C, Vavasour IM, Moore GR, et al.Water content and myelin water frac-tion in multiple sclerosis. A T2 relaxafrac-tion study.J Neurol2004;251:284 –93 43. Lucchinetti C, Bruck W, Parisi J, et al.Heterogeneity of multiple sclerosis
lesions: implications for the pathogenesis of demyelination.Ann Neurol2000; 47:707–17