Munich Personal RePEc Archive
Exploring the characteristics of transfer
pricing systems across countries
Rathke, Alex Augusto Timm and Rezende, Amaury José
FEA-RP, University of São Paulo
5 March 2016
Online at
https://mpra.ub.uni-muenchen.de/70437/
Exploring the Characteristics of Transfer Pricing Systems
Across Countries
∗Alex A. T. Rathke† and Amaury Jos´e Rezende‡
FEA-RP, University of S˜ao Paulo
March 5, 2016
Abstract
This paper analyses the characteristics of transfer pricing systems across countries, in order to identify the grouping structures intrinsically related with rules’ similarities, and to explore the key characteristics revealed by each group. Applying hierarchical agglomerative technique for comparison of an extensive set of attributes from domestic transfer pricing regulations, we find substantial differences among transfer pricing rules thus to support the segregation of three major groups of countries. The variance across transfer pricing systems refers not only to formal tax provisions, but also to practical requirements and regular ac-tions from authorities, and to governments’ openness for discussion of unclear tax posiac-tions. Although most regulations follow the main guidelines established by OECD, additional uni-lateral mechanisms remain, suggesting that countries face distinct profit shifting occurrences and need to create specific measures in attempt to restrain it. It thus implies the existence of gaps in current transfer pricing guidelines, and reinforces the call for new anti-shifting mechanisms to cover a broader set of shifting arrangements.
Keywords: profit shifting, transfer pricing systems, BEPS.
JEL Classification: F23, H26, K34
1
Introduction
The international profit shifting issue has received increasing attention in recent years from major economies worldwide, since the escalation of a relevant body of evidences indicating that multinational enterprises (MNE) have the ability to transfer taxable profits from high-tax to low-tax locations in order to reduce their global tax burden. Among several profit shifting strategies, international policy organizations highlight that the manipulation of transfer prices
∗We are truly grateful for the valuable comments from Andr´e Aquino, Andr´e Lino, Elisabeth Vendramin,
Nath´alia Laffin, Rafael Antˆonio, Ralph Sticca, and Thiago Prado, on previous version of this paper.
†Corresponding Author:
[email protected]. School of Economics, Business Administration and Accounting - Ribeir˜ao Preto, University of S˜ao Paulo. Postal address: Av. Bandeirantes 3900, CEP 14040-905, Ribeir˜ao Preto, SP, Brazil.
‡
(TP) on intra-firm transactions may be the most influential one. The current criteria widely accepted for valuation of intra-firm transactions is based on TP guidelines by Organization for Economic Co-operation and Development (OECD, 2010), which determines the arm’s length principle as the fundamental parameter for the appropriateness of TP.
Existing studies raise striking evidences of profit shifting by means of direct TP manipu-lation (Davies, Martin, Parenti, & Toubal, 2015; Cristea & Nguyen, 2014; Bernard, Jensen, & Schott, 2006; Overesch, 2006; Bartelsman & Beetsma, 2003; Clausing, 2003; Swenson, 2001), and while the imposition of special TP rules have demonstrated positive effects against tax-reducing intra-firm transfers (Beuselinck, Deloof, & Vanstraelen, 2014; Saunders-Scott, 2013), MNE still manage to find weaknesses and gaps on tax regulations in order to achieve it (Beer & Loeprick, 2015). On this issue, OECD have focused substantial efforts towards the review of current TP guidelines, thus to mitigate breaches in the framework and to widen its scope for inclusion of contemporary unprecedented arrangements, as well as to promote OECD guidelines as an harmonizing TP standard worldwide1
. The consensus for homogeneity of TP systems across countries is highly desirable, since the interaction of distinct domestic tax systems may create overlaps which can result in multiple taxation of the same tax base. On the other hand, parallel TP rules may also provide tax-avoidance opportunities, e.g. when a certain transaction receives privileged treatment in a specific country; in this case, MNE have higher incentives to manipulate TP in order to allocate most profits to this favourable location.
Despite an early development of general TP guidances by OECD2
and its broad accep-tance by several world economies, countries have historically established unilateral measures to control TP manipulation. In general, diversity in countries’ tax structures are due to differences in economic and political contexts, and the relationship between costs of administration and cost of compliance tends to affect the choice of tax instruments (Alt, 1983). In the TP case, countries typically introduce the core of OECD guidelines into their domestic tax systems, and include suitable modifications fitting their specific fiscal background. The extent of these modi-fications vary across countries, and it may affect the methods accepted to support arm’s length comparables and the tax-adjustment procedures implemented by tax authorities (Zinn, Riedel, & Spengel, 2014).
Notable efforts have been long taken with aims to coordinate nations’ domestic TP rules while maintaining their tax sovereignty, and recent discussions among tax administrations demon-strate a substantial advance on reciprocal commitments to this objective. OECD advocates for the application of a single TP standard worldwide3
and emphasises the need for improvement of the existing guidelines, thus to resolve loopholes, frictions and conflicts in the interactions of countries’ regulations (OECD, 2013). For this objective, it becomes necessary to identify
1
OECD published in 2013 a major Action Plan (OECD, 2013) addressing 15 actions to be necessarily addressed in order to resolve dominant base erosion and profit shifting issues, including changes in current TP guidelines. At end of 2015, OECD concluded a package with specific reports on all 15 actions, which is under combined discussion by more than 60 countries, including OECD and G20 members.
2
Preceding works by OECD originated the memorable 1979 Report for Transfer Pricing and Multinational Activity. Continuous developments produced the current international standards in the 2010 Transfer Pricing Guidelines for Multinational Enterprises and Tax Administrations.
3
the main characteristics responsible for the mismatches on TP systems across countries. The mapping of country-specific TP attributes and the balance of these attributes into uniformities
vs. disparities enables a detailed comparison that reveals interactional tax gaps, whilst it can expose the degree of differences carried by each country with respect to the parameter for ideal TP standardization.
The purpose of this paper is to analyse the characteristics several TP systems in order to identify similarities across countries’ rules, thus enabling the creation of groups of countries based on shared regulatory patterns. We focus on observable TP rules in 44 countries for the year 2014, which are descriptively available in Transfer Pricing Guidelines prepared by interna-tionally high-reputed audit and tax advisory firms. Based on countries’ TP rules, we create 54 variables representing relevant quantitative and qualitative attributes, which are employed for the construction of a dissimilarity coefficient that displays the differences on TP rules between pairs of countries. The pairwise dissimilarity measures are applied for comparative analysis across overall TP systems via hierarchical agglomerative technique. This method allows the unification of countries with most similar traits into separate clusters, and we follow this segre-gation to explore the characteristics of each group.
Our results indicate the existence of three groups with relevant distinguishable attributes. One group is composed by Argentina, Brazil and Ecuador, and displays a rigid set of TP systems, with methods and requirements that are stated explicitly through regulatory provisions. It car-ries a close relation with domestic tax structures in each country, thus becoming comparatively salient from general OECD guidelines. The second group is composed by Finland, Hungary, Norway, Slovenia, Slovak Republic and Russia, and also imposes a rather inflexible TP assess-ment by tax authorities, in special with respect to the availability of tax-adjustassess-ments agreeassess-ments between government and MNE. These countries follow the basis of OECD guidelines regarding TP methods, however domestic tax rules demand special treatment for deductibility of certain transactions. The third group comprises the remaining 35 countries and reflects the general TP standards implemented by OECD. Although it shows that most of countries present sub-stantially similar TP systems, closer inspection indicates inner-level differences thus to support the subdivision of six subgroups within this larger cluster. We observe that overall TP systems bear high level of similarities and the overall merging structures may be sensitive to changes in specific rules, hence the existence of separate groups rely on particular TP characteristics.
This paper provides two major contributions for the profit shifting literature. First, it provides a novel classification of TP systems that is supported by a more comprehensive set of characteristics, thus acquiring fair relevance within contemporary academic discussions. It adds to a branch of selected studies devoted to the analysis of TP systems4
, with findings obtained from a more thorough approach, since we consider a wide compendium of attributes that are highly important to the way anti-shifting mechanisms operate5
, which were not explored by
4
Our findings parallel in special with the widely applied categorisation created by Zinn et al. (2014) – they propose a six-level ordered categorisation of countries that is assumed to capture the strictness of TP rules, and it is based on two criteria: the existence of anti-shifting rule, and the extent of documentation and disclosure requirements.
5
previous studies, to the best of our knowledge. Moreover, our analysis differs from the dominant approach on this subject since it focuses in revealing the taxonomical arrangements of TP systems, rather than creating an enforcement rating for countries. We aim to obtain an overview of the variety of TP regulation styles and to observe the extent to which these styles become close to each other. This approach has the advantage to prioritise TP characteristics as the essentials of comparative examinations, and prevents from (deliberately) assigning an enforcement degree to each TP system based on rules’ presumed impacts6
.
Second, our results provide new knowledge about the key differences on TP systems across countries, therefore contributing to a major review of current anti-shifting mechanisms, as pro-posed by OECD. The present analysis explores the main attributes responsible for the distinction of separate groups of countries, thus to display the assorted set of actions conducted by countries in order to restrain TP manipulation. We observe that governments implement diverse measures to mitigate profit shifting, and despite an increasing coordination among countries towards the consistency among domestic TP rules, some of these measures still do not take into account the effect of other countries’ regulations7
. Hence, this analysis is potentially useful for the identifi-cation of inconsistencies across countries’ TP rules, so to delineate a fair path for the review of current TP guidelines, in order to resolve existing country-vs-country mismatches, to eliminate TP regulatory gaps, and to devise new anti-shifting mechanisms with suitable application for most number of countries.
The remaining of this paper is structured as follows: Section 2 describes the data set and the design of comparative strategy; Section 3 presents the comparative analysis and explores the TP characteristics according to the agglomerative outcomes; and Section 4 concludes.
2
Data and Investigation Strategy
The characteristics of TP systems in each country are obtained from Transfer Pricing Guidelines published by the major audit and tax advisory firms8
for the year 2014. These Guidelines are updated on a yearly basis and provide information on technical issues and specific aspects of TP rules for several jurisdictions9
. We adopted a similar sample used by Zinn et al. (2014) as the categorization of TP regulations proposed by the authors have become a main reference on
critical method for resolving TP disputes (OECD, 2010). The openness of governments for mutual agreements generate meaningful implications even on theoretical level. See Becker and Davies (2014) for a dedicated model on TP manipulation incorporating the MAP case.
6
We understand that the tax enforcement refers not only to the existence of a certain tax rule, but it depends on other factors related to the way each country ensures that taxpayers comply with this rule. A number of studies suggests that a tax rule produces diverse effects on distinct countries, thus governments implement different mechanisms depending on its country-specific impact on tax compliance. See, e.g. Alm (2012) for exam on compliance effects of tax audits and regulations, and Muehlbacher, Kirchler, and Schwarzenberger (2011) for analysis of factors influencing enforcedvs. voluntary tax conformity.
7
For example, this case is likely to occur for TP systems with no tradition in MAP approach, as identified in Argentina, Brazil and Ecuador.
8
Deloitte Touche Tohmatsu, Ernst & Young, KPMG and PricewaterhouseCoopers.
9
the issue.
From data collection, we observe prominent differences on TP regulations across countries. Notably, we find essential differences regarding the scope of related-party relationship, accepted pricing methods and priority of methods, restrictions to internal services and cost-sharing ar-rangements, type and extent of documentation requirement, transfer-pricing specific returns, special penalties, and availability of advanced pricing agreement (APA) and competent author-ity (CA) processes. We include both qualitative and quantitative attributes of TP systems in our analysis.
For our investigation, it is necessary to outline a procedure for the comparison of these characteristics. In our specific case, we are interested in identifying similarities across TP sys-tems, so countries sharing most of characteristics can be assembled into a single group. At the same time, we need to remark differences in each regulation, for groups composed by countries with distinct TP systems can become dissociated. Since TP rules commonly represent a nar-row and highly specialized component of a broader country-level tax system, we expect to find high level of similarities and little overall variance across all countries, thus the separation of TP systems is likely to rely on particular characteristics, and tends to generate groups located substantially close to each other.
In this line, we apply hierarchical clustering via agglomerative approach, which provides an analytical comparison of similarities for all countries, and is suitable for comparisons when the number of groups is not previously observable. After clustering process, we analyse the TP systems in each outlined group, with aims to identify the characteristics to support the merging of similar countries.
The clustering strategy follows the conventional process, which is divided in two stages. First, we calculate a measure of dissimilarity10
across countries, based on a set of variables de-noting the characteristics of TP systems. Dissimilarities across TP systems are structured in a n×n matrix of pairwise dissimilarities D≡ (gij), i 6=j, where gij denotes the dissimilarity
betweeni-th andj-th countries. In the second stage, we use these dissimilarities to create clus-ters of countries, applying an agglomerative method compatible with the dissimilarity measure. Conventional agglomerative process consists on initial n clusters, for each cluster includes a single country. The most similar pair of clusters is first unified, so to provide a new cluster with two countries. This new cluster is then compared with the remaining n−2 clusters, in order to combine with the next most similar cluster. Agglomerative process repeats continuously to the last stage, resulting on final-level group composed by all countries11
.
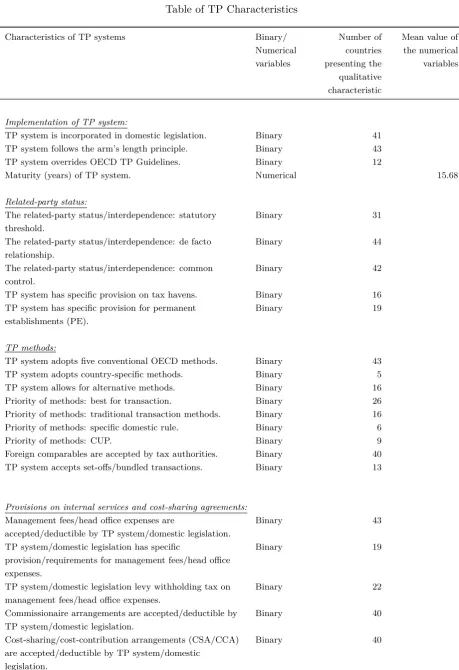
Following this strategy, at the first stage we create a codification that generates 54 variables related to several characteristics of TP systems. Most of characteristics are qualitative, for which we set a binary codification stating the value 1 if the TP regulation carries the respective attribute. For the quantitative characteristics, variables refer to corresponding standardized measures. Description of codification for all 54 variables in Appendix.
10
Simple transformation: dissimilarity = 1−similarity (Gordon, 1987).
11
We obtain the matrix of dissimilarities across countries via Gower (1971) coefficient12
, all variables assuming the same weight, which gives a proportion of the difference between pairwise shared characteristics betweeni-th andj-th countries, with respect to total characteristics. The coefficient ranges from 0 (complete dissimilarity) to 1 (complete similarity). In this study, binary codification of qualitative characteristics is addressed to create relevant variables for which the absence of a characteristic (value 0) is indeed informative. Gower (1971) coefficient is consistent with this purpose, for a cross-tabulate binary variable kij(0,0) between two observations is
regarded as providing similarity between i-th andj-th countries.
At the second stage, we analyse the dissimilarity matrix to create clusters of countries. We apply two related agglomerative approaches, in order to compare the nested subsets of each classification. One method is the average linkage method across clusters13
, to account for average similarity of pairs of countries, controlling for the size of each group. The other method is the weighted average linkage method, which is similar to the unweighted average approach but is measured via simple average of pairwise dissimilarities14
. In both methods, clusters are combined through process of ordered pairwise similarities. Average linkage method is best appropriate for the purpose of the present analysis since it merges groups with small variances within TP systems, and it avoids the consolidation of two groups based on the characteristics of a single country (Sokal & Michener, 1958). Besides, it is suitable to our case, since it is not possible to predefine specific weights for our variables. Results obtained from agglomerative analysis allow us to explore the characteristics of TP systems in each group, thus identifying prominent TP characteristics within clusters, while revealing particularities and distinctive TP patterns.
12
Gower (1971) coefficient is a similarity measure for mixed variables that takes the form
sij=
Pp
k=1δijkdijk
Pp k=1δijk
Similaritysijis a weighted mean of the contribution of eachk-th variable for the similarity between observations
iandj. The weight δijk is a binary code with value 0 if thek-th variable is missing for eitherior j; otherwise,
δijk=1. If variablekis binary, the contributiondijktakes the value 0 if the variable is equal for both observations,
and takes the value 1 otherwise (this is the same as the traditional simple matching coefficient; see Gordon (1987) for detail). If variablek is continuous,dijk is the absolute difference betweeniandj, standardised by the total
range ofk.
13
This method is also called unweighted pair-group method using average - UPGMA. Formally, UPGMA dis-similaritygJ K between two clustersJ andKis
gJ K=
1
nJ+nK nJ
X
i=1
nK
X
j=1
gij
wherenJ andnK are the number of countries in clustersJ andK, respectively.
14
This method is also called weighted pair-group method using average - WPGMA. Formally, WPGMA dis-similaritygJ K between two clustersJ andKis
gJ K =
1 2
nJ
X
i=1
nK
X
j=1
3
Analysis
We first present the comparative analysis of TP systems, focusing on shared characteristics for the arrangement of groups of countries. Subsequently, we describe the leading characteristics in each group, which are responsible for the clustering patterns.
3.1 Agglomerative Analysis
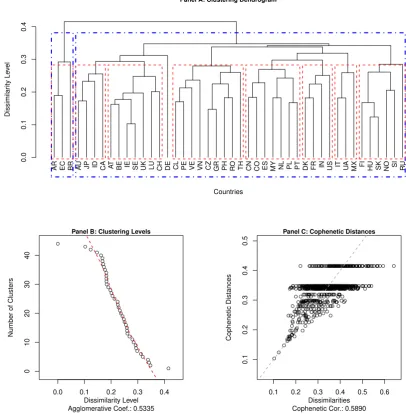
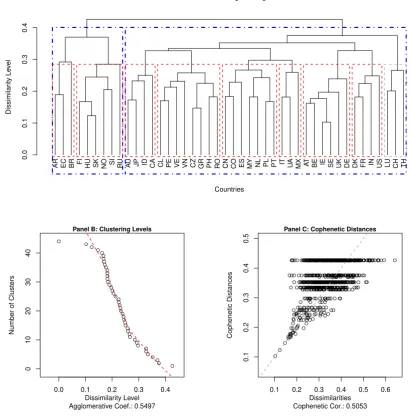
Analysis following our baseline strategy is presented in Figures 1 and 2. It is relevant to compare the outcomes of these two approaches, since a consistent result may reveal the inner structure of observations (Gordon, 1987). Clustering dendrograms for the average and the weighted approaches are presented in Panel A of both Figures 1 and 2, respectively.
0.0
0.1
0.2
0.3
0.4
Panel A: Clustering Dendrogram
Countries
Dissimilar
ity Le
vel
AR EC BR AU JP ID CA AT BE IE SE UK LU CH DE CL PE VE VN CZ GR PH RO TH CN CO ES MY NL PL PT DK FR IN US IT UA MX FI HU SK NO SI RU
● ● ● ● ● ● ● ● ● ● ● ● ● ● ● ● ● ● ● ● ● ● ● ● ● ● ● ● ● ● ● ● ● ● ● ● ● ● ● ● ● ● ● ●
0.0 0.1 0.2 0.3 0.4
0
10
20
30
40
Panel B: Clustering Levels
Dissimilarity Level Agglomerative Coef.: 0.5335
Number of Clusters
● ● ● ● ● ● ● ● ●● ● ● ●●● ● ● ●●●●●● ●● ● ● ● ●●●●●●●●●●●●● ●● ●● ● ● ● ●● ● ● ● ● ● ● ● ● ● ● ● ● ● ● ● ● ●●● ●●● ●● ●● ● ● ● ● ● ● ● ●● ● ● ● ● ●● ● ● ● ● ● ● ● ● ● ● ● ● ● ● ● ● ●●● ● ● ●●● ● ●● ● ● ● ● ● ● ●● ● ● ● ● ● ● ● ● ● ● ● ● ● ● ● ● ● ● ● ● ● ● ● ● ●● ●●● ●●● ● ● ● ● ● ● ● ● ● ● ● ● ●● ● ● ● ● ●● ●● ● ● ●●● ●● ● ● ●● ●●● ●●●●●●●● ●● ● ● ●● ●● ● ● ● ● ● ● ● ● ● ● ● ● ● ● ● ● ● ●●●●● ● ● ● ● ● ● ● ● ● ● ● ● ● ● ● ● ● ● ● ● ● ● ● ● ● ●● ● ●●● ● ● ● ● ● ● ● ● ● ● ● ● ● ● ● ● ● ● ● ● ● ● ● ● ● ● ● ● ● ● ● ● ● ● ● ● ● ● ● ● ● ● ● ● ● ● ● ● ● ● ● ● ● ● ● ● ● ● ● ● ● ● ● ● ● ● ● ● ● ● ● ● ● ● ● ● ● ● ● ● ● ● ● ● ● ● ● ● ● ● ●●● ● ● ●●● ●●● ●●● ● ● ● ● ● ● ● ● ● ●● ● ● ● ● ● ● ● ● ● ● ● ● ● ● ● ● ● ● ● ● ● ● ● ● ● ● ● ● ● ●● ● ● ● ● ● ● ● ● ● ● ●●●●● ● ●● ●●● ●● ● ●● ●●●●● ● ●●● ●●●● ● ● ● ● ● ● ● ●● ●●●●● ● ● ● ● ● ●● ● ● ● ● ● ●●●●●●● ● ● ● ● ● ● ● ● ● ● ● ● ● ● ● ● ● ● ● ● ● ● ● ● ● ● ● ● ● ● ● ● ● ● ● ● ● ● ● ● ●●● ●●●●● ●● ● ● ● ● ● ● ●● ● ● ●●● ●● ● ● ● ● ● ● ● ● ● ● ● ● ● ● ●● ● ●● ● ● ● ● ● ● ●● ●●● ● ● ● ● ●● ● ● ● ● ● ●● ●●●● ●● ●● ● ● ● ● ● ● ● ● ● ● ● ● ● ● ● ● ● ● ● ● ● ● ● ● ● ● ● ● ● ●● ●● ● ●● ●● ● ● ● ● ● ● ● ● ● ● ● ● ● ● ●● ● ● ● ●● ● ● ● ● ● ● ● ● ● ● ● ●● ●● ● ● ● ● ● ●● ● ● ● ● ● ● ● ●● ● ● ● ● ● ● ● ● ● ●●● ●●●● ●● ● ● ●● ● ● ● ● ● ●●● ●● ● ● ●● ● ●●● ● ● ● ● ● ● ● ●● ● ● ● ● ● ● ● ● ● ● ● ● ●● ● ● ● ● ● ● ● ● ● ● ● ● ●● ●● ● ● ● ● ● ● ● ● ● ● ● ● ● ● ● ● ● ● ● ●● ● ● ● ● ● ● ●● ● ●● ● ● ● ● ● ● ●● ●●●● ● ● ● ● ●● ● ● ●● ● ● ●● ● ● ● ● ● ● ● ● ● ● ● ● ● ● ● ●● ● ● ● ● ● ● ● ● ● ● ● ● ● ● ● ● ● ● ● ● ● ● ● ● ● ● ●● ●●● ●● ● ● ● ● ● ●● ● ●●● ● ● ● ● ● ● ● ● ● ● ● ● ● ●● ● ● ●●●● ●●● ●●●● ● ● ● ● ● ● ● ● ● ● ● ● ● ● ● ● ● ● ● ● ● ● ● ● ● ● ●● ●● ● ● ●
0.1 0.2 0.3 0.4 0.5 0.6
0.1
0.2
0.3
0.4
0.5
Panel C: Cophenetic Distances
Dissimilarities Cophenetic Cor.: 0.5890
[image:8.595.77.484.307.722.2]Cophenetic Distances
0.0
0.1
0.2
0.3
0.4
Panel A: Clustering Dendrogram
Countries
Dissimilar
ity Le
vel
AR EC BR FI HU SK NO SI RU AU JP ID CA CL PE VE VN CZ GR PH RO CN CO ES MY NL PL PT IT UA MX AT BE IE SE UK DE DK FR IN US LU CH TH
● ● ● ● ● ● ● ● ● ● ● ● ● ● ● ● ● ● ● ● ● ● ● ● ● ● ● ● ● ● ● ● ● ● ● ● ● ● ● ● ● ● ● ●
0.0 0.1 0.2 0.3 0.4
0
10
20
30
40
Panel B: Clustering Levels
Dissimilarity Level Agglomerative Coef.: 0.5497
Number of Clusters
● ● ● ● ● ● ● ● ●● ● ● ●● ● ● ● ●● ●●● ●● ● ● ● ● ●● ● ● ● ● ● ● ● ● ● ● ● ●● ●● ● ● ● ●● ● ● ● ● ● ● ● ● ● ● ● ● ● ● ● ● ● ● ● ● ● ● ● ● ● ● ● ● ● ● ● ● ● ● ● ● ● ● ● ●● ● ● ● ● ● ● ● ● ● ● ● ● ● ● ● ● ● ● ● ● ● ● ● ● ● ● ● ● ● ● ● ● ● ●● ● ● ● ● ● ● ● ● ● ● ● ● ● ● ● ● ● ● ● ● ● ● ● ● ● ●●● ● ● ● ● ● ● ● ● ● ● ● ● ● ● ● ● ●● ● ● ● ● ● ● ● ● ● ● ●●● ●● ● ● ● ●●● ● ● ● ●● ● ● ● ● ● ●● ● ●● ● ● ● ● ● ● ● ● ● ● ● ● ● ● ● ● ● ● ● ● ●● ● ● ● ● ● ● ● ● ● ●● ● ● ● ● ● ● ● ● ● ● ● ● ● ● ● ● ● ● ● ●● ● ● ● ● ● ● ● ● ● ● ● ● ● ● ● ● ● ● ● ● ● ● ● ● ● ● ● ● ● ● ● ● ● ● ● ● ● ● ● ● ● ● ● ● ● ● ● ● ● ● ● ● ● ● ● ● ● ● ● ● ● ● ● ● ● ● ● ● ● ● ● ● ● ● ● ● ● ● ● ● ● ● ● ● ● ● ● ● ● ● ● ● ● ● ● ● ● ● ● ● ● ● ● ● ● ● ● ● ● ● ● ● ● ● ● ● ● ● ● ● ● ● ● ● ● ● ● ● ● ● ● ● ● ● ● ● ● ● ● ● ● ● ● ● ● ●● ● ● ● ● ● ● ● ● ● ● ●● ● ● ● ● ●● ●●● ● ● ● ● ●●●● ● ● ● ●●● ●● ●●●●● ● ● ● ● ●● ●●●●● ● ● ● ● ● ●● ● ● ● ● ● ●●●●●● ● ● ● ● ● ● ● ● ● ● ●● ● ● ● ● ● ● ● ● ● ● ● ● ● ● ● ● ● ● ● ● ● ● ● ● ● ● ● ● ● ● ● ● ● ● ● ● ● ● ● ● ● ● ● ● ● ● ● ● ● ● ● ● ● ● ● ● ● ● ● ● ● ● ● ● ● ● ● ● ● ● ● ● ● ● ● ● ● ● ● ●● ●●● ● ● ● ● ●● ● ● ● ● ● ●● ●●●● ●● ● ● ●● ● ● ● ● ● ● ● ● ● ● ● ● ● ● ● ● ● ● ● ● ● ● ● ● ● ● ● ●● ● ● ● ● ●● ● ● ● ● ● ● ● ● ● ● ● ● ● ● ● ●● ● ● ● ●● ● ● ● ● ● ● ● ● ● ● ● ● ● ● ● ● ● ● ● ● ● ● ● ● ● ● ● ● ● ● ● ● ● ●● ● ● ● ● ● ● ● ● ● ●● ● ● ● ● ● ● ● ● ● ● ● ●● ●● ● ● ● ● ● ● ● ● ● ● ● ● ● ● ● ●●● ● ● ● ● ● ● ● ● ● ● ● ● ● ● ● ● ● ● ● ● ● ● ● ● ● ● ● ● ● ● ● ● ● ● ● ● ● ● ● ● ● ● ● ● ● ● ● ● ● ● ● ● ● ● ● ● ● ● ● ● ● ●● ● ● ● ● ● ● ●● ●●●● ● ● ● ● ●● ● ● ● ● ● ● ●● ● ● ● ● ● ● ● ● ● ● ● ● ● ● ● ●● ● ● ● ● ● ● ● ● ● ● ● ● ● ● ● ● ● ● ● ● ● ● ● ● ● ● ● ● ●● ● ● ● ● ● ● ● ● ● ● ● ●●● ● ● ● ● ● ● ● ● ● ● ● ● ● ●● ● ● ●● ●●● ●●● ● ● ● ● ● ● ● ● ● ● ● ● ● ● ● ● ● ● ●●●● ●● ●● ●● ● ●● ● ● ● ● ●
0.1 0.2 0.3 0.4 0.5 0.6
0.1
0.2
0.3
0.4
0.5
Panel C: Cophenetic Distances
Dissimilarities Cophenetic Cor.: 0.5053
[image:9.595.76.488.99.517.2]Cophenetic Distances
Figure 2: Clustering of TP Systems - Weighted Average Linkage
We initially observe that both classifications generate similar local nodes corresponding to subsets of countries, however the merging of groups at higher stages follow different arrange-ments. At ≈0.3 level, all countries are incorporated into their respective subgroups. Internal nodes raise the segregation of eight comparable subgroups with matching compositions between both plots15
, which are outlined in red dashed frames. The agglomerative coefficients of 0.5335 and 0.5497 for average and weighted approaches, respectively, indicate high similarity among overall TP systems, thus the delimitations of red dashed subgroups are sensitive to specific characteristics of TP rules.
15
At>0.4 dissimilarity levels, we find taller branches and stronger grouping structures, which are outlined in blue dotdashed frames. They suggest that TP systems in Argentina, Brazil and Ecuador share similar attributes, and these rules are substantially different from all remaining countries. In addition, group composed by Finland, Hungary, Norway, Slovenia, Slovak Republic and Russia emerges with significant distance from other bordering subgroups. This outcome is more noticeable in the weighted approach16
.
Stages of clustering process are presented in Panel B of Figures 1 and 2, which demonstrates that countries become unified at a fast pace, specially within the range from 0.102 to 0.285 of the dissimilarity level. It reflects homogeneous proximity of countries to generate their respective subgroups. Panel C of Figures 1 and 2 presents the cross-analysis between observed dissimilari-ties and the distances calculated during the clustering process – known as cophenetic distances. Arrangements formed up to the level 0.3 bear rich variance due to high degree of in-between uniformity of pairwise distances. Thus, boundaries of subgroups formed to this level (red dashed frames on dendrograms) are not well-defined. On the other hand, cophenetic distances indicate a good fit of clustering process at >0.4 dissimilarity levels.
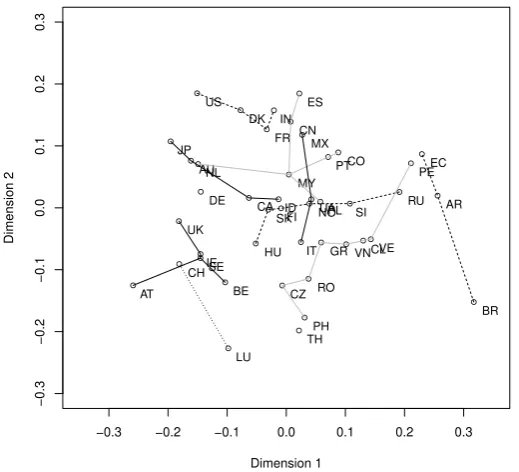
The extent of the differences across all TP systems can be further inspected via multidi-mensional scaling of pairwise dissimilarities. Figure 3 presents the two-dimension scaling for dissimilarities across all countries.
● ●
● ●
● ●
● ●
●
● ●
●
● ●
●
● ●
●
●
●
● ●
● ●
●
●
●
●
● ●
●
●
●
● ●
●
● ●
● ●
● ●
● ●
−0.3 −0.2 −0.1 0.0 0.1 0.2 0.3
−0.3
−0.2
−0.1
0.0
0.1
0.2
0.3
Dimension 1
Dimension 2
AR AU
AT BE
BR CA
CL CN
CO
CZ DK
EC
FI FR
DE
GR HU
IN
ID
IE IT JP
LU MY
MX
NL
NO
PE
PH PL
PT
RO
RU SK SI
ES
SE CH
TH UA UK
US
[image:10.595.162.422.415.651.2]VE VN
Figure 3: Two-Dimension Scaling for Dissimilarities of TP Systems
16
In Figure 3, the segregation of TP systems into particular clusters is not plain, since graphical distances have uniform dispersion17
. Based on agglomerative process, we simulate in Figure 3 the linkages of eight intermediary subgroups by means of three layers crosswise the plot18
. For ease of visualisation, we set a first layer in solid line, second layer in gray line, and third layer in dashed line.
The overlap of subgroup linkages in Figure 3 exhibits the closeness among most TP systems. Graphical inspection suggests the split of Argentina, Brazil and Ecuador into a group (farther right side on the plot), consistent with previous plots. In addition, subgroup composed by Austria, Belgium, Ireland, Sweden and United Kingdom set a sparsely distant pattern (left-bottom diagonal quadrant in the plot), however it remains substantially close to other subgroups, in special through approximation of Germany.
In general, results indicate that all countries display high level of similarities among each other, and the segregation of subgroups of countries rely on particular characteristics of TP systems. It suggests that short changes in TP rules might cause countries to switch places from one subset to another, thus the composition of uniformly consistent clusters is unstable. Nonetheless, closer review suggests the existence of a group composed by Argentina, Brazil and Ecuador, which becomes reasonably distinguished from other countries. Analysis also calls detailed attention to the conjoint movement of Finland, Hungary, Norway, Slovenia, Slovak Republic and Russia, thus to indicate a possible grouping pattern for these countries. Other remaining countries agglomerate into a condensed structure and establish a third large cluster, where the majority of observations are divided into adjacent subgroups with sensitive boundaries. We follow these outcomes in order to explore the characteristics of TP systems within each group, with aims to identify leading attributes shared by its components.
3.2 Characteristics of TP Systems
Based on analysis in Subsection 3.1, we proceed with segregations in two levels: the first one regards the arrangement of all 44 countries into three primary groups, representing agglomerative patterns at >0.4 dissimilarity levels; the second level focuses on intermediary subdivisions at
≈0.3 dissimilarity, thus it segregates components of the larger primary cluster into six subgroups.
3.2.1 Primary Groups
Group I - Argentina, Brazil and Ecuador: These countries display the most distinguished TP characteristics when compared with all remaining observations. TP system in these countries is incorporated into their respective domestic law and carries some specific provisions which are not completely consistent with OECD guidelines. In particular, Argentina and Brazil determine
17
In undisclosed analysis, we apply additional dimensional-scaling tests (classical and non-metrical) with sup-plementary dimensions, and we obtain the same material observations. The results indicate high consistency across all TP systems.
18
specific pricing calculations each, which bear significant differences from traditional transaction and profit-based methods19
, and all three countries set arbitrary rules regarding the priority order for application of TP methods. Besides, the override of domestic TP rules on top of OECD principles is made explicit within their national legislation.
In this group, tax-purposed assessment of TP practices is inflexible and strictly based on statutory provisions. Interpretation and application of TP rules tends to be acutely limited, and APA are not available. Although Argentina and Ecuador maintain formal rules for CA procedures20
, extensive documentation requirements and extreme stringency on tax diligences cause double-tax relief to be hardly achieved and to be rarely seek by taxpayers, thus CA process is virtually non-existent. Lastly, we observe that internal services and cost sharing arrangements are broadly allowed, yet domestic rules demand mandatory withholding tax on all payments to foreign related parties, with rates ranging from 15% in Brazil to 35% in Argentina21
.
Group II - Finland, Hungary, Norway, Slovenia, Slovak Republic and Russia: TP systems in this group are consistent with the core of international TP principles within OECD guide-lines. In detailed account, however, certain transactions receive a particular treatment, and the implementation of monitoring activities and structured disclosure requirements appears to be in current ongoing development. First, we observe that all countries allow payments to foreign related parties, for which the general TP rules apply. These payments may include management fees and intra-firm costs, and domestic rules require proper documentation to support the eco-nomic essentials of these arrangements. For ordinal internal transactions, none of the countries levy withholding taxes22
. In countries where reimbursements of intra-firm costs are not allowed due to absence of official regulation (e.g. Russia and Slovenia), firms usually sign corporate intra-firm contracts for provision of internal services. Effectiveness of these internal contracts are commonly unclear to tax authorities.
Statutory requirements on TP documentation were implemented in recent years, despite a long-standing TP law by some of these countries23
. TP regulations require an annual tax return to be filled in country-specific tax forms, which consists on a short disclosure of elementary information about intra-firm transactions. On the other hand, full TP documentation and cal-culations, including detailed TP study, must be provided to tax authorities upon request, within a short deadline (e.g. 3 days in Hungary and 15 days in Slovak Republic). We also observe that these countries do not establish specific statute of limitations when intentional non-compliance is identified – most of countries already establish a statute of limitations of 10 years for all
19
Argentina has a ”commodity-based” method, in addition to conventional OECD methods, required for trans-actions based on publicly quoted prices, and its application follow specific rules regarding agency representatives, intermediate parties and the date of transactions. Brazil does not follow OECD methods, but determines specific TP calculations that are based on fixed margins arbitrarily set in domestic law. Tax specialists usually regard Brazilian TP methods as not complying with the arm’s length principle.
20
CA process is not available in Brazil.
21
Specific (usually reduced) withholding tax rates are applied for payments to foreign countries with bilateral tax treaties.
22
Exceptions apply, e.g. in Finland, tax rule requires a corporate withholding tax from 15% to 20% on specific transfers, depending on the type of income.
23
circumstances. Moreover, this group resembles previous Group I with respect to application of CA procedures, since both groups do not have tradition in mutual agreement procedures (MAP) or APA. Approaches focusing on mutual agreements between tax authorities and taxpayers are relatively new in these countries, and firms are still discouraged from submitting tax adjust-ments or from appealing to tax arbitration courts due to limited implications obtained in recent settlements. Thus, firms tend to contact competent authority only after a tax inspection, and double taxation is not likely to be avoided.
Group III:The third primary group includes the remaining countries that are not included inGroup I andGroup II. These TP systems are highly reflective of the internationally dissem-inated TP standards. All countries follow OECD guidelines with respect to TP methods and their application. In addition, most of countries have APA or APA-like programs available, and hold formal procedures for agreements with competent authority focusing to resolve double-taxation issues. Although these attributes support a fairly stronger clustering structure, exam of details within individual TP systems reveals that there is no absolute uniformity among all countries. Besides similar TP characteristics, it follows from analysis in Subsection 3.1 that a substantial homogeneity of distances across observations is also responsible for the clustering outcomes. Hence, we divide the components ofGroup III into six subgroups in order to analyse the specific properties shared by their components.
3.2.2 Subdivision of Countries from Group III
Subgroup I - Australia, Canada, Indonesia and Japan: These countries hold an established set of TP rules that emerge from a reliable mature development of domestic TP legislation through the years. Tax authorities follow the guidances of OECD principles and explicitly assume the best-for-transaction approach for the choice of TP method. TP rules carry specific provisions on cost-sharing arrangements, and APA rules allow the rollback of an agreed TP method back to two years from the settlement. TP rules also require the disclosure of detailed TP study in a yearly-filed tax return, containing relevant information that includes the volume of intra-firm transactions, location of related parties, types of transactions, and calculations of TP methods for the tax period.
Subgroup II - Austria, Belgium, Ireland, Sweden and United Kingdom: This subgroup displays more flexibility on the application of TP rules, and appears to exercise a less stringent fiscal escort on regular circumstances. Countries follow the general OECD guidelines and are inclined to accept the net profit set-off of conjoint transactions for TP assessment purposes, when appropriate. With the exception of United Kingdom, the related-party condition is not determined by statutory percentage/threshold, but it is based on the analysis of evidences for a
de factorelationship. Tax rules do not impose withholding taxes on foreign payments to related parties, and there is no requirement for filing TP return, although a TP study and proper documentation must be provided if requested by tax authorities.
Subgroup III - Chile, Czech Republic, Greece, Peru, Philippines, Romania, Venezuela and
schemes between tax authority and taxpayer, since tax rules do not implement formal CA procedures to undertake double-taxation cases, while APA rules are relatively recent for most of these countries24
. CA processes are available only in Czech Republic and Greece, yet the chances to resolve double taxation on these countries are considered low. Tax rules carry specific provisions on statutes of limitations for intentional non-compliance, in which cases most of countries set a 10-years term for fiscal inspections, and most countries apply a weighty penalty on improper TP documentation, which is calculated in proportion to the tax adjustment.
Subgroup IV - China, Colombia, Malaysia, Netherlands, Poland, Portugal and Spain: In this subgroup, tax authorities are reputably rigorous with respect to pricing appropriateness of intra-firm transactions. TP systems allow firms to submit tax adjustments via CA procedure, however adjustment proposals are accepted only after a fiscal inspection is completed. In most of these countries, issuance of CA process does not suspend tax exaction, thus firms still have to liquidate their tax liability. This requirement makes CA procedure highly inefficient, and relief of double taxation is unlikely to occur in most of cases. With the exception of Malaysia, all countries carry tax provisions with explicit reference to tax-treatment of permanent establishments (PE), and most countries apply TP rules on these transactions. TP regulations also have specific deadlines for disclosure of full TP documentation when requested, which are substantially short when compared with the general deadline pattern of 30 days, e.g. shortest deadlines are found in Poland (7-8 days), Spain (9 days), Portugal (10 days) and Colombia (15 days).
Subgroup V - Denmark, France, India and United States: These TP systems incorporate a mix of characteristics that are included in previous four subgroups. Countries follow the essentials of OECD guidelines with respect to TP methods and express preference for application of the TP method that better reflects the nature of the transactions. Besides, tax authorities are leaning to allow the intentional set-off approach for TP assessment, when appropriate. In the general case, tax rules do not levy withholding taxes on payments to foreign parties, however all countries implement specific provisions regarding the deductibility of management fees and reimbursement of head-office expenses. In addition, countries require only a plain disclosure of intra-firm transactions via tax return filed on yearly basis, and this requirement is conditioned to firms complying with particular conditions established in tax regulation. On the other hand, qualified documentation must be provided to fiscal authorities upon request, and TP rules set specific penalizations if firms fail to properly support their TP choices, amounted as a significant portion of the undue tax reduction.
Subgroup VI - Italy, Mexico and Ukraine: The sixth subgroup is composed by TP systems that appear to hold a closer connection with their respective national regulatory structure. Despite being expressly grounded on the prescribed procedures within OECD guidelines, these TP rules display variation in some degree – in case of conflicting rules, domestic provisions overrides OECD guidances. Among relevant attributes, all countries determine specific rules for application of TP assessment on transactions with parties located in tax havens, and assume a rather wide set of conditions for classification of a foreign firm as a related party. Moreover,
24
these TP systems impose the priority of the CUP method regardless the type of transactions; if CUP is unavailable, firms must prioritise the other traditional transactional-based methods. Cost contribution arrangements are hardly accepted, specially in Mexico and Ukraine, and general corporate practice indicate that firms rarely initiate a tax-adjustment proposal to tax authorities, although all countries carry formal rules on CA procedures.
The special cases of Germany, Luxembourg, Switzerland and Thailand: These countries present unstable clustering outcomes and do not stick with specific groups. We observe that Germany is particularly close toSubgroup II and could be allocated into this subgroup with little prejudice, though it carries a more senior tradition on TP regulation25
, with a well-consolidated CA process and inclination for traditional transaction-based comparables. For Luxembourg, Switzerland and Thailand, there are no structured set of TP rules on domestic tax system – these countries claim to adopt the OECD guidelines in fullness26
. Nonetheless, expertise with respect to these countries suggests that fiscal activity on the assessment of intra-firm transactions appears to be more lenient than in other countries, thus the effectiveness of anti-shifting procedures is presumptively weakened.
4
Concluding Comments
The increasing relevance of TP manipulation as an efficient mean to reduce MNE’s global tax burden has concerned governments and international policy organizations worldwide, since it causes the reduction of national tax revenues and the increase of administration costs in order to ensure tax compliance. This issue receives special attention after an increasing number of current researches presents substantial evidences that profit shifting transactions cause a large amounts of taxable profits to be allocated to jurisdictions with little-to-none economic activity. In order to restrain tax-induced profit shifting, countries have long implemented special tax rules to determine the appropriateness of TP, and OECD assumes the leading role in developing the international TP standards and promoting them across countries. The current efforts are directed to eliminate existing flaws, to devise new anti-shifting mechanisms regarding modern arrangements, and to harmonise TP systems worldwide.
This paper analyses several TP systems in order to identify similarities among countries, thus to create groups of countries based on uniformity of TP characteristics. We find three major groups of countries displaying substantial differences. The first group is composed by few countries and carry highly distinct TP rules in comparison with OECD TP guidelines. It assumes a strict conduct with respect to dispositions in tax regulation, with no availability for interpretations or tax-adjustment submissions. The second group have more countries than the first group and implements TP rules consistent with the core of OECD guidelines, although it
25
Germany implemented the Principles for the Examination of Income Allocation in the Case of Internationally Related Enterprises in February of 1983.
26
also do not have tradition in agreement procedures between taxpayers and fiscal authorities, and it exhibits tax monitoring procedures to be still in development. The third group comprises the majority of countries and takes OECD guidelines as the fundamental TP standard, with small variations referring to specific provisions in each country. Detailed analysis allows the separation of concentrated subgroups, according to specialised sets of TP characteristics.
We observe that overall TP systems present high level of general similarity, nonetheless the existing variance indicate that there is no complete homogeneity across countries. In the general case, TP regulations are incorporated into the domestic tax system and get appended with specific country-level rules, thus these rules are likely to carry close association with the inner structures of the taxation process and the broader legal system in each country. Hence, our results might point to countries’ preferences on different anti-shifting instruments, and it may direct to relevant country factors that influence TP regulation. The present analysis thus have application on new investigations not only regarding profit shifting and tax avoidance behaviour, but also on the review of the international TP standards and on the exam of tax regulation patterns across countries.
References
Alm, J. (2012). Measuring, explaining and controlling tax evasion: lessons from theory, experi-ments and field studies. International Tax and Public Finance,19(1), 54–77.
Alt, J. E. (1983). The evolution of tax structures.Public Choice,41(1), 181–222.
Bartelsman, E. & Beetsma, R. M. (2003). Why pay more? Corporate tax avoidance through transfer pricing in OECD countries.Journal of Public Economics,87(9), 2225–2252. Becker, J. & Davies, R. B. (2014). A Negotiation-Based Model of Tax-Induced Transfer Pricing.
CESifo Working Paper No. 4892.
Beer, S. & Loeprick, J. (2015). Profit shifting: drivers of transfer (mis)pricing and the potential of countermeasures. International Tax and Public Finance,22(3), 426–451.
Bernard, A. B., Jensen, J. B., & Schott, P. K. (2006). Transfer Pricing by U.S.-Based Multina-tional Firms. NBER Working Papers No 12493.
Beuselinck, C., Deloof, M., & Vanstraelen, A. (2014). Cross-jurisdictional income shifting and tax enforcement: evidence from public versus private multinationals.Review of Accounting Studies,20(2), 710–746.
Clausing, K. A. (2003). Tax-motivated transfer pricing and US intrafirm trade prices. Journal of Public Economics,87(9), 2207–2223.
Cristea, A. D. & Nguyen, D. X. (2014). Transfer Pricing by Multinational Firms: New Evidence from Foreign Firm Ownership. mimeo.
Davies, R. B., Martin, J., Parenti, M., & Toubal, F. (2015). Knocking on Tax Haven’s Door: Multinational Firms and Transfer Pricing. CEPII Working Paper No 2014-21.
Gower, J. C. (1971). A General Coefficient of Similarity and Some of Its Properties.Biometrics,
27(4), 857–871.
Mescall, D. (2009). How do Transfer Pricing Policies Affect Premia in Cross-Border Mergers and Acquisitions? SSRN Working Paper Series.
Muehlbacher, S., Kirchler, E., & Schwarzenberger, H. (2011). Voluntary versus enforced tax compliance: empirical evidence from the ”slippery slope” framework. European Journal of Law and Economics,32(1), 89–97.
OECD. (2010). Transfer Pricing Guidelines for Multinational Enterprises and Tax Administra-tions.
OECD. (2013). Action Plan on Base Erosion and Profit Shifting.
Overesch, M. (2006). Transfer Pricing of intrafirm sales as a profit shifting channel: evidence from German firm data. ZEW Discussion Papers No 06-84.
Saunders-Scott, M. (2013). How does transfer-pricing enforcement affect reported profits? mimeo. Sokal, R. R. & Michener, C. D. (1958). A Statistical Method for Evaluating Systematic
Rela-tionships. University of Kansas Scientific Bulletin,38, 1409–1438.
Swenson, D. L. (2001). Tax reforms and evidence of transfer pricing. National Tax Journal,
54(1), 7–26.
Appendix
Table of TP Characteristics
Characteristics of TP systems Binary/
Numerical variables
Number of countries presenting the qualitative characteristic
Mean value of the numerical variables
Implementation of TP system:
TP system is incorporated in domestic legislation. Binary 41
TP system follows the arm’s length principle. Binary 43
TP system overrides OECD TP Guidelines. Binary 12
Maturity (years) of TP system. Numerical 15.68
Related-party status:
The related-party status/interdependence: statutory threshold.
Binary 31
The related-party status/interdependence: de facto relationship.
Binary 44
The related-party status/interdependence: common control.
Binary 42
TP system has specific provision on tax havens. Binary 16
TP system has specific provision for permanent establishments (PE).
Binary 19
TP methods:
TP system adopts five conventional OECD methods. Binary 43
TP system adopts country-specific methods. Binary 5
TP system allows for alternative methods. Binary 16
Priority of methods: best for transaction. Binary 26
Priority of methods: traditional transaction methods. Binary 16
Priority of methods: specific domestic rule. Binary 6
Priority of methods: CUP. Binary 9
Foreign comparables are accepted by tax authorities. Binary 40
TP system accepts set-offs/bundled transactions. Binary 13
Provisions on internal services and cost-sharing agreements:
Management fees/head office expenses are
accepted/deductible by TP system/domestic legislation.
Binary 43
TP system/domestic legislation has specific
provision/requirements for management fees/head office expenses.
Binary 19
TP system/domestic legislation levy withholding tax on management fees/head office expenses.
Binary 22
Commissionaire arrangements are accepted/deductible by TP system/domestic legislation.
Binary 40
Cost-sharing/cost-contribution arrangements (CSA/CCA) are accepted/deductible by TP system/domestic
legislation.
TP system/domestic legislation has specific
provision/requirements for cost-sharing/cost-contribution arrangements (CSA/CCA).
Binary 18
TP system/domestic legislation levy withholding tax on cost-sharing/cost-contribution arrangement (CSA/CCA).
Binary 15
Disclosure of TP information:
TP system has specific statutory requirements for TP documentation.
Binary 33
Maturity (years) of statutory requirements for TP documentation.
Numerical 8.22
Disclosure of specific TP return/study is required. Binary 33
Deadline (months from year end) to prepare/disclose TP return.
Numerical 5.28
Disclosure of specific TP return/study is conditioned/does not apply for all taxpayers.
Binary 16
TP return/study includes at most general information on intra-firm transactions (short disclosure).
Binary 17
TP return/study includes TP methods and/or calculation (long disclosure).
Binary 16
TP system determine clear deadline for submission of full TP documentation (when requested).
Binary 40
Deadline (months from year end) to provide full TP documentation (when required)
Numerical 1.05
Statutes of limitations:
Statute of limitations (months) for general TP assessment. Numerical 65.00
TP system/domestic legislation has special statute of limitation for intentional non-compliance.
Binary 23
Statute of limitations (months) for TP assessment in case of intentional non-compliance
Numerical 93.40
TP penalizations:
TP system has specific TP penalizations. Binary 15
Maximum TP penalization (percentage of the unpaid tax) for general tax adjustment
Numerical 0.82
Maximum TP penalization (percentage of the unpaid tax) for tax adjustment due to high level of
negligence/fraud/intentional avoidance
Numerical 1.41
TP system has fixed TP penalty for failure in documentation/info disclosure.
Binary 15
TP system has variable TP penalty for failure in documentation/info disclosure.
Binary 16
TP system allows appeal for penalty relief/reduction. Binary 28
Advanced pricing agreements (APA)/APA-like provisions:
APA/APA-like options are avaliable. Binary 38
Possible roll-back application of APA/APA-like options. Binary 13
APA/APA-like options include unilateral agreement. Binary 35
APA/APA-like options include bilateral/multilateral agreement.
Binary 36
Competent authority (CA) procedures:
CA procedures are effectivelly available. Binary 35
CA procedures are proposed (usually) after tax assessment. Binary 29 CA procedures may be proposed before/during tax
assessment.
Binary 7
Double tax relief is likely to occur via CA procedure. Binary 18
CA procedures prevent/suspend tax payment. Binary 21