Numerical Analysis for the Prediction of Microstructure
after Hot Forming of Structural Metals
Jun Yanagimoto
*Institute of Industrial Science, The University of Tokyo, Tokyo 153-8505, Japan
The importance of structural metals for industrial applications is based on their superior combination of mechanical properties—strength, elongation, toughness and corrosion resistance—achieved at the end of forming processes. A numerical analysis for the prediction of microstructure is strongly required for the optimization of hot forming process parameters, because the microstructure of structural metals, which has the significant effects on mechanical properties, is strongly dependent to forming process conditions as well as the chemical composition. The incremental dislocation density and microstructural evolution analysis method enables the prediction of the change in microstructure after forming. The outline of the analytical scheme is explained briefly, and the results of its application to strip rolling, bar rolling and shape rolling are presented. Finally, the remaining research topics in this field are discussed. [doi:10.2320/matertrans.MF200906]
(Received December 25, 2008; Accepted February 5, 2009; Published June 25, 2009)
Keywords: forming, microstructure, analytical method, finite element method (FEM)
1. Introduction
The most important demand for structural metals is that for good mechanical properties such as high strength, elongation, toughness and corrosion resistance. These prop-erties are governed by the microstructure of formed product. Thus, the optimization of the forming conditions, or forming process parameters, referring to the microstructure of the formed product for the target values, is gaining increasing importance in the research and development of hot forming technologies. The above optimization of forming condition has two aspects of hardware and software technologies. The first one, hardware technologies, such as controlled rolling process, high reduction rolling mill, controlled and rapid cooling system and coiling system, has marked significant progress in the past decades, as has been reviewed by Ouchi.1) The recent tandem hot strip rolling processes
developed by Eto, Fukushima, Sasaki and co-workers2)
enable us to roll a strip of fine grained steel without the need to add any micro-alloying element such as niobium and vanadium. The major achievement of the software technol-ogies is micro-alloying technoltechnol-ogies used to control the change of the microstructure of hot metal being formed, as was reviewed by Ouchi1)and Tamura.3)
The hardware and software technologies should be considered together, even though their individual optimal orientations within industrial applications are mutually opposing. This necessitates the numerical analysis for predicting the microstructure of structural metal after hot forming in order to satisfy both requirements. In the following chapters, first, the outline and availability of the analytical scheme is explained. Here, the basic scheme of the incremental dislocation density and microstructural evolu-tion analysis is briefly explained. Then, the results of its application to strip rolling, bar rolling and shape rolling, which were obtained by the author, will be presented to show the effectiveness of the analytical method of the micro-structural evolution and plastic deformation in the optimiza-tion of the forming process.
2. Analytical Method of Microstructural Evolution and Plastic Deformation in Hot Forming
The analytical method of microstructural evolution is categorized into two groups. The first is the microstructure analysis scheme. It contains the evolutional equation for the analysis of grain structure, which is governed by metal-lurgical phenomena, such as work hardening, recovery and recrystallization of the material, caused by the transient change in the temperature and the strain rate of every material point. This scheme involves the use of the kinetics of microstructural evolution, which is called the material genome, as the boundary conditions in the analysis. The ‘analytical scheme used as the evolutional equation’ and ‘the kinetics used as the material genome’ were not always distinguished in the past. The second group is the deforma-tion analysis scheme such as the finite element method.
2.1 Analytical scheme for the microstructure evolution Sellers and Whiteman4)and Laasraoui and Jonas5)carried
out consistent investigations on microstructural evolution during the hot forming of steels, and the results of the experiments have been summarized as empirical models. Those empirical models have been used for the prediction of the industrial hot rolling process by Beynon and Sellers.6) In their analysis, the ‘analytical scheme used as the evolu-tional equation’ and ‘the kinetics used as the material genome’ were not always distinguished, so that the transient change in temperature and strain rate cannot be reflected in the microstructural change. This is almost the same as other microstructure analysis methods proposed in 1970s and 1980s.
Senuma and Yada7,8) extensively investigated the
meas-urement of the microstructural evolution of C-Si-Mn steels during hot compression, and they found equations on the kinetics of, for example, work hardening, dynamic and static recoveries, dynamic and static recrystallization and grain growth as functions of process variables such as temperature, strain rate and strain.8)They proposed an analytical model to predict the flow stress and microstructural evolution, taking dislocation density as a representative variable.9)They also
*Corresponding author, E-mail: [email protected]
Special Issue on New Functions and Properties of Engineering Materials Created by Designing and Processing
tried to express their model by the differential description aimed at estimating the microstructural evolution and flow stress after transient changes in process variables such as temperature and strain rate. However, their effort was not a total success, because of the insufficiency of numerical solution of their differential form.10)
Finite element analysis of the metal forming process propagated in the 1980s after the pace-setting investigations on microstructural evolution in the hot forming of structural metals by Sellarset al.,4,6)Laasraoui and Jonas,5)Senuma and
Yada7–10) and other researchers. As finite element analysis can reveal the transient changes in temperature and strain rate at each point of the structural metal during forming, we need a new approach to reflect this transient change in process variables in the evolution of microstructure. This movement promoted the development of an evolutional method by Karhausen and Kopp11) and an incremental dislocation
density and microstructural evolution analysis method by Yanagimotoet al.for dynamic events,12)static events13)and
phase transformation.14)
The change in the dislocation density due to work hardening and dynamic recovery is expressed by the following eq. (1), as proposed by Senumaet al.10)
d¼cd"bdt ð1Þ
is an average dislocation density of grains. Because in eq. (1) is that for unrecrystallized grains, it is expressed as0
with the superscript showing the number of recrystallization cycles. V0, which is the volume fraction of the unrecrystal-lized structure, decreases with the progress of dynamic recrystallization, as expressed by
V0ðtþtÞ ¼V0ðtÞ X0!1: ð2Þ
X0!1is the recrystallized fraction within time intervalt. In the same manner, the volume fraction of grains which underwent i-th cycle of dynamic recrystallization at time
tþt,ViðtþtÞ, can be expressed as
ViðtþtÞ ¼ViðtÞ Xi!iþ1þXi1!i: ð3Þ
Here, Xi!iþ1 shows the fraction recrystallized from Vi within time intervalt. The value ofXi!iþ1is expressed as
Xi!iþ1¼ViðtÞ iðtÞ xi!iþ1; ð4Þ
wherexi!iþ1is the relative recrystallized volume fraction andiðtÞis the ratio of volume of grains in ViðtÞ, strain of which exceeds the critical strain for the onset of the next cycle of recrystallization to volumeViðtÞ.iðtÞandxi!iþ1 can be derived from the equation for the progress of dynamic recrystallization from the unrecrystallized grains.12) Thus, the average dislocation density and grain size ofViðtþtÞ
are respectively updated incrementally by
iðtþtÞ ¼ 1
ViðtþtÞfV
iðtÞðiðtÞ þiÞ
þXi1!iDg ð5Þ
diðtþtÞ ¼
1
ViðtþtÞfV
i
ðtþtÞðdiðtÞ þdiÞ
þXi1!idDg: ð6Þ
diðtÞ is the average grain size of austenite grains that
underwent thei-th cycle of recrystallization at timet.Dand
dDare the dislocation density and grain size of dynamically recrystallized grains, respectively. The value ofDequals to the dislocation density of annealed grains. A similar scheme could be applied to the analysis of the microstructure and dislocation density after static recrystallization.13)
The incremental dislocation density and microstructural evolution analysis method is also applicable to phase transformation14)based on conventional nucleation and grain
growth theory.9,15) The increment in the ferrite volume
fraction, X, can be expressed by eqs. (7) and (8) for the nucleation stage and the site saturation stage.
XðtÞ ¼4 3
1=4
ðIðtÞSv1Þ1=4ðGðtÞÞ3=4
ln 1
1XðttÞ
3=4
ð1XðttÞÞt ð7Þ
XðtÞ ¼K1Sv2GðtÞð1XðttÞÞt ð8Þ
Here,IðtÞis the rate of nucleation,GðtÞis the grain growth rate and K1 is the material constant. Sv1 and Sv2 are the effective grain boundary area for nucleation stage and grain growth stage, respectively. The rate of nucleation IðtÞ is affected by the residual dislocation density of grains,, due to prior deformation, as expressed by eq. (9). The left-hand side of eq. (9), I0ðtÞ, is substituted into eq. (7) in place of
IðtÞ. The ferrite grain size,d, is expressed by eq. (10).
I0ðtÞ ¼
DIðtÞ ð9Þ
d¼ 1:221010d1:75
D
0:25
exp 21430
T0:05
X
( )1=3
ð10Þ
Here,T0:05 is the temperature at 5% transformation and is a representative parameter of cooling rate. Numerical analysis using eqs. (1)–(10) with transient changes in the strain rate and temperature along stream line, that is the path of every material point at cross-section of metal subjected to plastic deformation during rolling, give us the results on micro-structure and dislocation density of metal under hot forming.
2.2 Deformation analysis
Metal forming has two major functions: the first is the generation of product geometry, and the second is the generation of mechanical properties. The generation of product geometry is realized by designing the die profile and forming conditions for the material to be formed, and the deformation analysis of the material being formed is of primary importance. From the beginning of the 20th century, the elementary analysis and other analyses for the stress field of the material being formed had been developed and applied to reveal the deformation characteristics and to design the forming conditions. Such analyses can be represented by the two-dimensional rolling theory proposed by Karman16)and
the virtual rolling mill to replace the model experiment using lead or plasticine with digital data on a personal computer. The computer aided engineering (CAE) system for the metal forming process is now widely used in metal forming industries. With this system, the three-dimensional distribu-tion of strain rate and temperature can be analyzed, and their transient change can be known, even that inside the material. Then, the challenging target for these CAE systems is to simulate the evolution of the microstructure of the metal, because the microstructure generated during hot forming has significant effects on the mechanical properties of the product.
2.3 Microstructure analysis during hot forming induced by hot deformation
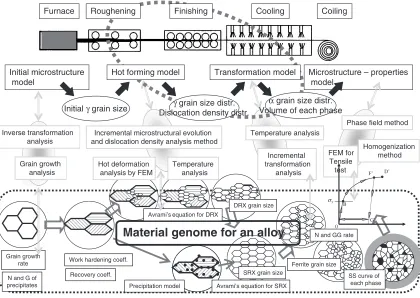
The general construction of the analytical scheme is illustrated in Fig. 2, taking the hot strip rolling of a steel sheet as an example. A sketch of the microstructural evolution is also shown in this figure. The whole analytical scheme for the analysis of the microstructural evolution is divided into several components: initial microstructure model, hot form-ing model, transformation model and microstructure-prop-erty model. The microstructure-propmicrostructure-prop-erty model is still the focus of many basic investigations, but no general approach is available. The hot forming model and transformation model are coupled with the three-dimensional finite element analysis of various rolling processes. Figures 3 and Table 1 show the results of applying microstructural analysis to the strip rolling process to elucidate the effect of the thickness
reduction balance of the finishing train of hot strip mill on the final microstructure after transformation, as obtained by Morimotoet al.22)Large thickness reductions at latter stands
in the finishing train yield steel strips with finer grains. The analytical results agree well with the experimental measure-ments. Here, the incremental dislocation density and micro-structural evolution analysis method are used to estimate the dislocation density and microstructure in forming,12)
inter-pass13) and transformation.14) Figure 4 shows examples for
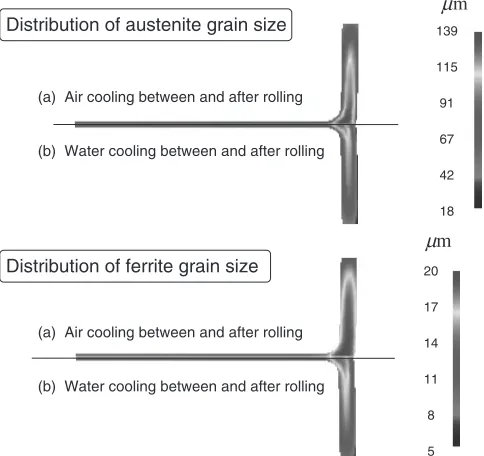
bar rolling.23)Here, the effect of the rolling mill type on the austenite grain distribution during rolling is clearly shown. Also, the cross-sectional distribution of final microstructure after cooling is successfully simulated. Figure 6 shows the examples of the shape rolling illustrated in Fig. 5. The cooling condition between and after stands has a significant effect on the cross-sectional distribution of microstructure after rolling.24)
3. Current Situation and Remaining Issue
As is presented in the following chapter, several results were obtained through the coupled analysis of plastic deformation and microstructure. The general scheme of such coupled analysis is shown in the Fig. 2. First of all, the microstructure-property model, which is not yet realized, is shown in Fig. 2. There are empirical equations presented and summarized by Pickering,25) but we did not know the general method at present, even though extensive researches has long been carried out in this field by Esakaet al.26)and
Profile of caliber
Nodal points for FE analysis
Angle ChannelChannelChannelChannelChannelChannel
Asym. Sec. Asym. Sec.Asym. Sec. Asym. Sec.Asym. Sec.
Asym. Sec.
Asym. Sec. Asym. Sec.Asym. Sec. Asym. Sec.Asym. Sec.
Asym. Sec.
[image:3.595.75.525.69.407.2]Tomotaet al.,27)for example. Many more investigations are
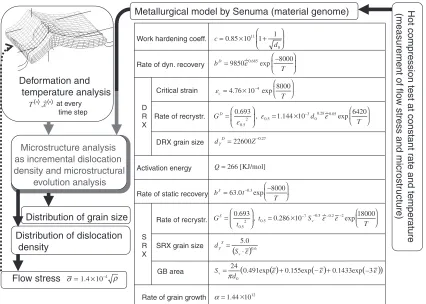
necessary to clarify the relationship between the micro-structure and mechanical properties of the structural metals used in current society. Secondly, the material genome, that is, the empirical equation to describe, for example, work hardening, recovery and recrystallization as functions of strain rate, strain and temperature for each alloy composition, are missing in most of the structural steels. An example of material genome obtained by Senuma and Yada7)is summa-rized in Fig. 7. As was explained earlier, deformation analysis to obtain the transient change in strain rate and temperature for the material being formed is in practical use in several rolling processes. A microstructure analysis
method, such as the incremental dislocation density and microstructure evolution analysis method, is proposed and applied to estimate the microstructure affected by the transient change in strain rate and temperature, using the material genome as the boundary condition. Then, we lack the material genome to describe, for example, work hardening, recovery and recrystallization as functions of strain rate, strain and temperature for each alloy composition. As numerous commercial structural metals are used, we require a huge number of experiments to obtain the material genome. This aspect is common to the first problem, which is the lack of a general model to connect the microstructure and mechanical properties. Then, it can be emphasized that
Microstructure – properties model
Initial γgrain size Dislocation density distr.γgrain size distr. α
grain size distr. Volume of each phase
Furnace Roughening Finishing Cooling Coiling
Initial microstructure model
Hot forming model Transformation model
Incremental microstructural evolution and dislocation density analysis method
Temperature analysis Hot deformation
analysis by FEM
Temperature analysis
Incremental transformation
analysis
Precipitation model
Phase field method
FEM for Tensile test
Homogenization method
Material genome for an alloy
Avrami’s equation for DRX
Avrami’s equation for SRX
N and GG rate
Work hardening coeff.
Recovery coeff. SS curve of
each phase Grain growth
rate
N and G of precipitates
Ferrite grain size SRX grain size
0
D’
B F’
G’
Y σ Grain growth
analysis Inverse transformation
analysis
DRX grain size
Fig. 2 Integrated model for the evolution of microstructure in hot forming.
Ferrite grain size
dα
/
µ
m
Volume fraction of each phase
Time on run-out table after final stand TROT/ s Schedule A
Schedule B
Predicted value Measured value
Measured grain size for schedule A
Predicted grain size
Measured grain size for schedule B
Schedule A (conventional): Higher reductions in earlier stand in FT
Schedule B (new): High reductions in latter stands in finishing trains
Time on run-out table after final stand TROT/ s
[image:4.595.88.508.73.371.2] [image:4.595.86.508.404.601.2]innovative numerical methods of describing (1) the micro-structure-mechanical property relationship, and (2) the kinetics of the change in microstructure as functions of strain rate and temperature, will be strongly required in the near future. These methods should enable the prediction of the above values for the complicated and diversified composition of microstructures, which are dependent on the chemical composition of the numerous commercial alloys.
4. Conclusion
The numerical analysis of microstructure after the hot forming of structural metals was explained in this paper.
[image:5.595.47.550.79.428.2]Because of the difficulties and complexity of the numerical scheme, the practical application of this kind of consistent model to industrial processes is not always promoted, as was discussed by Bariani and co-workers,28) particularly by Table 1 Rolling conditions for strip rolling.
Rolling condition
Finisher entry temperatureTi/C
Finisher exit temperature
Te/C
Coiling temperature
Tc/C
Finisher inletting speedVi
/mms1
Schedule A 1100 850 650 780
New
schedule B 1000 750 550 510
Rolling Bar Thickness of rolled strip and reduction in each stand
condition thickness F1 F2 F3 F4 F5 F6
Schedule A 30.4 mm 15.6 mm 8.7 mm 5.5 mm 3.5 mm 2.5 mm 2.0 mm
48% 44% 37% 36% 29% 20%
Schedule B 40.2 mm 24.8 mm 15.6 mm 10.5 mm 6.3 mm 3.7 mm 2.3 mm
38% 37% 33% 40% 41% 38%
µ
Three-roll mill
m
(
)
Two-roll mill
Fig. 4 Austenite grain size distribution in rolled bar. Area reduction is 52% after four forming passes, and initial grain size is 80mm.
R1 R2 R3
U1 E1 U2 U3 E2 U4
U5 E3 UF
IMC device TMCP device
H
R
HF HW HF
HW
8°
20m 20m
40m 5m 50m
30m
Fig. 5 Mill layout and cooling system of H-beam rolling.
m m
(a) Air cooling between and after rolling
(b) Water cooling between and after rolling
Distribution of austenite grain size
(a) Air cooling between and after rolling
(b) Water cooling between and after rolling
139
115
91
67
42
18
Distribution of ferrite grain size 20
17
14
11
8
5 µ
µ
[image:5.595.50.286.461.581.2] [image:5.595.306.548.462.690.2]forming scientists and engineers. More sophisticated soft-ware, built on the CAD platform, for predicting the micro-structure and macroscopic deformation in industrial hot forming processes should be realized. There are two major drawbacks that must be solved: the lack of the material genome, or functions for the kinetics of recovery and recrystallization, and the microstructure-mechanical proper-ties relationships for an alloy being formed. Extensive investigations on these topics are expected, probably using the numerical approach. Resolving these issues will open a new era of manufacturing science, where the simultaneous design and optimization to produce products with high performance will be realized for all structural metal used in social activities.
REFERENCES
1) C. Ouchi: ISIJ Int.41(2001) 542–553.
2) M. Eto, S. Fukushima, T. Sasaki, Y. Haraguchi, K. Miyata, M. Wakita, T. Tomida, N. Imai, M. Yoshida and Y. Okada: ISIJ Int.48(2008) 1142–1147.
3) I. Tamura: Trans. ISIJ27(1987) 763–779.
4) C. M. Sellars and J. A. Whiteman: Metal Sci.13(1979) 187–194. 5) A. Laasraoui and J. J. Jonas: ISIJ Int.31(1991) 95–105. 6) J. H. Beynon and C. M. Sellars: ISIJ Int.32(1992) 359–367. 7) H. Yada, N. Matsuzu, K. Nakajima, K. Watanabe and H. Tokita: Trans.
ISIJ23(1983) 100–109.
8) T. Senuma, H. Yada, Y. Matsumura and T. Futamura:Tetsu-to-Hagane
70(1984) 2112–2119.
9) T. Senuma, M. Suehiro and H. Yada: ISIJ Int.32(1992) 423–432. 10) T. Senuma, H. Yada, Y. Matsumura, S. Hamauzu and K. Nakajima:
Tetsu-to-Hagane70(1984) 1392–1399.
11) K. Karhausen and R. Kopp:Steel Research63(1992) 247–256. 12) J. Yanagimoto, K. Karhausen, A. J. Brand and R. Kopp:Trans. ASME,
J. Manufact. Sci. Eng.,120(1998) 316–322.
13) J. Yanagimoto and J. S. Liu: ISIJ Int.39(1999) 171–175. 14) J. S. Liu and J. Yanagimoto: ISIJ Int.41(2001) 1510–1516. 15) M. Suehiro, K. Sato, Y. Tsukao, H. Yada, T. Senuma and Y.
Matsumura: Trans. ISIJ27(1987) 439–445.
16) T. Karman:Zeitschrift fu¨r Angewandte Mathematik und Mechanik5 (1925) 139–141.
17) E. Orowan:Proc. Inst. Mech. Eng.150(1943) 140–167. 18) K. Mori and K. Osakada:Int. J. Mech. Sci.24(1982) 519–527. 19) K. Mori, K. Osakada and T. Oda:Int. J. Mech. Sci.26(1984) 515–525. 20) Y. Sodani, T. Hirakawa, K. Ikui, M. Hatanaka and K. Mori:
Tetsu-to-Hagane79(1993) 424–430.
21) J. Yanagimoto, Y. Kadomura, T. Muto and K. Inoue:Steel Research73 (2002) 526–530.
22) T. Morimoto, I. Chikushi and J. Yanagimoto: ISIJ Int.47(2007) 1475– 1484.
23) J. Yanagimoto, T. Ito and J. S. Liu: ISIJ Int.40(2000) 65–70. 24) J. S. Liu and J. Yanagimoto: ISIJ Int.42(2002) 868–875.
25) F. B. Pickering:Physical Metallurgy and the Design of Steels(Elsevier 1978).
26) K. Esaka, J. Wakita, M. Takahashi, O. Kono and S. Harada: Seitetsu-Kenkyu 321 (1986) 92–104.
27) Y. Tomota, K. Kuroki, T. Mori and I. Tamura: Mater. Sci. Eng.24 (1976) 85–94.
28) P. F. Bariani, T. Dal Negro and S. Bruschi S: CIRP Annals53(2004) 573–595.
c
d
=0.85 10111+ 1
0
b
T
D=9850ε0.685exp –8000
εc
T
=4.76 10–4exp 8000
= = T d
GD 6420
exp 10 1.144 , 693 .
0 0.28 0.05
0 –3 0.5 2 0.5 ε ε ε dD
=22600 –0.27
b
T
S=63.0–0.3exp –8000
= = T S t t G v S 18000 exp 10 0.286 ,
0.693 –7 –0.5 –0.2 –2
0.5 2 0.5 ε ε ( 0.6 5.0 ε γ · = v S S d
α=1.44 1012
Q=266 [KJ/mol]
Metallurgical model by Senuma (material genome)
Work hardening coeff.
Rate of dyn. recovery
Critical strain
D
R Rate of recrystr. X
DRX grain size
Activation energy
Rate of static recovery
Rate of recrystr.
S
R SRX grain size X
GB area
Rate of grain growth
(
(0.491expε ε ε
π –3
24
0
+ 0.1433exp(
+ 0.155exp(
= d Sv Deformation and temperature analysis at every time step n n
T ,ε
Distribution of grain size
Flow stress σ= 1.4 10–4
Microstructure analysis as incremental dislocation density and microstructural
evolution analysis
Hot compression test at constant r
ate and temper
ature
(measurement of flo
w stress and microstr
ucture)
Distribution of dislocation density t Z ) × ˙ ˙ ˙ × × × ˙ γ ) ) – ) ) × × ρ
[image:6.595.86.512.71.375.2]