Development of High Modulus Ti
Fe
Cu Alloys for Biomedical Applications
Ken Cho
1,+1, Mitsuo Niinomi
1, Masaaki Nakai
1, Junko Hieda
1and Yuuki Kawasaki
2,+2 1Institute for Materials Research, Tohoku University, Sendai 980-8577, Japan2Department of Metallurgy, Materials Science, and Materials Processing, Tohoku University, Sendai 980-8579, Japan
TiFeCu alloys with higher Young’s modulus, hardness and compressive mechanical properties than those of the existing Ti alloys were developed using ad-electrons alloy design method in order to improve Young’s modulus, hardness and compressive properties of Ti and existing Ti alloys for use as metallic stents. Their microstructures, Young’s modulus, hardness and compressive mechanical properties were investigated both before (as-cast) and after heat-treatments performed under a high-purity argon atmosphere at 1173 K for 21.6 and 86.4 ks.
The studied TiFeCu alloys consist of the¢-Ti phase and dendritic TiFe intermetallic phase. Moreover, the area fraction of the TiFe intermetallic phase increases with increasing atom ratio (Fe+Cu)/Ti of the alloys and with the heat-treatment time.
The Young’s modulus of the studied TiFeCu alloys increases from 110 GPa (Ti78Fe18Cu4alloy) to 145 GPa (Ti68Fe30Cu2alloy) with
increasing atom ratio (Fe+Cu)/Ti of the alloys and the area fraction of the TiFe intermetallic phase. However, the Young’s modulus is saturated or slightly decreased when the area fraction of the TiFe intermetallic phase is more than 34%. The Vickers hardness of the as-cast alloys increases from 490 HV (Ti78Fe18Cu4alloy) to 550 HV (Ti63.4Fe30Cu6.6alloy) with increasing atom ratio (Fe+Cu)/Ti of the alloys and area
fraction of the TiFe intermetallic phase. On the other hand, the Vickers hardness of the heat-treated alloys is lower than that of the as-cast alloys, despite the increase in the area fraction of the TiFe intermetallic phase after the heat-treatment. The heat-treated alloys have better compressive properties than those of the as-cast alloys and the reported TiFeCu alloys. The compressive strength and strain of the heat-treated Ti67Fe27Cu6
alloys reach to 2131 MPa and 24.5%, respectively. [doi:10.2320/matertrans.M2012361]
(Received October 29, 2012; Accepted January 21, 2013; Published March 1, 2013)
Keywords: biomedical titanium alloy, high Young’s modulus titanium alloy, intermetallic phase, compressive properties
1. Introduction
Titanium (Ti) and its alloys such as commercially pure Ti
(CP-Ti) and (¡+¢)-type Ti6Al4V (mass%, Ti64) ELI
alloy have been widely used for orthopedic surgical implant
devices including artificial hip joints1) and spinal fixation
devices2)as well as for dental implant devices.3)Moreover,
¢-type Ti alloys including Ti29Nb13Ta4.6Zr alloy (mass%,
TNTZ)4)and Ti24Nb4Zr7.9Sn alloy (mass%)5)have been
developed as low Young’s modulus Ti alloys in order to
overcome the significant problem of the bone absorption
induced by stress shielding due to mismatch between
Young’s moduli of the bone and implant devices.6)Young’s
modulus of TNTZ is approximately 60 GPa,7)which is much
closer to that of the bone (1030 GPa)8)than those of existing
Ti alloys.
On the other hand, a high Young’s modulus, high hardness,
high compressive strength and high ductility are required for
the materials used for metallic stents.9) This is because
metallic stents must expand in the vessel and support the
vessel wall. Stainless steel 316L (316L SS) and CoCr-based
alloys have higher Young’s moduli (210 GPa for 316L SS
and 200240 GPa for CoCr-based alloys)10,11)as compared
to those of Ti and its alloys (60120 GPa).10)Therefore, 316L
SS and CoCr-based alloys are mainly used for metallic
stents. However, Ti and its alloys have high potential as materials for metallic stents because of their excellent biocompatibility and corrosion resistance. Moreover, metallic stents made of Ti and its alloys are expected to reduce magnetic resonance imaging (MRI) artifacts, which are
caused by metallic stents made of 316L SS and Co
Cr-based alloys. This is because Ti has a lower susceptibility
to MRI artifacts of (180©10¹6)12) than that of 316L SS
(3380©10¹6)13) or CoCr-based alloys (1370©10¹6 for
CoCrMo alloy).14) Therefore, new Ti alloys with higher
Young’s modulus, higher hardness, higher compressive
strength and higher ductility as compared to those of existing Ti alloys should be developed for metallic stents.
Das et al. have reported that Ti51.5Fe48.5 alloy (at%),15)
which has a B2-structured TiFe intermetallic phase, has a
higher Young’s modulus (222 GPa) as compared to those of
existing Ti alloys. Moreover, Louzguineet al.have reported
that Ti65Fe35alloy (at%),16)TiFeCo alloys,17,18)and TiFe
Cu alloys19)have higher compressive strengths as compared
to those of Ti and existing Ti alloys as a result of formation
of the TiFe intermetallic phase in¢-Ti phase. Table 1 shows
the compressive strength and compressive strain of as-cast
Ti65Fe35alloy, as-cast TiFeCo alloys and as-cast TiFeCu
alloys reported by Louzguine et al.1619) As shown in
Table 1, Ti65Fe35 alloy, Ti70Fe15Co15 alloy, Ti70Fe17Co13
alloy, Ti66Fe19Co15 alloy, Ti66Fe17Co17 alloy and Ti60Fe20
-Co20 alloy (at%) all have compressive strengths over
2000 MPa. In addition, these TiFeCo alloys also exhibit
compressive strains of over 15% along with their high
compressive strength. This is because the addition of Co decreases bond order of the TiFe intermetallic phase.
Although Young’s moduli of these TiFeCo alloys were
not measured, these good compressive properties indicate
that TiFeCo alloys can be expected to be suitable materials
for metallic stents. However, there is significant concern
that the susceptibility to MRI artifacts of the Ti alloys will be increased by the addition of Co, because Co is a ferromagnetic material. On the other hand, addition of Cu is even more effective in decreasing the bond order of the TiFe intermetallic phase than is Co. Moreover, the addition of Cu could also reduce the susceptibility to MRI artifacts
of the TiFe alloys, because Cu is a diamagnetic material.
+1Corresponding author, E-mail: k_cho@imr.tohoku.ac.jp +2Graduate Student, Tohoku University
Therefore, Louzguine et al.19) have investigated the
com-pressive strength and strain of Ti66Fe22Cu12 alloy and
Ti72Fe14Cu14 alloy (at%), which have Cu contents close to
the Co contents of the reported TiFeCo alloys. However,
the compressive strains of the Ti66Fe22Cu12 alloy and
Ti72Fe14Cu14 alloy are less than 6%, as shown in Table 1.
These results suggest that it is necessary to select the Cu contents more carefully in order to improve the ductility of
TiFeCu alloys.
The purpose of this study is to develop new TiFeCu
alloys with high ductility along with higher Young’s
modulus, higher hardness and higher compressive strength as compared to those of existing Ti alloys. These mechanical properties of alloys are determined by microstructure, which is controlled by both alloy compositions and thermal or mechanical processing. In this study, the alloy compositions
of the studied TiFeCu alloys were designed using a
d-electrons alloy design method with the bond orderd-orbital
level (BoMd) diagram.20) The d-electrons alloy design
method is one of the most effective methods for designing the alloy compositions of Ti alloys. This is because the bond
order andd-electron level have important effects on various
properties of the alloys including the mechanical properties and corrosion properties. Actually, it is impossible to con-sider the effects of thermal or mechanical processing on microstructures and mechanical properties of the alloys using the d-electrons alloy design method. However, microstruc-tures and mechanical properties of alloys, which were subjected same thermal or mechanical processing, generally depend on alloy compositions. Therefore, it is possible to think that mechanical properties of as-cast alloys are basic mechanical properties of the alloys. The mechanical proper-ties of as-cast alloys were used to guide for selecting alloys composition.
The mechanical properties of the studied TiFeCu alloys
before (as-cast) and after heat-treatment were investigated and compared to those of existing Ti alloys, 316L SS and
CoCr-based alloys.
2. Materials and Experimental Procedures
2.1 Material design and preparation
The alloy compositions of the studied TiFeCu alloys
were selected using a d-electrons alloy design method.
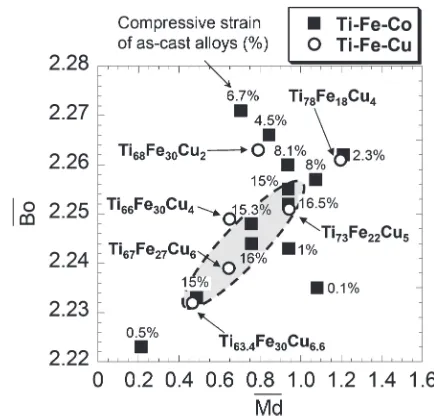
Figure 1 shows the BoMd diagram of the reported Ti
FeCo alloys and the studied TiFeCu alloys, which was
calculated using a DV-X¡ cluster method.21,22) Moreover,
the compressive strain of reported as-cast TiFeCo alloys
is shown in Fig. 1 as a basic compressive strain of the
TiFeCo alloys. As shown in Table 1 and Fig. 1, the Ti
FeCo alloys that have comparatively high compressive
properties (over 15% compressive strain with a maximum
compressive strength near or over 2000 MPa) are grouped
in a certain area of Fig. 1 (2.230<Bo<2.256 and
0.4<Md<1.0). Therefore, the alloy compositions of the
studied TiFeCu alloys were selected to be inside and
around this area.
Ti78Fe18Cu4 alloy, Ti73Fe22Cu5 alloy, Ti68Fe30Cu2 alloy,
Ti67Fe27Cu6 alloy, Ti66Fe30Cu4 alloy and Ti63.4Fe30Cu6.6
alloy (at%) ingots were prepared from sponge Ti (99.7%),
wire Fe (99%) and high-purity Cu (99.99%) using an arc-melting method under a high-purity argon atmosphere. The
alloy composition and atom ratio (Fe+Cu)/Ti of each alloy
are listed in Table 2. All alloys were subjected to the heat-treatment under a high-purity argon atmosphere at 1173 K
for 21.6 ks followed by air cooling. Furthermore, Ti68Fe30Cu2
alloy, Ti67Fe27Cu6 alloy, Ti66Fe30Cu4 alloy, alloy and
Ti63.4Fe30Cu6.6 alloy were subjected to the heat-treatment
under a high-purity argon atmosphere at 1173 K for 86.4 ks followed by air cooling.
2.2 Material characterization
The phase constitutions of the studied TiFeCu alloys
were investigated using an X-ray diffraction (XRD) analysis. The XRD analysis was carried out using a Cu target with an accelerating voltage of 40 kV and a tube current of 40 mA. The specimens for XRD analysis were wet-polished using
[image:2.595.315.532.68.277.2]Fig. 1 Bond orderd-orbital level (BoMd) diagram of reported TiFeCo and studied TiFeCu alloys, along with compressive strain of reported as-cast TiFeCo alloys.
Table 1 Compressive properties of reported as-cast TiFeCo and as-cast TiFeCu alloys.
As-cast
Alloy (at%) ·(MPa) ¾(%)
Ti65Fe35 2220 6.7
Ti68Fe27Co5 1920 4.5
Ti70Fe20Co10 1890 8.1
Ti76Fe12Co12 1690 2.3
Ti73Fe13.5Co13.5 1875 8
Ti70Fe15Co15 2350 16.5
Ti70Fe17Co13 2035 15
Ti66Fe19Co15 2160 15.3
Ti66Fe17Co17 1935 16
Ti60Fe20Co20 2100 15
Ti54Fe23Co23 905 0.5
Ti70Fe10Co20 1640 1
Ti66Fe22Cu12 2110 5.5
Ti72Fe14Cu14 1940 5.5
·cmax: Compressive strength
[image:2.595.47.292.103.294.2]waterproof emery papers of up to#4000 grit and a colloidal
SiO2 suspension.
The microstructures of the studied TiFeCu alloys were
observed using a scanning-electron microscopy (SEM) and an optical microscopy. The alloying element distribution was investigated using an energy dispersive X-ray spectroscopy (EDX). For microstructural observations using an optical microscopy, an SEM and a EDX, the specimens etched using
a 5% HF etching solution for 10 s after wet-polished using
waterproof emery papers of up to #4000 grit and
buff-polished using a colloidal SiO2 suspension were used.
Furthermore, SEM and EDX were operated at an accelerating voltage of 40 kV.
2.3 Mechanical tests
The Young’s modulus measurement was carried out at
room temperature in air using a free resonance method.
For Young’s modulus measurements, plate specimens with a
width of 10 mm, a length of 40 mm and a thickness of 1.5 mm
wet-polished using waterproof emery papers of up to#1500
grit were used.
The hardness measurement was carried out using a micro-Vickers hardness tester with a load of 9.807 N for a dwell time of 15 s. The diagonal length of indentation was approximately 60 µm. For hardness measurements, square
specimens with a square of 5 mm©5 mm and a thickness of
1.5 mm wet-polished using waterproof emery papers of up
to #4000 grit and buff-polished using a colloidal SiO2
suspension were used.
The compressive properties of the studied TiFeCu alloys
were evaluated using an Instron-type testing machine with a
cross-head speed of 6.0©10¹6m·s¹1 at room temperature.
For mechanical compressive tests, bar specimens with a length of 7.5 mm and a diameter of 3 mm wet-polished using
waterproof emery papers of up to #1500 grit were used.
3. Results and Discussion
3.1 Material characterization 3.1.1 Phase constitution
Figure 2 shows XRD profiles of the studied TiFeCu
alloys before heat-treatments (as-cast). As shown in Fig. 2,
the diffraction peaks of ¢-Ti and, the (110), (200) and (211)
diffraction peaks (hereafter peak) of the TiFe intermetallic
are detected from the studied TiFeCu alloys. This result
suggests that the studied TiFeCu alloys consist of the¢-Ti
phase and TiFe intermetallic phase.
Figure 3 shows the XRD profiles of the Ti67Fe27Cu6alloy,
chosen as a typical TiFeCu alloy, before (as-cast) and after
heat treatments at 1173 K for 21.6 and 86.4 ks. The phase
constitution of the Ti67Fe27Cu6alloy after the heat-treatment
is as same as that of the as-cast alloy. However, the (110)
peaks of the ¢-Ti of the heat-treated alloys are shifted to a
lower angle than that of the as-cast alloy. This result suggests
that lattice parameter of the ¢-Ti phase becomes larger than
that of the as-cast alloy.
3.1.2 Microstructure and alloying element distribution
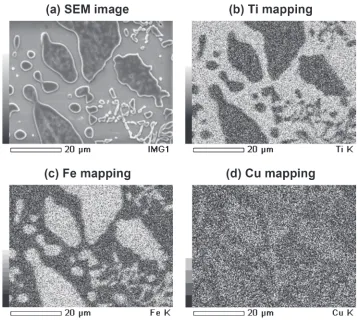
Figure 4(a) shows an SEM image of the Ti67Fe27Cu6alloy
before the heat-treatment (as-cast). And Figs. 4(b), 4(c) and 4(d) show the corresponding EDX mapping images for Ti, Fe and Cu, respectively. As shown in Fig. 4(a), two different areas (light gray area and dark gray area) exist in the studied
TiFeCu alloys. The mapping images for Ti, Fe and Cu
demonstrate that the round light gray area has a high Ti content, whereas the dark gray area has high Fe and Cu contents. These alloying element distributions and XRD
results suggest that the light gray area is the¢-Ti phase and
[image:3.595.318.533.72.233.2]the dark gray area is the TiFe intermetallic phase. Figure 5 shows the variations in the (a) Ti, (b) Fe and (c) Cu contents
Table 2 Chemical compositions and atom ratio (Fe+Cu)/Ti of studied TiFeCu alloys.
As-cast
Alloy Composition (at%) Atom ratio
(Fe+Cu)/Ti
Fe Cu O N Ti
Ti78Fe18Cu4 17.9 4 0.16 0.009 Bal. 0.28
Ti73Fe22Cu5 22.1 5 0.2 0.019 Bal. 0.37
Ti68Fe30Cu2 29.8 2 0.14 0.009 Bal. 0.47
Ti67Fe27Cu6 27 6.1 0.19 0.009 Bal. 0.49
Ti66Fe30Cu4 29.8 4 0.16 0.008 Bal. 0.52
Ti63.4Fe30Cu6.6 29.9 6.6 0.17 0.009 Bal. 0.58
Fig. 2 XRD profiles of studied TiFeCu alloys before heat-treatment (as-cast).
Fig. 3 XRD profiles of studied Ti67Fe27Cu6alloy before (as-cast) and after
[image:3.595.47.292.104.211.2] [image:3.595.319.533.288.448.2]of the Ti67Fe27Cu6 alloy measured for the ¢-Ti phase and
TiFe intermetallic phase as a function of the heat-treatment
time. The Ti and Fe contents of the ¢-Ti phase and TiFe
intermetallic phase are almost constant even after heart-treatments at 1173 K for 21.6 and 86.4 ks. On the other hand,
the Cu content decreases by approximately 10.1%in the¢-Ti
phase area and slightly increases by approximately 1.3% in
the TiFe intermetallic phase area after the thermal treatment at 1173 k for 86.4 ks. These differences between the Cu contents of the as-cast alloy and heat-treated alloys affect the
lattice parameter of the ¢-Ti phase, which was observed to
change using an XRD.
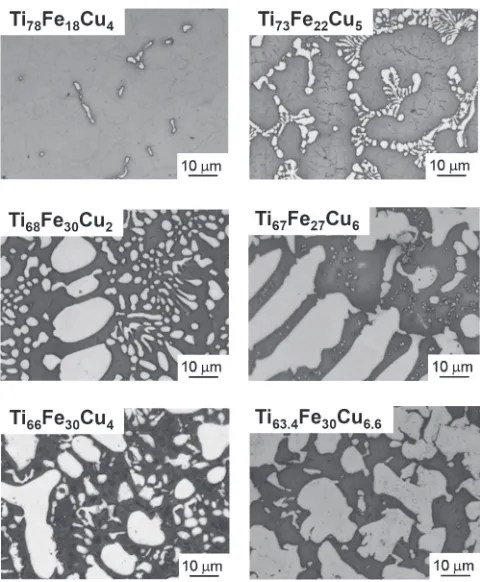
Optical micrographs of the studied TiFeCu alloys before
the heat-treatment (as-cast) are shown in Fig. 6. The white areas with dendritic structures in the optical micrographs correspond to the dark gray area in the SEM image. In other words, the white areas in the optical micrographs correspond to the TiFe intermetallic phase. Figure 7 shows area fractions
of the TiFe intermetallic phase for the studied TiFeCu
alloys before (as-cast) and after the heat-treatment, as determined from the optical micrographs. The area fraction
of the TiFe intermetallic phase increases significantly from
1.5% (Ti78Fe18Cu4 alloy) to 49.2% (Ti63.4Fe30Cu6.6 alloy)
with increasing atom ratio (Fe+Cu)/Ti of the alloys. This
result is in good agreement with the XRD results. Moreover, area fraction of the TiFe intermetallic phase increases after
the heat-treatment for all studied TiFeCu alloys. In a
typical example, the area fraction of the TiFe intermetallic
phase of the Ti67Fe27Cu6 alloy increases from 40.8 to 44%
after the heat-treatment for 86.4 ks.
3.2 Mechanical properties 3.2.1 Young’s modulus
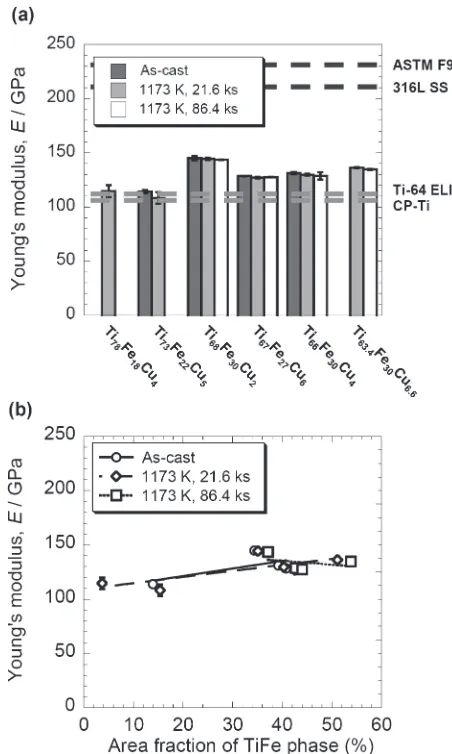
Figure 8 shows the Young’s moduli of the studied TiFe
Cu alloys (a) before (as-cast) and after the heat-treatment and (b) as a function of the area fraction of the TiFe
intermetallic phase. Note that the Young’s moduli of the
as-cast and heat-treated Ti78Fe18Cu4 alloy and the as-cast
Ti63.4Fe30Cu6.6 alloy were not investigated here. This is
because these alloys are much more brittle than the other
studied TiFeCu alloys, which made it impossible to
prepare specimens for the Young’s modulus measurement.
D. Dyjaet al.reported hardness and brittleness of alloys are
increased by formation of nano-size precipitates phase.23)
This report suggests that there is possibility of formation
of nano-size precipitates, which is difficult to verify using a
SEM observation.
As shown in Fig. 8(a), the measured Young’s moduli of
the studied TiFeCu alloys are from 110 to 145 GPa. The
highest is found to be that of the as-cast Ti68Fe30Cu2 alloy
(145 GPa). This value is less than those of the main materials
used for metallic stents, ASTM F90 (230 GPa)24)and 316L
SS (210 GPa).10) However, this value is much higher than
those of CP-Ti (105 GPa)25)and Ti64 ELI (110 GPa).26)Das
et al. have reported that Young’s modulus of Ti51.5Fe48.5
(which has a single TiFe intermetallic phase) is 222 GPa.15)
This report supports the conclusion that the high Young’s
modulus of the Ti68Fe30Cu2 alloy is due to the formation
of the TiFe intermetallic phase. However, the changes in
Young’s moduli of the studied TiFeCu alloys do not
depend only on the area fraction of the TiFe intermetallic
Fig. 4 SEM and EDX mapping images of studied Ti67Fe27Cu6alloy before heat-treatment (as-cast): (a) SEM image and (b)(d) EDX
[image:4.595.119.477.67.387.2]phase. The Young’s moduli are saturated or slightly decreas-ed when the area fraction of the TiFe intermetallic phase is
more than 34%, as shown in Fig. 8(b). The Young’s moduli
of the as-cast and heat-treated Ti66Fe30Cu4 alloy and
Ti67Fe27Cu6 alloy and that of the heat-treated Ti68Fe30Cu2
Fig. 5 Variations in (a) Ti, (b) Fe and (c) Cu composition of studied Ti67Fe27Cu6alloy measured in areas corresponding to¢-Ti phase and
TiFe intermetallic phase as a function of heat-treatment time.
Fig. 6 Optical micrographs of studied TiFeCu alloys before heat-treatment (as-cast).
[image:5.595.126.467.70.410.2] [image:5.595.323.526.469.657.2] [image:5.595.49.289.471.762.2]alloy are less than that of the as-cast Ti68Fe30Cu2 alloy,
despite the high area fraction of the TiFe intermetallic phase.
This is because the bond order of the Ti68Fe30Cu2 alloy is
higher than that of the other studied TiFeCu alloys, as
shown in Fig. 1. Moreover, the decrease in the Young’s
modulus after the heat-treatment is caused by a decrease in the bond order of the TiFe intermetallic phase associated with the increase in Cu content. These results indicate that the
effect of the change in the bond order on Young’s modulus
is more significant than the effect of the change in area
fraction of the TiFe intermetallic phase.
3.2.2 Hardness
Figure 9(a) shows the Vickers hardness of the studied Ti
FeCu alloys before (as-cast) and after the heat-treatment.
It is obvious that the Vickers hardness of the studied TiFe
Cu alloys is much higher than those of CP-Ti (145 HV),25)
Ti64 ELI (320 HV),26) and the main materials used for
metallic stents, Co20Cr15W10Ni alloy (ASTM F90)
(250 HV),24)and 316L SS (220 HV).27)The Vickers hardness
of the as-cast alloys increases from 490 HV (Ti78Fe18Cu4
alloy) to 550 HV (Ti63.4Fe30Cu6.6alloy) with increasing atom
ratio (Fe+Cu)/Ti of the alloys. On the other hand, the
Vickers hardness decreases by approximately 6% after the
heat-treatment for all alloys. Figure 9(b) shows the Vickers
hardness of the studied TiFeCu alloys as a function of the
area fraction of the TiFe intermetallic phase. As shown in
Fig. 9(b), the hardness of as-cast Ti78Fe18Cu4 alloy is much
higher (490 HV) than that of¢-type Ti alloys such as TNTZ
(270 HV) despite the low area fraction of TiFe intermetallic phase (1.5%). As abovemention, there is possibility of formation of nano-size TiFe intermetallic phase, which is
difficult to verify using a SEM observation. Moreover, the
increase in the Vickers hardness of the studied TiFeCu
alloys depends on the area fraction of the TiFe intermetallic phase, which was determined from the optical micrographs. These results indicate that the comparatively high hardness
of the studied TiFeCu alloys is due to the formation of
the TiFe intermetallic phase.
However, the Vickers hardness of the heat-treated alloys is lower than that of the as-cast alloy, despite the increase in the area fraction of the TiFe intermetallic phase after the heat-treatment. This is caused by the decrease in the bond order of the TiFe intermetallic phase associated with the increase in Cu content.
Fig. 8 Young’s moduli of studied TiFeCu alloys (a) before (as-cast) and after heat-treatment and (b) as a function of area fraction of TiFe intermetallic phase.
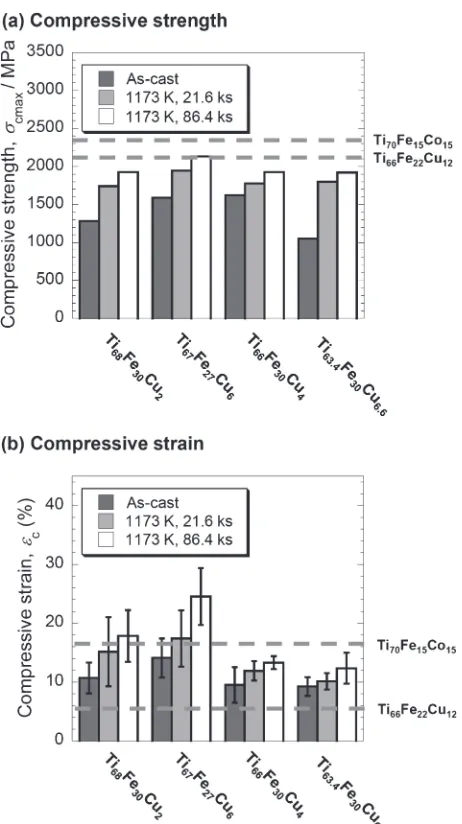
[image:6.595.52.278.68.445.2] [image:6.595.311.538.75.449.2]3.2.3 Compressive properties
Figure 10 shows (a) the compressive strength ·cmax and
(b) the compressive strain ¾c of the Ti68Fe30Cu2 alloy,
Ti67Fe27Cu6alloy, Ti66Fe30Cu4alloy and Ti63.4Fe30Cu6.6alloy
before (as-cast) and after the heat-treatment. These alloys all
have comparatively high Young’s moduli. The compressive
strengths of the as-cast alloys are lower than those of the
Ti70Fe15Co15 alloy and Ti66Fe22Cu12 alloy reported by
Louzguine et al.17,19) However, the compressive strengths
of all studied alloys increase significantly after the
heat-treatment for 86.4 ks. The highest compressive strength of
all the studied TiFeCu alloys is 2131 MPa, which is
observed for the heat-treated (86.4 ks) Ti67Fe27Cu6 alloy.
This compressive strength is lower than that reported for
Ti70Fe15Co15 alloy (2350 MPa),17) but it is higher than that
reported for Ti66Fe22Cu12alloy (2110 MPa).19)
The compressive strains of the studied as-cast TiFeCu
alloys are higher than those of the Ti66Fe22Cu12 alloys
(5.5%). Moreover, the compressive strains of the Ti68Fe30Cu2
alloy and Ti67Fe27Cu6 alloy increases significantly after the
heat treatment for 86.4 ks. In particular, the compressive
strain of the Ti67Fe27Cu6 alloy reaches 24.5%. This
compressive strain is higher than that reported for Ti70Fe15
-Co15alloy (16.5%).17)This increase in the compressive strain
of the heat-treated TiFeCu alloys is due to the decrease in
the hardness, which is caused by the decrease in the bond order of the TiFe intermetallic phase associated with the increase in Cu content.
The compressive strength of as-cast alloys is lower than that of heat-treated alloys despite the comparatively high hardness. This is because that fracture of as-cast alloys does not occur in plastic region but occurs in elastic region. After the heat-treatment, because the hardness decreases, the fracture occurs in the plastic region. Therefore, the compressive strength and compressive strain increase. This is well-known phenomenon for brittle alloys, which have
intermetallic phase.28)
The results of this study indicate that heat-treated
Ti67Fe27Cu6 alloy has significant potential as a material for
metallic stents because of its high Young’s modulus,
excellent hardness, and excellent compressive strength, and compressive strain.
4. Conclusions
In order to develop Ti alloys for metallic stents,
Ti78Fe18Cu4 alloy, Ti73Fe22Cu5 alloy, Ti68Fe30Cu2 alloy,
Ti67Fe27Cu6 alloy, Ti66Fe30Cu4 alloy and Ti63.4Fe30Cu6.6
alloy were designed using ad-electrons alloy design method.
The microstructures and mechanical properties of the
as-cast and heat-treated above designed TiFCu alloys were
investigated. The following results were obtained:
(1) The studied TiFeCu alloys consist of the¢-Ti phase
and dendritic TiFe intermetallic phase. Moreover, the area fraction of the TiFe intermetallic phase increases with
increasing atom ratio (Fe+Cu)/Ti of the alloys.
(2) The area fraction of the TiFe intermetallic phase and
Cu content in the TiFe phase of the studied TiFeCu alloys
increase after they are subjected heat-treatment under a high-purity argon atmosphere at 1173 K for 21.6 and 86.4 ks.
(3) The Young’s moduli of the studied TiFeCu alloys
increase from 110 GPa (Ti78Fe18Cu4 alloy) to 145 GPa
(Ti68Fe30Cu2alloy) with increasing atom ratio (Fe+Cu)/Ti
of the alloys and with increasing area fraction of the TiFe
intermetallic phase. However, the Young’s moduli are
saturated or slightly decreased when the area fraction of the TiFe intermetallic phase is more than 34%.
(4) The Vickers hardness of the as-cast studies TiFeCu
alloys increases from 490 HV (Ti78Fe18Cu4alloy) to 550 HV
(Ti63.4Fe30Cu6.6alloy) with increasing atom ratio (Fe+Cu)/
Ti of the alloys and with increasing area fraction of the TiFe intermetallic phase. On the other hand, the Vickers hardness of the heat treated studied alloys is lower than that of the as-cast alloys, despite the increase in the area fraction of the TiFe intermetallic phase after the heat-treatment.
(5) The heat-treated Ti67Fe27Cu6alloy has better
compres-sive properties than those of the other studied TiFeCu
alloys and reported TiFeCu alloys. The compressive
strength and compressive strain of the heat-treated Ti67Fe27
[image:7.595.55.286.65.477.2]-Cu6alloy are 2131 MPa and 24.5%, respectively.
Acknowledgement
This study was supported in part by Grant-in-Aid for
Scientific Research (A) 24246111 from the Japan Society for
the Promotion of Science (JSPS), the Industrial Technology Research Grant Program from the New Energy and Industrial Technology Development Organization (NEDO), Japan, and
the inter university cooperative research program“Innovation
Research for Biosis-Abiosis Intelligent Interface” from the
Ministry of Education, Culture, Sports, Science and Tech-nology, Japan.
REFERENCES
1) M. Semlitsch:Clin. Mater.2(1987) 113.
2) F. B. Christensen, M. Dalstra, F. Sejling, S. Overgaard and C. Bünger:
Eur. Spine J.9(2000) 97103.
3) M. Taira, J. B. Moser and E. H. Greener:Dent. Mater.5(1989) 4550.
4) D. Kuroda, M. Niinomi, M. Morinaga, Y. Kato and T. Yashiro:Mater. Sci. Eng. A243(1998) 244249.
5) Y. L. Hao, S. J. Li, S. Y. Sun, C. Y. Zheng, Q. M. Hu and R. Yang:
Appl. Phys. Lett.87(2005) 091906.
6) R. Huiskes, H. Weinans and B. van Rietberge: Clin. Orthop. Relat. Res.
274(1992) 124134.
7) T. Akahori, M. Niinomi, H. Fukui, M. Ogawa and H. Toda:Mater. Sci. Eng. C25(2005) 248254.
8) P. K. Zysset, X. E. Guo, C. E. Hoffler, K. E. Moore and S. A. Goldstein:J. Biomech.32(1999) 10051012.
9) R. A. Schatz:Circulation79(1989) 445457.
10) M. Niinomi:Metall. Mater. Trans. A33(2002) 477486.
11) A. Mahmoud, N. Wakabayashi, H. Takahashi and T. Ohyama: J. Prosthet. Dent.93(2005) 183188.
12) K. Chinzei, R. Kikinis and F. A. Jolesz: Proc. MICCAI’99 Lect. Notes Comput. Sci.1679(1999) pp. 10201031.
13) J. van Holten, P. Wielopolski, E. Brück, P. M. T. Pattynama and L. C. van Dijk:Magn. Reson. Med.50(2003) 879883.
14) K. Bartusek, Z. Dokoupil and E. Gescheidtova:Meas. Sci. Technol.17
(2006) 32933300.
15) J. Das, F. Ettingshausen and J. Eckert:Scr. Mater.58(2008) 631634.
16) D. V. Louzguine, H. Kato and A. Inoue:J. Alloy. Compd.384(2004) L1L3.
17) D. V. Louzguine-Luzgin, L. V. Louzguina-Luzgina, H. Kato and A. Inoue:Acta Mater.53(2005) 20092017.
18) D. V. Louzguine-Luzgin, L. V. Louzguina-Luzgina and A. Inoue:
Intermetallics15(2007) 181186.
19) D. V. Louzguine-Luzgin, L. V. Louzguina-Luzgina and T. Saito:Mater. Sci. Eng. A497(2008) 126131.
20) N. Yukawa, M. Morinaga, H. Ezaki and Y. Murata:High Temperature Alloys for Gas Turbines and Other Applications, (D. Reidel Publishing Company, Dordrecht, Holland, 1986) pp. 935944.
21) F. W. Averill and D. E. Ellis:J. Chem. Phys.59(1973) 64126418.
22) T. Saitoet al.:Science300(2003) 464467.
23) D. Dyja and Z. Stradomski: J. Achieve. Mater. Manuf. Eng.20(2007) 435438.
24) ASM Materials for Medical Devices Database Committee: Materials and Coatings for Medical Devices Cardiovascular, (ASM International, Materials Park, OH, 2009) pp. 6974.
25) E. Bertrand, T. Gloriant, D. M. Gordin, E. Vasilescu, P. Drob, C. Vasilescu and S. I. Drob:J. Mech. Behav. Biomed. Mater.3(2010) 559564.
26) R. R. Boyer, G. E. Welsch and E. W. Collings (Eds.): Materials Properties Handbook Titanium Alloys, (ASM International, Materials Park, OH, 1994) pp. 483636.
27) P. Peyre, X. Scherpereel, L. Berthe, C. Carboni, R. Fabbro, G. Beranger and C. Lemaitre:Mater. Sci. Eng. A280(2000) 294302.