Effect of Composition on Microstructure and Compressive Mechanical Properties
in Ti-Cu-Fe-Sn-Nb Alloys
Guo He and Masuo Hagiwara
National Institute for Materials Science, Tsukuba 305-0047, Japan
The microstructure and the compressive mechanical properties of the Ti-Cu-Fe-Sn-Nb alloys are significantly affected by the compositions. When the Cu in the alloys is more than 12 mol% and the Fe more than 10 mol%, the microstructure contains the dendriticbcc-Ti solid solution, the matrix phase and the eutectic structure. With decreasing the contents of Cu and Fe, the dendritic structure increases in volume fraction, while the matrix phase decreases and the eutectic structure vanishes away. Correspondingly, the yield strength and the Young’s modulus decrease, but the plastic strain increases. At the higher contents of Cu and Fe, the alloys exhibit the yield strengths of 1442-1515 MPa and the Young’s module of 90-101 GPa, but the small plastic strains. At the lower contents of Cu and Fe, the alloys exhibit the yield strengths of 1050-1321 MPa and the Young’s module of 47-76 GPa, which are very attractive for the biomedical applications.
(Received November 20, 2003; Accepted February 24, 2004)
Keywords: titanium alloy, mechanical properties, microstructure, composition, biomaterials
1. Introduction
Due to the advanced mechanical properties, the low density and the excellent corrosion-resistance, Ti alloys have been extensively used in aeronautic, automobile and other industrial area. Their excellent biocompatibility has also raised extensive interests in the biomedical area, leading to their applications in the surgery.1–3)The most used Ti alloy for human implants is Ti-6Al-4V, which has good mechan-ical properties.1) However, this alloy exhibits a too high elastic modulus of about 120 GPa compared to the human bone (elastic modulus is about 30 GPa).2,3) The high elastic modulus is unfavorable for the bone healing and remodel-ing.4) On the other hand, the vanadium and aluminum components have revealed to be toxic elements that provides low biocompatibility and, consequently, they must be avoided in medical applications such as human implants.5,6) So far, many investigations are focused on the reduction of the elastic modulus and the improvement of the strength and the workability. The newly-developed Ti alloys can be classified into three categories depending on the composi-tions, i.e., (a) Ti-Al-base + -phase former elements (e.g., Ti-6Al-7Nb,7)Ti-5Al-3Mo-4Zr3)) or strengthening elements (e.g., Ti-3Al-2.5V, Ti-5Al-2.5Fe).3) The alloys in this category usually have þ microstructures and exhibit relative lower densities, higher strengths and higher Young’s module compared to the -Ti alloys. (b) Ti + refractory elements (they are also strong-phase former elements,e.g., Ti-15Zr-4Nb-4Ta,8) Ti-29Nb-13Ta-4.6Zr4)). These alloys generally contain more than 20-40 mass% refractory ele-ments, and usually have a monolithic -phase and exhibit relative lower strengths, lower Young’s module and higher densities compared to the or þ Ti alloys. (c) Ti + refractory elements + strengthening elements (e.g., Ti-15Mo-5Zr-3Al,9)Ti-7.5Mo-xFe10)). Since the-phase former elements are far more than the strengthening element, the alloys have a -phase structure, and exhibit relative higher strengths and lower Young’s module compared to the Ti alloys in the other two categories. In these three categories, the highest yield strength reaches about 1050 MPa.4) The
lowest Young’s modulus is about 60 GPa.4) However, it is difficult to realize a low Young’s modulus while retaining a high strength,i.e., one can get either a high strength with a high Young’s modulus, or a low Young’s modulus with a low strength. Recently, an appropriate combination of Cu, Ni, Sn, Nb (or Ta) together with Ti was found which can be easily cast into micrometer-sized -phase + ultrafine/nanostruc-tured phase.11,12) Such composite microstructure exhibits a novel combination of a high strength and a low Young’s modulus, which is very attractive for the biomedical application.13) Considering the bio-toxicity of Ni in the alloys,14)we are trying to develop new Ni-free Ti alloys with the novel properties. This work is part of the extensive study aimed to investigate the effect of composition on the as-prepared microstructure and the mechanical properties in the Ti-Cu-Fe-Sn-Nb combinations.
2. Experimental Procedures
[image:1.595.306.549.695.784.2]A series of Ti-Cu-Fe-Sn-Nb alloys listed in Table 1 was selected in order to investigate the effect of Cu-Fe contents on the in-situ formed phases and the as-prepared micro-structures. The content of Nb, which is a strong -phase former, was unchanged or small changed for the balance of the composition. The content of Sn was adjusted for avoiding the precipitation of the Sn-rich phase with extreme low melting temperature. The alloys were prepared by arc melting the mixture of the pure elements (commercial purity) on a water-cooled copper hearth at argon atmosphere. The button-shape ingots were then reshaped into 60 mm
Table 1 Compositions of the Ti-Cu-Fe-Sn-Nb multicomponent alloys.
Alloys Composition (mol%)
Ti Cu Fe Sn Nb
A 58 16 14 4 8
B 60 14 12 4 10
C 65 12 10 3 10
D 69 10 8 3 10
E 74 8 6 2 10
Materials Transactions, Vol. 45, No. 5 (2004) pp. 1555 to 1560
Special Issue on Recent Research and Developments in Titanium and Its Alloys
15 mm 12 mm rods by arc-remelting in the copper mold with a rod-shape cavity so as to improve the homogeneity of the microstructure of the ingots. The samples for the mechanical test, the specimen for the microstructure obser-vation and the X-ray diffraction (XRD) analysis were cut from the vicinal places in the rods. The microstructures were characterized by using a JEOL-JSM5400 scanning electron microscope (SEM) coupled with an energy-dispersive X-ray analysis (EDX). The phases were determined by using a JEOL JDX-3500 XRD facility with CuK radiation. The mechanical behavior of the as-prepared alloys was evaluated by compressive test using a Shimadzu AG-50 kNI testing machine at a strain rate of1104s1at room temperature. The compressive test samples were machined into3mm
6 mm with very careful polish on both sides so as to insure the parallelism of the two sides. The tested stress-strain curves were calibrated by subtracting the strain of the test system, which was evaluated by going through the compressive test process with the same strain rate without the test sample. Because any flaws or defects (when their volume fractions are large enough) in the test samples (such as shrinkage pores, gas holes,etc.) can significantly affect the tested data, especially for the Young’s modulus, the quality control of the prepared alloys is very important for getting the reliable data. For avoiding the effect of the defects, in addition to the careful preparation of the samples, each alloy was tested by at least two samples. Only the repeatable data were considered as the reliable data.
3. Results
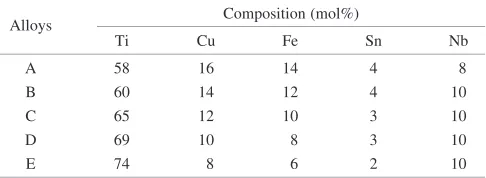
Figure 1 shows the SEM backscattered electron images of the as-prepared microstructures of alloys A and B. There are three phases (or morphology) in the microstructures, i.e., dendrites (bright phase), eutectic structure and matrix (dark region). The high magnification images (Figs. 1(b) and (d)) show the detailed morphology of the eutectic structure in alloys A and B, respectively. Comparing the two alloys, it is found that the dendritic structure in alloy A is smaller than that in alloy B in both the size and the volume fraction, but the eutectic structure in alloy A is larger than that in alloy B. The EDX analysis (Table 2) indicates that the Nb, Sn and Ti contents in the dendritic structure are higher than the average composition, while the Cu and Fe contents are lower than the average composition. This confirms the effect of Nb and Sn on the formation of the dendrites. Conversely, the Nb, Sn and Ti contents in the eutectic structure are lower than the average composition, and the Cu and Fe contents are higher than the average composition, indicating that Cu and Fe improve to form the eutectic structure. The matrix phase contains very high contents of Cu and Fe and low contents of Nb and Sn. Compared the eutectic structure and the matrix, although the Cu and Fe contents in both structures are higher than the average composition, the extents of the segregation are different. The matrix phase contains higher Cu and Fe than the eutectic structure.
Figure 2 shows the SEM backscattered electron images of Fig. 1 SEM backscattered electron images of the as-prepared microstructures. (a) alloy A; (b) high magnification image of the alloy A,
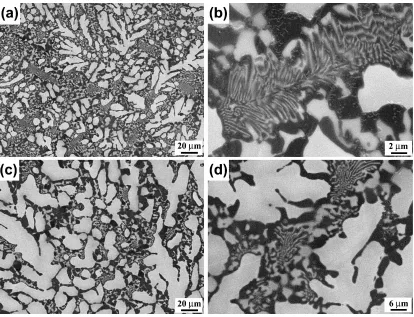
[image:2.595.92.506.70.387.2]the as-prepared microstructures of alloys C, D and E. The coarse eutectic structure appeared in alloys A and B does not appear in the alloys C, D and E. The microstructures contain only the dendrites and the matrix. From alloy A to alloy E, the dendritic structure increases in volume fraction and the isolated dendrites (as shown in Fig. 1 for the alloys A and B and Fig. 2(a) for the alloy C) become joined-dendrite networks (as shown in Figs. 2(b) and (c) for the alloys D and E). The EDX analysis for the alloys C, D and E also indicates that the Nb, Sn and Ti contents in the dendritic structure are higher than the average composition, while the Cu and Fe contents in the matrix are higher than the average composition (Table 2).
The XRD analysis indicates that the as-prepared alloys contain bothbcc-Ti(RM) andhcp-Ti(TM) solid solutions (RM=Nb, Sn; TM=Cu, Fe) as shown in Fig. 3. The strong bcc-phase diffraction peaks mostly correspond to the den-drites (Figs. 1 and 2) and the hcp-phase diffraction peaks (Fig. 3) mainly correspond to the eutectic structure (and perhaps to the matrix also, this needs further investigation on the detail of the matrix phase). It is clear that the diffraction peaks of the-phase (see the 211 peak of the-phase at2of about 71in Fig. 3) become stronger from alloy A to alloy E, corresponding to the increase of the dendritic structure in volume fraction. This is consistent with the results of the observation on the microstructures (Figs. 1 and 2). However, the diffraction peaks of the-phase are gradually decreased from alloy A to alloy D, and can not be distinguished at all in alloy E (Fig. 3). This corresponds to the decrease of the volume fraction of thehcp-phase from alloy A to alloy E. Due to the difference of the composition and the structure among the dendritic structure, the eutectic structure and the matrix, the mechanical properties of these structures are quite
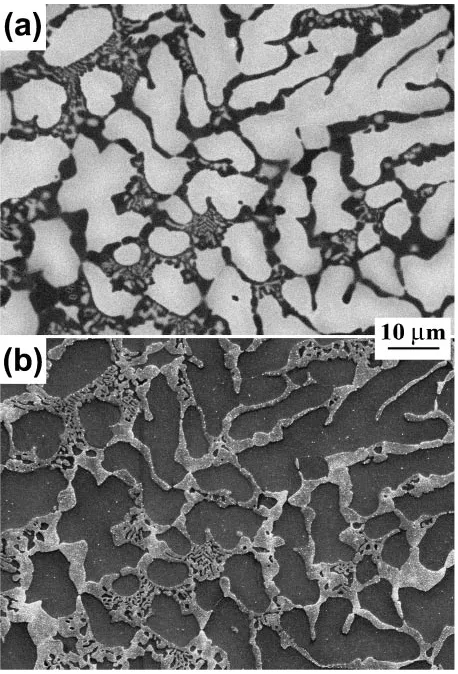
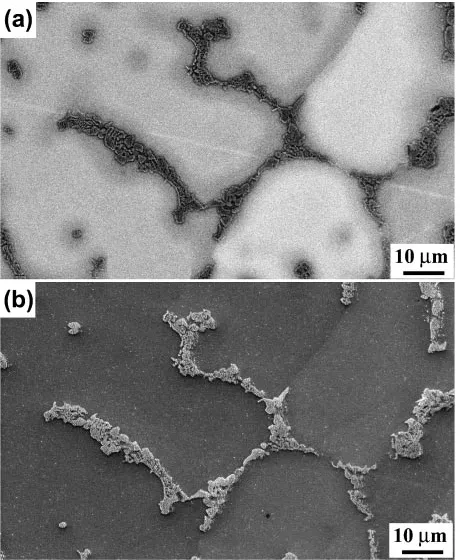
different. Figure 4 shows the SEM images of the as-polished surface of alloy B. (a) is a SEM backscattered electron image (COMPO mode image shows contrast according to the difference between the atomic numbers comprising the specimen), which shows the microstructures, and (b) is a secondary-electron image (SEI), which shows the relief of the as-polished surface. (a) and (b) were taken from the same area at a same magnification. The dendritic structure (bright phase in Fig. 4(a)) was evidently worn off (the gray part in Fig. 4(b)), while the eutectic structure and the matrix were less worn off and left behind with obvious protuberance (Fig. 4(b)). For alloys C, D and E, though no distinct coarse eutectic structure was found, the matrix exhibits a similar behavior, i.e., the obvious protuberance was formed on the as-polished surface as shown in Fig. 5.
[image:3.595.50.548.83.364.2]The compressive mechanical properties of these alloys are listed in Table 3. Alloys A and B with obvious coarse eutectic structures exhibit high yield strengths of 1442–1515 MPa and also relative high Young’s module of 90-101 GPa. The plastic strain is 3.67% for the alloy A and 6.15% for the alloy B. For alloys C, D and E, the yield strengths are 1050– 1321 MPa and the Young’s module are 47–76 GPa. The plastic strains are larger than 16%. From the data listed in Table 3, there is a tendency,i.e., with the increase in dendritic structure, the yield strength decreases, while the plastic strain significantly increases. The Young’s modulus seems signifi-cantly affected by the microstructure. The coarse eutectic structure in the alloys A and B may contribute to the high Young’s modulus, while the alloys C, D and E without the distinguishable coarse eutectic structure exhibit very low Young’s module. The compressive stress-strain curves of the alloys A-E are shown in Fig. 6.
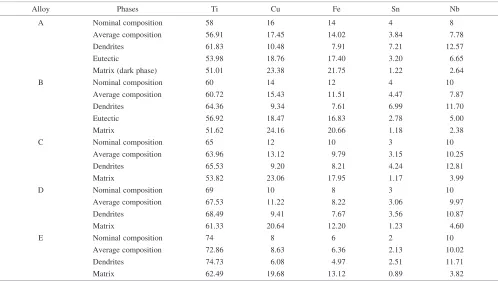
Table 2 EDX analysis results of the as-prepared alloys A, B, C, D and E.
Alloy Phases Ti Cu Fe Sn Nb
A Nominal composition 58 16 14 4 8
Average composition 56.91 17.45 14.02 3.84 7.78
Dendrites 61.83 10.48 7.91 7.21 12.57
Eutectic 53.98 18.76 17.40 3.20 6.65
Matrix (dark phase) 51.01 23.38 21.75 1.22 2.64
B Nominal composition 60 14 12 4 10
Average composition 60.72 15.43 11.51 4.47 7.87
Dendrites 64.36 9.34 7.61 6.99 11.70
Eutectic 56.92 18.47 16.83 2.78 5.00
Matrix 51.62 24.16 20.66 1.18 2.38
C Nominal composition 65 12 10 3 10
Average composition 63.96 13.12 9.79 3.15 10.25
Dendrites 65.53 9.20 8.21 4.24 12.81
Matrix 53.82 23.06 17.95 1.17 3.99
D Nominal composition 69 10 8 3 10
Average composition 67.53 11.22 8.22 3.06 9.97
Dendrites 68.49 9.41 7.67 3.56 10.87
Matrix 61.33 20.64 12.20 1.23 4.60
E Nominal composition 74 8 6 2 10
Average composition 72.86 8.63 6.36 2.13 10.02
Dendrites 74.73 6.08 4.97 2.51 11.71
Matrix 62.49 19.68 13.12 0.89 3.82
4. Discussion
4.1 Microstructures of the as-prepared alloys
Nb and Sn are well-known strong-phase formers in the Ti alloys. The dendritic-Ti(RM) solid solution in the present alloys is attributed to the existence of Nb and Sn. Although the alloys contain the same amount of Nb (only the alloy A is different), from alloy B to alloy E the dendritic -phase increases in volume fraction, indicating the effect of the other components such as Ti, Cu and Fe in the alloys. It is clear that more Ti and less Cu and Fe favor the precipitation of the dendritic structure. On the other hand, the formation of the
eutectic structure is attributed to Cu and Fe in the alloys. With the increase of Cu and Fe from the alloy C to A, the eutectic structure increases in volume fraction. When Cu is Fig. 2 SEM backscattered electron images of the as-prepared
micro-structures of the alloys C (a), D (b), and E (c).
Fig. 3 XRD patterns of the as-prepared alloys A (a), B (b), C (c), D (d), and E (e).
[image:4.595.57.282.72.588.2] [image:4.595.307.545.73.293.2] [image:4.595.313.542.342.679.2]less than 14 mol% and Fe less than 12 mol%, the eutectic structure can not be distinguished, revealing an evident dependence of the eutectic structure on the contents of Cu and Fe in the alloys.
From the EDX results, it is noticed that the composition of the eutectic structure is between the dendritic bcc-phase and the matrix phase. In fact, the eutectic structure is composed of two different phases, which are alternately assembled as layers. One is a bright region and the other is a dark region (Figs. 1(b) and (d)). It is believed that the composition of the bright region is similar to that of the dendritic region and the composition of the dark region is similar to that of the matrix region because the SEM backscattered electron images are revealed by the composi-tion difference between structures. This just coincides with the EDX results,i.e., the composition of the eutectic structure is a mixture of the compositions of the dendritic structure and
the matrix phase. The observation on the as-polished surface of the alloys also supports that the eutectic structure is composed of two different phases. One phase is very similar with dendritic structure, which is worn off during the polish process as shown in Fig. 4. The other phase is very similar with the matrix phase, which is less worn off during the polish and leaves obvious protuberances on the polished surface (Fig. 4).
4.2 Mechanical behavior of the as-prepared alloys
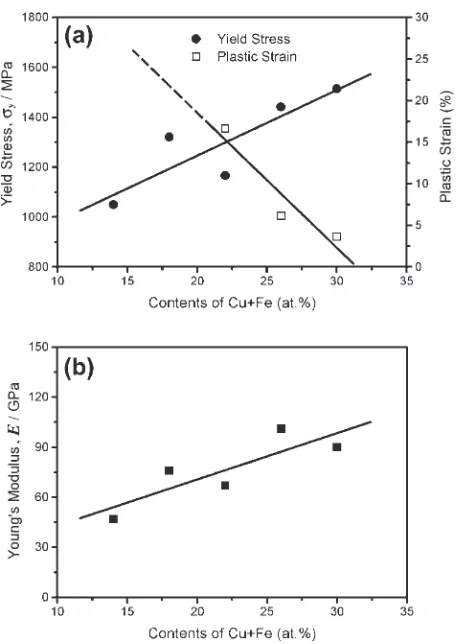
The yield strengths of the present alloys are very close to that of the Ti-Cu-Ni-Sn-Ta alloys for which there is a dendrite-nano/ultrafine-structured composite microstruc-ture.15) It was suggested that the nano/ultrafine-structured matrix phase contributes to the high yield strength, while the dendritic -phase provides the ductility.11,15) Similarly, the matrix phase and the eutectic structure in the Ti-Cu-Fe-Sn-Nb alloys also act as strengthening entities, while the dendritic bcc -Ti(RM) phase provides the ductility. The more strengthening phases there are, the higher yield strength the alloys have (e.g., alloys A and B in Table 3). Inversely, the more dendritic structure there is, the lower yield strength and the larger plastic strain the alloys have (e.g., alloys D and E in Table 3). Considering the dependence of the as-prepared microstructures on the Cu+Fe contents, the effect of the composition on the yield stress and the plastic strain is shown in Fig. 7(a).
There is a tendency that the Young’s modulus becomes lower from alloy A to alloy E (Table 3), indicating a composition-dependence of the modulus as shown in Fig. 7(b). For the composite microstructure, the Young’s modulus may be estimated according to the rule of mixtures by considering their volume fractions,i.e.,16)
E¼EmatrixVmatrixþEeuVeuþEdenð1VmatrixVeuÞ ð1Þ
whereEis the Young’s modulus; V is the volume fraction. The subscript matrix,eu anddenindicate the matrix phase, the eutectic structure and the dendritic structure, respectively. With decreasing the volume fraction of the matrix phase and the eutectic structure from alloy A to alloy E, the Young’s modulus decreases (Table 3 and Fig. 7(b)), indicating that the Young’s modulus of the dendritic structure is lower than that of the matrix phase and the eutectic structure according to the Fig. 5 As-prepared microstructures of alloy D. (a) SEM Backscattered
[image:5.595.55.286.72.352.2]electron image (COMPO mode) showing the dendrite-matrix composite microstructure; (b) SEI image of the same area on the polished surface, showing the relief of the as-polished surface.
Table 3 Summary of the compressive test data: Young’s modulusE, yield stressy, strain at the yield point"y, ultimate compression stressmax, and plastic strain"p.
Alloy E y "y max "p
(GPa) (MPa) (%) (MPa) (%)
A 909 1515110 1:80:1 1889 3:70:8
B 10115 1442142 1:60:2 1650 6:21:4
C 6710 116783 2:00:1 1730 16:63:5
D 7614 1321160 2:00:2 1405 large*
E 4715 1050111 2:30:2 1071 large*
* Not fracture.
[image:5.595.307.549.72.234.2] [image:5.595.47.290.463.553.2]eq. (1). This is consistent with the findings in otherbcc-type Ti alloys4,9)that have lower Young’s modulus than the-type or theþ-type Ti alloys. In order to reduce the Young’s modulus the dendritic structure should be increased in volume fraction. On the other hand, the reduction of the Young’s modulus of the matrix can also contribute to the low Young’s modulus of the alloys according to the eq. (1). This may be realized when the gain size of the matrix phase is reduced into nanoscale.16,17)
5. Conclusions
Ti-Cu-Fe-Sn-Nb alloys have a dendritic-phase + matrix phase + eutectic structure composite microstructure. The dendritic structure is a Nb- and Sn-rich bcc -Ti solid solution, while the matrix phase and the eutectic structure contain ahcp-phase and are rich in Cu and Fe compared to the average composition. With decreasing the contents of Cu and Fe, the dendritic structure increases in volume fraction, while the eutectic structure decreases. At the 12 mol% Cu and
the 10 mol% Fe, almost no eutectic structure can be distinguished. The dendrites are isolated by the matrix phase when the Cu is more than 12 mol% and the Fe more than 10 mol%, and become joined dendrite-networks when the Cu is less than 12 mol% and the Fe less than 10 mol%.
The mechanical properties are strongly affected by the microstructure. At the higher Cu and Fe contents, the alloys exhibit the high yield strengths of 1442-1515 MPa and the high Young’s module of 90-101 GPa, but the low plastic strains of 3.67-6.15% due to the large volume fractions of the eutectic structure and the matrix phase, which have a low ductility. With the reduction of the matrix phase and the vanishing of the eutectic structure, the yield strengths of the alloys decrease, but the plastic strains become large. The Young’s module tend to decrease with increasing the volume fraction of the dendrite because thebcc-phase has a lower Young’s modulus than the matrix and the eutectic structure. The alloys without the distinguishable eutectic structure exhibit the Young’s module of 47-76 GPa, which is very promising for the biomedical applications.
Acknowledgements
The authors are grateful to Drs. S. Emura, Y. Yamabe-Mitarai and Y. F. Gu for technical assistance.
REFERENCES
1) R. V. Noort: J. Mater. Sci.22(1987) 3801–3811. 2) M. Long and H. J. Rack: Biomater.19(1998) 1621–1639. 3) M. Niinomi: Metall. Mater. Trans.33A(2002) 477–486. 4) M. Niinomi: Biomater.24(2003) 2673–2683.
5) J. A. Davidson, A. K. Mishra, P. Kovacs and R. A. Poggie: Biomed. Mater. Eeg.4(1994) 231–243.
6) S. J. Lugowski, D. C. Smith, A. D. McHugh and V. Loon: J. Biomed. Mater. Res.25(1991) 1443–1458.
7) T. Akahori, M. Niinomi and A. Suzuki: Metall. Mater. Trans.33A (2002) 503–510.
8) Y. Okazaki, E. Nishimura, H. Nakada and K. Kobayashi: Biomater.22 (2001) 599–607.
9) H. M. Kim, H. Takadama, T. Kokubo, S. Nishiguchi and T. Nakamura: Biomater.21(2000) 353–358.
10) D. J. Lin, J. H. Chern Lin and C. P. Ju: Bı´omater.23(2002) 1723–1730. 11) G. He, J. Eckert, W. Lo¨ser and L. Schultz: Nature Mater.2(2003) 33–
37.
12) J. Eckert, G. He, J. Das and W. Lo¨ser: Mater Trans.44(2003) 1999– 2006.
13) G. He, J. Eckert, Q. L. Dai, M. L. Sui, W. Lo¨ser, M. Hagiwara and E. Ma: Biomater.24(2003) 5115–5120.
14) P. Grimme and P. Hupfer: Metallurgy46(1992) 365–369. 15) G. He, W. Lo¨ser and J. Eckert: Acta Mater.51(2003) 5223–5234. 16) T. D. Shen, C. C. Koch, T. Y. Tsui and G. M. Pharr: J. Mater. Res.10
(1995) 2892–2896.
17) P. G. Sanders, J. A. Eastman and J. R. Weertman: Acta Mater.45 (1997) 4019–4025.
[image:6.595.55.284.67.389.2]