Abstract—Abnormality detection in low contrast mammogram images is a challenging task. Enhancement of mammograms is necessary to increase the visibility of the abnormalities present in the mammograms. This paper proposes a fractional order differential based filter (FDD) to enhance low contrast mammogram images. Enhancement is performed for nine orders of derivative. Two enhancement performance parameters are computed to analyze the results. Performance of the proposed enhancement method is compared with the histogram equalization, contrast limited adaptive histogram equalization, and unsharp masking methods. Analysis of both quantitative as well as visual results shows that the proposed algorithm performs better as compared to other existing techniques. Proposed algorithm is validated on Digital Database for Screening Mammography (DDSM) and mammogram images of Mini-Mammographic Image Analysis Society (mini-MIAS) databases.
Index Terms— Breast Cancer Detection, Image Enhancement, Fractional Order differential, Histogram Equalization, Unsharp Masking
I. INTRODUCTION
Early detection and treatment of breast cancer is effective approach to reduce the mortality ratio of women due to cancer. Several image modalities namely ultrasound, magnetic resonance imaging (MRI), positron emission tomography (PET), computerized tomography (CT), and X-ray imaging (mammography) are used to detect breast cancer. Mammography is considered as effective imaging technique for screening and early detection of breast cancer. However, it is difficult to detect abnormalities present in the low contrast mammograms. This work aims to develop a technique for enhancement of low contrast mammogram images.
Several image enhancement techniques have been used in literature for contrast enhancement and noise filtering of mammograms. Dhawan et al. proposed an adaptive neighborhood processing approach that uses the knowledge of desired features to design the contrast enhancement function [1]. Region based contrast enhancement is proposed by Morrow et al. [2]. Enhancement of mammographic features using multi-resolution technique is given by Laine et al. [3]. Qian et al. used tree structured non-linear filter for noise removal of mammograms [4]. Adaptive density weighted contrast enhancement filter for mammographic breast mass detection is proposed by Petrick et al. [5]. Unsharp masking technique for mammogram K. L. Kashyap (e-mail: [email protected]), M. K. Bajpai (e-mail: [email protected]), and P. Khanna* (phone: +91761-279-4222, e-mail: [email protected]) are with the Department of Computer Science and Engineering, PDPM Indian Institute of Information Technology, Design and Manufacturing, Jabalpur, India. K. K. Singh (e-mail: [email protected]) is with the Department of Computer Science and Engineering, NIT Jamshedpur, India.
enhancement is used by several authors [6]-[8]. Fuzzy logic approach for contrast enhancement is proposed by Cheng et al. [9], [10]. Integration of fuzzy logic with structure tensor for mammogram contrast enhancement is applied by Jiang et al. [11]. Wavelet based techniques are also used by many authors [12], [13]. Wavelet based technique for micro-calcification enhancement in mammograms is proposed by Heinlein et al. [14]. Anisotropic diffusion filtering for medical image enhancement is proposed by George et al. [15]. Homomorphic filtering for mammogram image de-noising is used by Yoon et al. [17]. Pisano et al. applied contrast limited adaptive histogram equalization (CLAHE) method for enhancement of the abnormality in dense mammogram [18]. Kim et al. proposed the first derivative and local statistics to remove film artifacts and mammographic feature enhancement [19]. Noise suppression and contrast enhancement of mammograms in wavelet domain is applied by Scharcanski et al. [20] and Tang et al. [21]. Nonlinear unsharp masking is used by Panetta et al. [22]. Lai at el. concluded that median filters with 5×5 mask perform better for image enhancement and noise removal [23].
Singh et al. proposed a fractional order differential based filter (FDD). They used Chebyshev polynomials to approximate the filter function [24]. The present work introduces a fractional order derivative based mask for mammograms enhancement. The mask coefficients are calculated by using Chebyshev polynomial based approximation.
The structure of this paper is as follows. Section 2 discusses the proposed algorithm and design of Chebyshev polynomial based fractional order mask. Section 3 describes experimental results and discussion followed by conclusions reported in Section 4.
II. PROPOSED ENHANCEMENT ALGORITHM
Consider two higher order differentiable functions in
R
as ( )Y t and Y t( )which are observed and original functions, respectively. The observed function in terms of original function and error
( )
t
can be given as [24]:Y t( )Y t( )( )t (1) The present work encompasses smoothing of observed
function by the use of
n
thorder derivative, L point filtering window, and n-degree polynomial approximation. Any function Y t( ) can be obtained by polynomial expansion expressed as:0
( ) ( )
n k k k
Y t c T t
(2) heret1, 2,3...,Ldenotes the position of the tth point in thefiltering window and
c
k represents the kth coefficient ofFractional Order Filter based Enhancement of
Digital Mammograms
polynomial function. Least-square method is used to estimate coefficients
c
k. Equation (2) can be expanded as:L n n n n n n n n y c L T c L T c L T c L T y c T c T c T c T y c T c T c T c T y c T c T c T c T ) ( ... ) ( ) ( ) ( ... ) 3 ( ... ) 3 ( ) 3 ( ) 3 ( ) 2 ( ... ) 2 ( ) 2 ( ) 2 ( ) 1 ( ... ) 1 ( ) 1 ( ) 1 ( 2 2 1 1 0 0 3 2 2 1 1 0 0 2 2 2 1 1 0 0 1 2 2 1 1 0 0 (3) 1 2 [ , ,..., L]T
Y y y y denotes function points measured in the filtering window. T is a matrix of order
L
(
n
1)
defined as:0 1 2
0 1 2
0 1 2
(1) (1) (1) (1)
(2) (2) (2) (2)
( ) ( ) ( ) ( )
n n
n
T T T T
T T T T
T
T L T L T L T L
(4)
The elements of matrix T are computed by using Chebyshev polynomial [25]:
1
( )
2
( )
1( )
n n n
T
t
tT t
T
t
,T t
0( )
1,
T t
1( )
t
(5) The polynomial coefficients C are computed as:
1 ( T ) T
C T T T Y (6)
Solving (3) by using (5) and (6), the resultant equation is expressed as:
1
ˆ ( T ) T
YTCT T T T YWY
(7) here W denotes window coefficient matrix. Smoothing
operation is performed by using different window coefficient matrix [26]. Riemann-Liouville fractional order derivative can be expressed as:
1 0 0 1 ( ) ( ) ( ) ( ) x l l x l d
D Y t t x f x dx
l dt
(8)here0 l 1 l, and (l ) is the Gamma function of (l).
is the positive order of differentiation and its value lies between l1 to l. The fractional order differentiator, corresponding to window coefficient matrix W, can be obtained by (8). Different properties of fractional order differentiation [27], [28] are applied on (7) and generalized form of resultant equation is expressed as:1
ˆ ( T ) T
t t t
Y T C W Y c T T T Y (9)
here ˆYtdenotes
th derivative of the tth point in the filtering window, Wtdenotes
thderivative coefficient vector of the tth point in the filtering window, and c is given as:1 2
1 (2) (3) ( 1)
[ , , ,..., ]
(1 ) (2 ) (3 ) ( 1 )
n
n
c i i i i
n
The defined fractional order mask W is used for mammogram enhancement. The mask W is convolved with the input image I. Moving window concept is applied in convolution.
The algorithm can be expressed as follows.
Algorithm (
L
,
n
,
,
h
0 IE) Input:L
,
n
,
L
: Length of differentiatorn
: Order of polynomial
: Order of derivativeT
: Matrix
a
: Constant
W
: Window matrix
: Gamma functionOutput:
h
0 IE begin fori
1
to Lfor
j
0
to n// Calculate matrix
T i j
( , )
T i j
( , )
2 ( , )
iT i j
T i j
( ,
1)
//HereT i
( ,0) 1, ( ,1)
T i
i
)end for end for for
i
1
to Lfor
j
0
ton
Calculate [ ( 1) ]
( 1 )
n n a i n end for end for
IEconvolution(I,w)
end
III. EXPERIMENTAL RESULTS AND DISCUSSION The proposed algorithm is validated with publicly available mini-MIAS [30] and Digital Database for Screening Mammography (DDSM) [31] datasets. MIAS consists of 322 (117 abnormal and 206 normal) MLO views mammogram. The size of images is 1024×1024 pixels. DDSM contains images of 2620 cases with the contrast resolution of 12-bits and 16-bits. The proposed algorithm is validated on all mammograms of MIAS and 300 randomly chosen mammograms of DDSM dataset. The proposed mask is designed for different order of differentiation. The degree of Chebyshev polynomial is taken as
n
2
and size of the mask is taken as 3×3. Enhancement is applied for nine different order of differentiation, i.e., α= [0.2, 0.3, 0.4, 0.5, 0.6, 0.7, 0.8, 0.9, 1]. The performance of the proposed algorithm is compared with the existing enhancement techniques, i.e., histogram equalization (HE), CLAHE, and unsharps masking [32]. Experimental results obtained with three randomly chosen mammograms from MIAS and DDSM datasets are shown in Fig. 1 and Fig. 2.( )
( T ) T
i
W a T T T
ISBN: 978-988-14047-5-6
Mdb025
Mdb028
Mdb218
Fig.1. Enhancement results for sample images from MIAS dataset (a) original image, (b) HE, (c) CLAHE, (d) unsharp masking, (e)-(h) proposed fractional differential order technique with α=0.2, α=0.3, α=0.4, and α=0.5.
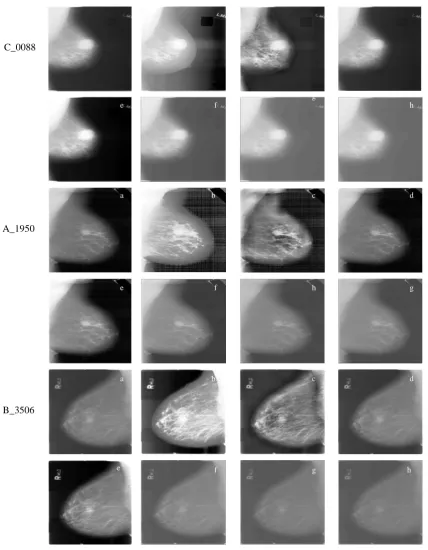
The results show that the enhanced mammograms using HE and CLAHE method are over-enhanced. The visual quality of mammogram is marginally improved by unsharp masking. It is clearly observed from the experimental results that contrast of mammograms are better for α=0.2 than any other values of α visually. The order of differentiation plays a significant role in image enhancement. Mammograms are enhanced when the order of differentiation varies from 0.2 to 0.5. The quality of enhancement degraded for α>0.5, thus, the enhancement results of only four order of differentiation α= [0.2, 0.3, 0.4, 0.5] are presented in Fig. 1 and 2.
Quantitative analysis of the proposed enhancement algorithm is done by using two enhancement measurement parameters, i.e., contrast improvement index (CII) and second derivative like measurement (SDME) [22]. CII measures the contrast improvement of original image as:
,
Original enhanced
C C CII
b f
b f C
(10) here f and
b
represents the average pixel intensity offoreground and background images, respectively. d
h g
a
b c
f e
b c d
e f g h
c d
b
e f g h
C_0088
A_1950
B_3506
Fig. 2. Enhancement results for sample images from DDSM dataset (a) original image, (b) HE, (c) CLAHE, (d) unsharp masking, (e)-(h) proposed fractional differential order technique with α=0.2, α=0.3, α=0.4, and α=0.5.
SDME parameter is represented as:
1 21 1 2
1
ln
max(
(
,
))
2
(
(
,
))
min(
(
,
))
))
,
(
min(
))
,
(
(
2
))
,
(
max(
ln
20
1
wm w
l
I
l
m
center
I
l
m
I
l
m
m
l
I
m
l
I
center
m
l
I
w
w
SDME
(11)
Images are partitioned into blocks of size
w
1
w
2. Maximum, minimum, and center pixel intensity values of each block are represented bymax(I(l,m)),min(I(l,m)), and)) , ( (I l m
center , respectively. Higher values of SDME and
CII show better enhancement of images.
Table I and II show CII and SDME values of three randomly chosen sample images of MIAS and DDSM dataset using HE, CLAHE, unsharp masking, and FDD methods,
g
e f h
a b c d
g h
e f
a b c d
e f g h
ISBN: 978-988-14047-5-6
[image:4.595.48.477.44.595.2]respectively. Average values of CII and SDME parameters of all 322 mammograms of MIAS dataset and 300 mammograms of DDSM dataset are presented in Table III and IV, respectively. As shown in Fig. 1 and 2, the quality of results obtained with the proposed approach decreases with increasing value of order of differentiation, i.e., . Quantitative results given in Table I and II also confirm it. Values of CII and SDME decrease with increasing value of with highest value observed for α=0.2. However, the values of CII parameter obtained with HE method for images from MIAS dataset are greater as compared to the proposed FDD Algorithm but the resultant images are over-enhanced as shown in Fig. 1. The values obtained for SDME
parameter are greater than the HE, CLAHE, and Unsharp masking technique for .
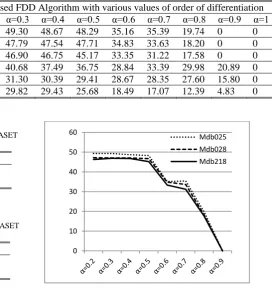
Fig. 3 shows the effect of the order of differentiation on the value of SDME for seven mammograms. The value of SDME is 49.319 and 49.305 at α= 0.2 and 0.3 respectively for Mdb025. SDME decreases with the increasing order of differentiation. SDME continually decreases for order of differentiation
0
.
2
. The value of SDME is greater for2
.
0
[image:5.595.55.539.250.350.2]
as compared to HE, UM, and CLAHE methods. Hence, it can be concluded that fractional order differential based filter (FDD) is better as compared to HE, UM, and CLAHE for image enhancement.TABLE I
CII VALUES OF RANDOMLY CHOSEN SAMPLE IMAGES FROM MIAS AND DDSM DATASETS
Sample
Images HE CLAHE UM
Proposed FDD Algorithm with various values of order of differentiation α=0.2 α=0.3 α=0.4 α=0.5 α=0.6 α=0.7 α=0.8 α=0.9 α=1 Mdb025 2.22 0.42 0.38 1.18 0.95 0.96 0.68 0.54 0.37 0.22 0.10 0.04 Mdb028 2.17 0.41 0.36 1.05 0.86 0.91 0.63 0.51 0.35 0.21 0.10 0.03 Mdb218 3.55 0.41 0.42 1.03 0.89 0.93 0.68 0.56 0.39 0.24 0.11 0.03 C_0088 0.59 0.40 0.35 1.87 0.82 0.80 0.73 0.80 0.67 0.49 0.26 0.03 A_1950 0.51 0.42 0.59 1.95 0.92 0.90 0.85 0.80 0.82 0.72 0.49 0.07 B_3506 0.43 0.37 0.36 1.94 0.89 0.87 0.79 0.79 0.65 0.46 0.24 0.03
TABLE II
SDME VALUES OF RANDOMLY CHOSEN SAMPLE IMAGES FROM MIAS AND DDSM DATASETS
Sample
Images HE CLAHE UM
[image:5.595.260.533.397.687.2]Proposed FDD Algorithm with various values of order of differentiation α=0.2 α=0.3 α=0.4 α=0.5 α=0.6 α=0.7 α=0.8 α=0.9 α=1 Mdb025 41.18 36.34 41.80 49.31 49.30 48.67 48.29 35.16 35.39 19.74 0 0 Mdb028 44.18 37.95 44.20 47.17 47.79 47.54 47.71 34.83 33.63 18.20 0 0 Mdb218 45.26 36.95 44.90 46.25 46.90 46.75 45.17 33.35 31.22 17.58 0 0 C_0088 41.05 41.45 37.57 43.50 40.68 37.49 36.75 28.84 33.39 29.98 20.89 0 A_1950 41.32 41.25 36.10 42.23 31.30 30.39 29.41 28.67 28.35 27.60 15.80 0 B_3506 32.14 31.50 26.97 35.36 29.82 29.43 25.68 18.49 17.07 12.39 4.83 0
TABLE III
AVERAGE VALUES OF CII AND SDME FOR MIAS DATASET
Average UM HE AHE α=0.2
CII 0.33 3.36 0.43 1.99
SDME 43.15 43.94 33.06 46.12
TABLE IV
AVERAGE VALUES OF CII AND SDME FOR DDSM DATASET
Average UM HE AHE α=0.2
CII 0.42 0.49 0.46 1.76
SDME 36.16 40.38 42.29 44.12
Fig. 3. Plot of SDME of Sample Images of MIAS dataset.
IV. CONCLUSIONS
The present work investigates fractional order differential based filter (FDD) to enhance low contrast mammogram images. Subjective as well as objective analysis of FDD is performed in comparison with HE, CLAHE, and unsharp masking methods. Enhanced images using HE and CLAHE
show over-enhancement and distortion of breast tissues. Also, the visual quality of unsharp masking is poor as compared to HE, CLAHE, and FDD filter. The proposed FDD filter improves the visual quality of mammogram images without affecting the existing breast tissues structures and abnormal regions for differential order α=0.2.
0 10 20 30 40 50 60
Quantitative values of CII and SDME parameter are also better for differential order α=0.2 as compared to other values of α. In future, the proposed algorithm will be used as pre-processing step for computer-aided breast cancer detection system and enhancement of other medical images.
REFERENCES
[1] A. P. Dhawan, G. Buelloni, and R. Gordon ―Enhancement of mammographic features by optimal adaptive neighborhood image processing,‖ IEEE Transactions on Medical Imaging, vol. 5, no. 1, pp. 8-15, 1986.
[2] W. M. Morrow, R. B.Paranjape, and R. M. Rangayyan ―ReEion-Based Contrast Enhancement of Mammograms,‖ IEEE Transactions on Medical Imaging, vol. 11, no. 3, pp. 392-406, 1992.
[3] A. F. Laine, S. Schuler, J. Fan, and W. Huda, ―Mammographic feature enhancement by multiscale analysis,‖ IEEE Transactions on Medical Imaging, vol. 13, no. 4, pp. 725-740, 1994.
[4] W. Qian, L.P. Clarke, M. Kallergi, and R.A. Clark, ―Tree-Structured nonlinear filters in digital mammography,‖ IEEE Transactions on Medical Imaging, vol. 13, no. 1, pp. 25-36, 1994.
[5] N. Petrick, H. P. Chan, B. Sahiner, and D. Wei, ―An adaptive density weighted contrast enhancement filter for mammographic breast mass detection,‖ IEEE Transactions on Medical Imaging, vol. 15, no. 1, pp. 59–67, 1996.
[6] F. Y. M. Lure, P. W. Jones, and R. S. Gaborski, ―Multiresolution unsharp masking technique for mammogram image enhancement,‖ in Proc. SPIE, vol. 2710, 1996, pp. 830– 839.
[7] G. Ramponi, N. K. Strobel, S. K. Mitra, and T.-H. Yu, ―Nonlinear unsharp masking methods for image contrast enhancement,‖ Journal of Electronic Imaging, vol. 5, no. 3, pp. 353–366, 1996.
[8] Z. Wu, J. Yuan, B. Lv, and X. Zheng, ―Digital mammography image enhancement using improved unsharp masking approach,‖ in Image and Signal Processing (CISP), 2010 3rd International Congress on, vol. 2. IEEE, 2010, pp. 668–672. [9] H. D. Cheng and H. Xu, ―A novel fuzzy logic approach to
mammogram contrast enhancement,‖ Information Science, vol. 148, pp. 167–184, 2002.
[10] F. Sahba and A. Venetsanopoulos, ―Contrast enhancement of mammography images using a fuzzy approach,‖ in Engineering in Medicine and Biology Society, 2008. EMBS 2008. 30th Annual International Conference of the IEEE. IEEE, 2008, pp. 2201–2204.
[11] J. Jiang, B. Yao, and A. M. Wason, ―Integration of fuzzy logic and structure tensor towards mammogram contrast enhancement,‖ Computerized Medical Imaging and Graphics, vol. 29, no. 1, pp. 83–90, 2005.
[12] S. Skiadopoulos, A. Karahaliou, F. Sakellaropoulos, G. Panayiotakis, and L. Costaridou, ―Breast component adaptive wavelet enhancement for softcopy display of mammograms,‖
Lecture Notes in Computer Science, vol. 4046, p. 549, 2006. [13] A. Mencattini, M. Salmeri, R. Lojacono, M. Frigerio, and F.
Caselli,― Mammographic images enhancement and denoising for breast cancer detection using dyadic wavelet processing,‖
IEEE Transactions on Instrumentation and Measurement, vol. 57, no. 7, pp. 1422-1430, 2008.
[14] P. Heinlein, J. Drexl, and W. Schneider, ―Integrated wavelets for enhancement of microcalcifications in digital mammography,‖ IEEE Transactions on Medical Imaging, vol. 22, no. 3, pp. 402–413, 2003.
[15] J. George and S. P. Indu, ―Fast adaptive anisotropic filtering for medical image enhancement,‖ in Signal Processing and Information Technology, 2008. ISSPIT 2008. IEEE International Symposium on. IEEE, 2008, pp. 227–232. [16] Y. Zhou, K. Panetta, and S. Agaian, ―Human visual system
based mammogram enhancement and analysis,‖ in Image Processing Theory Tools and Applications (IPTA), 2010 2nd International Conference on. IEEE, 2010, pp. 229–234. [17] J. H. Yoon, Y.M. Ro, ―Enhancement of contrast in
mammographic images using homomorphic filter,‖ IEICE Transaction on Information and System, vol. 85, no.1, pp. 298-303, 2002.
[18] E. D. Pisano, S. Zong, B. M. Hemminger, M. Deluca, R. Eugene Johnston, K. Muller, M. P. Braeuning, and S. M. Pizer, ―Contrast limited adaptive histogram equalization image processing to improve the detection of simulated spiculations in dense mammograms,‖ Journal of Digital Imaging, vol. 11, no. 4, pp. 193-200, 1998.
[19] J. K. Kim, J. M. Park, K. S. Song, and H. W. Park ―Adaptive mammographic image enhancement using first derivative and local statistics,‖ IEEE Transactions on Medical Imaging, vol. 16, no. 5, pp. 495-502, 1997.
[20] J. Scharcanski and C. Jung, ―Denoising and enhancing digital mammographic images for visual screening,‖ Computerized Medical Imaging and Graphics, vol. 30, no. 4, pp. 243–254, 2006.
[21] J. Tang, X. Liu, Q. Sun, ―A Direct image contrast enhancement algorithm in the wavelet domain for screening mammograms,‖
IEEEJournal of Selected Topics In Signal Processing, vol. 3, no. 1, pp. 74-80, 2009.
[22] K. Panetta, Y. Zhou, S.Agaian, H.Jia, ―Nonlinear unsharp masking for mammogram enhancement,‖ IEEE Transactionson Information Technology In Biomedicine, vol. 15, no. 6, pp. 918-928, 2011.
[23] S. Lai, Xaiobo Li, Walter F. Bischof, ―On techniques for detecting circumscribed masses in mammograms,‖ IEEE Transaction on Medical Imaging, vol. 8, no. 4, 1989.
[24] K. K Singh, M. K. Bajpai, and R. K. Pandey, ―A novel approach for edge detection of low contrast satellite images,‖ The International Archives of Photogrammetry, Remote Sensing and Spatial Information Sciences, vol. 40, no. 3, p. 211, 2015. [25] K. Pandey, S. Suman, K. K. Singh, O. P. Singh, ―An
approximate method for abel inversion using chebyshev polynomials,‖ Applied Mathematics and Computation, vol. 237, pp. 120-132, 2014.
[26] D. Chen, Y.Q. Chen, D. Xue, ―Digital fractional order Savitzky- Golay differentiator,‖ IEEE Transaction on Circuits and Systems-II: Express Briefs, vol. 58, no. 11, pp.758-762, 2011. [27] K. B. Oldham, J. Spanier, Eds., ―The fractional calculus,‖ New
York: Academic, 1974.
[28] I. Podulubny, ―Fractional differential equation, mathematics in science & engineering,‖ Academic Press: California, USA, 1998.
[29] K. Panetta, A. Samani, S. Agaian, ―Choosing the optimal spatial domain measure of enhancement for mammogram images,‖
International Journal of Biomedical Imaging, vol. 2014, 2014. [30] J Suckling et al. ―The mammographic image analysis society
digital mammogram database,‖ in Experta Medica. International Congress Series, vol. 1069, 1994, pp. 375–378. [31] C. Rose, D. Turi, A. Williams, K. Wolstencroft, C. Taylor,
―Web services for the ddsm and digital mammography research,‖ in International Workshop on Digital Mammography. Springer, 2006, pp. 376–383.
ISBN: 978-988-14047-5-6