Contents lists available atScienceDirect
Journal
of
Computational
Physics
www.elsevier.com/locate/jcp
Impact
of
implementation
choices
on
quantitative
predictions
of
cell-based
computational
models
Jochen Kursawe
a,∗,
Ruth E. Baker
a,
Alexander G. Fletcher
b,caMathematicalInstitute,UniversityofOxford,AndrewWilesBuilding,RadcliffeObservatoryQuarter,WoodstockRoad,Oxford,OX26GG,UK bSchoolofMathematicsandStatistics,UniversityofSheffield,HicksBuilding,HounsfieldRoad,Sheffield,S37RH,UK
cBatesonCentre,UniversityofSheffield,Sheffield,S102TN,UK
a
r
t
i
c
l
e
i
n
f
o
a
b
s
t
r
a
c
t
Articlehistory:
Received9December2016 Receivedinrevisedform6April2017 Accepted27May2017
Availableonline31May2017
Keywords:
Vertexmodel Biophysics Tissuegrowth Quantitativepredictions
‘Cell-based’modelsprovideapowerfulcomputational toolfor studyingthe mechanisms underlying the growth and dynamics of biological tissues in health and disease. An increasingamount of quantitative data with cellular resolution has paved the way for thequantitativeparameterisationandvalidation ofsuchmodels.However, thenumerical implementationofcell-basedmodelsremainschallenging,andlittleworkhasbeendoneto understandtowhatextentimplementationchoicesmayinfluencemodelpredictions.Here, weconsiderthenumericalimplementationofapopularclassofcell-basedmodelscalled vertexmodels,whichareoftenusedtostudyepithelialtissues.Intwo-dimensionalvertex models,atissue isapproximated asatessellationofpolygons and theverticesofthese polygonsmoveduetomechanicalforcesoriginatingfromthecells.Suchmodelshavebeen usedextensivelyto studythemechanical regulationoftissue topologyintheliterature. Here,weanalyse howthemodel predictionsmay beaffectedby numericalparameters, suchas the size of the time step, and non-physical model parameters, such as length thresholdsfor cell rearrangement.We findthat vertexpositions and summarystatistics aresensitive toseveral oftheseimplementationparameters.Forexample,the predicted tissue size decreases with decreasing cell cycle durations, and cell rearrangement may besuppressedbylargetimesteps.Thesefindingsarecounter-intuitiveandillustratethat modelpredictions need tobe thoroughlyanalysed and implementation detailscarefully consideredwhenapplyingcell-basedcomputationalmodelsinaquantitativesetting.
©2017TheAuthors.PublishedbyElsevierInc.ThisisanopenaccessarticleundertheCC BYlicense(http://creativecommons.org/licenses/by/4.0/).
1. Introduction
Computational modelling is increasingly used in conjunction with experimental studies to understand the self-organisation of biological tissues [1,2]. Popular computational models include ‘cell-based’ models that simulate tissue behaviour withcellularresolution.Suchmodelsnaturally capturestochasticeffectsandheterogeneitywhenonlyfewcells are presentandcanbe usedtoexplore tissuebehaviourwhencomplexassumptionsonthecellularscaleprevent usfrom derivingcontinuumapproximationsonthetissuescale.Theapplicationsofcell-basedmodelsrangefromembryonic devel-opment[3–7],towoundhealing[8]andtumourgrowth[9].However,thenumericalsolutionofcell-basedmodelsremains challenging since multi-scale implementations of such models,coupling processes at the subcellular, cellular, andtissue
*
Correspondingauthor.E-mailaddress:[email protected](J. Kursawe).
http://dx.doi.org/10.1016/j.jcp.2017.05.048
scales, may sufferfromnumerical instabilities [10,11], andmanysuch modelsinclude parameters of numerical approxi-mationorparameters thathavenodirectphysicalcorrelate.Theseissuesare ofgrowingimportanceascell-basedmodels becomeusedinanincreasinglyquantitativeway[12–14].Thus,weneedtobeawareofanyimpactsthatnumerical imple-mentationchoicesmayhaveonmodelpredictions.
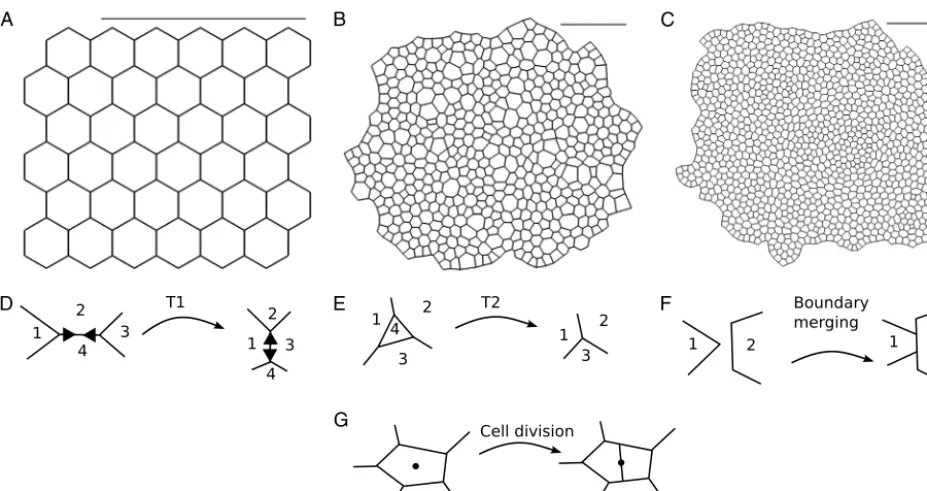
Here, we analyse a well-established class of cell-based model, the vertex model [15], to understand to what extent choices of numerical implementation and non-physical model parameters may affect model predictions. Vertex models were originally developed to studyinorganicstructures, such as foams [16] andgrain boundaries [17,18],where surface tensionandpressuredrivedynamics.Theyhavesincebeenmodified tostudyepithelialtissues [19–22],oneofthemajor tissue types in animals. Epitheliaform polarised sheets ofcells withdistinct apical (‘top’)and basal (‘bottom’)surfaces, withtight lateralattachments nearertheir apical surface.The growthanddynamicsofsuch sheetsplay a centralrole in morphogenesis andwound healing,aswell asindisease; forexample,over 80% ofcancers originate inepithelia [23].In two-dimensionalvertexmodels,epithelialcellsheetsareapproximatedbytessellationsofpolygonsrepresentingcellapical surfaces,andvertices(where threeormorecellsmeet) moveinresponse toforcesdueto growth,interfacial tensionand hydrostaticpressurewithineachcell(Fig. 1A–C).Vertexmodelstypicallyincludecellgrowthandproliferation.Inaddition, cellsexchangeneighboursthroughso-calledT1transitions(Fig. 1D)wheneverthelengthofacell–cellinterfacefallsbelow athreshold,andanytriangularcellwhoseareafallsbelowathresholdisremovedbyaso-calledT2transition(Fig. 1E).
Vertexmodelshavebeenusedtostudyavarietyofprocessesinepithelialtissues[3–6,24–38].Theseprocessesinclude growthofthe
Drosophila
wingimaginaldisc[3,4],migrationofthevisceralendodermofmouseembryos[5],andtissuesize control intheDrosophila
embryonicepidermis [31].Acommonapproachinsuch studiesisto considerforcesonvertices arisingasaresultofminimising thetotalstoredenergyinthetissue.Thefunctionalformforthistotalstoredenergyvaries betweenapplications, but is typically chosen to reflect the effect ofthe force-generating molecules which localise ator neartheapical surface.Thisenergyfunctionisthenusedeithertoderiveforcesthat feedintoadeterministicequation of motionforeachvertex,whichmustbeintegratedovertime[4,24,28],orelseminimised directlyassumingthetissuetobe inquasistaticmechanicalequilibriumatalltimes[3,25].AthirdapproachistoapplyMonteCarloalgorithmstofindenergy minima[39,40].Previous theoretical analyses of vertex models have elucidated ground state configurations and their dependence on themechanicalparametersofthemodel[41],inferredbulkmaterial properties[42–44],andintroducedwaysto superim-posefinite-elementschemes fordiffusingsignalswiththe modelgeometry[45]. Inother work,vertexmodelshavebeen comparedtolattice-basedcellularPottsmodelsandothercell-basedmodellingframeworks[46,47].
Inthecaseofvertexmodels ofgrain boundaries,theauthorsof[18] proposed anadaptivetime-steppingalgorithmto accurately resolve vertexrearrangements without theneed of ad-hocrearrangement thresholds andprovidea numerical analysisof the simulation algorithm.However, vertex models inthat context onlyconsider energy termsthat are linear ineach grain-grain (or cell–cell)interface length, whereas theenergyterms invertexmodels ofbiological cells typically dependnon-linearlyoncellareasandperimeters.
Importantly,previousstudiessuch as[18] donotanalysetowhatextentchangesinhiddenmodelparameters,such as parameters ofnumericalapproximation, likethe sizeofthe time step,ornon-physicalmodel parameters,such aslength thresholds for cell rearrangement, can influence vertex configurations and other summary statistics. Here, we analyse a force-propagationimplementationofvertexmodels[48,49]asappliedtoawidelystudiedsystemindevelopmentalbiology, thelarvalwingdiscofthefruitfly
Drosophila
[3,4,25].Weconductconvergenceanalysesofvertexpositionswithrespectto allnumericalandnon-physicalmodelparameters,andfurtheranalysetowhatextentexperimentallymeasurablesummary statisticsoftissuemorphology,suchasdistributionsofcellneighbournumbersandareas,dependontheseparameters.Wefindthatvertexmodelpredictionsaresensitivetothelengthofcellcycleduration,thetimestep,andthesizeofthe edgelengththresholdforcellrearrangement.Specifically,vertexconfigurationsdonotconvergeasthetimestep,theedge lengththresholdforcellrearrangement,ortheareathresholdforcellremovalarereduced.Forexample,reductionsinthe cellcycledurationmaypromotecellremovalandreducethesizeofthesimulatedtissuebyuptoafactoroftwo.Wefind thatboththesizeofthetimestepandthesizeoftheedgelength thresholdcaninfluencetherateofcellrearrangement. Counterintuitively,therateofcellremovalisrobusttochangesintheareathresholdforcellremovalovermultipleorders ofmagnitude.Further,analysingtheactiveforceswithinthetissuerevealsthatverticesaresubjecttostrongerforcesduring periodswhencellsgrowanddivide.
Theremainderofthepaperisorganisedasfollows.Insection2,wedescribeourvertexmodelimplementationofgrowth inthe
Drosophila
larvalwingdisc.Insection3wepresentourresults.Finally,wediscussourresultsanddrawconclusions fortheuseofcell-basedmodelsinquantitativebiologyinsections4and5.2. Methods
Fig. 1.Two-dimensionalvertexmodelsrepresentcellsinanepithelialtissueaspolygonsandallowdifferenttypesofvertexrearrangement.(A–C)Snapshots ofanexamplevertexmodelsimulationusedinouranalysis.Thegrowinginsilicotissueundergoesfiveroundsofcelldivision.(A)Theinitialconditionis ahexagonalpackingof36cells.(B)Simulationprogressafter6,750timeunitsatanintermediatestageoftissuegrowth.Thetissueboundaryisallowed tomovefreelyandindividualcellsgrowbeforedivision.(C)Snapshotofthetissueattheendofthesimulationat27,000timeunits.Afterthefifth(last) roundofdivisionsthetissuerelaxesintoastableconfiguration.Simulatedtissuesin(B–C)arerescaledtofittheview,ascalebaroffixedlengthisadded forcomparison.ParametervaluesarelistedinTable 1.Throughoutthesimulation,verticesmayrearrangebyT1transitions(D),T2transitions(E),boundary merging(F),andcelldivision(G).
Equations of motion Intwo-dimensionalvertexmodelsepithelialtissuesarerepresentedastessellationsofpolygonsthat ap-proximatetheapicalcellsurfaces.Wepropagatethepositionofeachvertexovertimeusinganoverdampedforceequation, reflectingthatcelljunctionsarenotassociatedwithamomentum.Theforceequationtakestheform
μ
dxidt
= −
∇
iE,
(1)where
μ
is thefriction strength,x
i(
t)
istheposition vectorofvertex i attime t,and E denotesthe totalstoredenergy.The numberofverticesinthesystemmaychangeovertime duetocelldivision andremoval. Thesymbol
∇
i denotesthegradientoperatorwithrespecttothecoordinatesofvertex
i
.ThetotalstoredenergytakestheformE
=
α K
2
(
Aα−
A0,α)
2+
i,j
li,j
+
α
2P
2
α
.
(2)Here, the first sumruns over every cell
α
inthe tissue, Aα denotes the area ofcellα
and A0,α is its target area. This termpenalisesdeviationsfromthetargetareaforindividualcells, thusdescribingcellularbulkelasticity.The secondsum runsoverallcelledgesi,
j
inthesheetandpenalises longedges(wechoose>
0),representingthecombinedeffectof bindingenergyandcontractilemoleculesattheinterfacebetweentwocells.Thethirdsumalsorunsoverallcells,and Pα denotes theperimeterofcellα
.Thistermrepresentsacontractileacto-myosincablealongtheperimeterofeachcell[3]. TheparametersK
,,and
togethergovernthestrengthoftheindividualenergycontributions.
Before solvingthemodelnumerically,wenon-dimensionaliseittoreducethenumberoffree parameters[3].Rescaling spacebyacharacteristiclengthscale,
L
,chosentobethetypicallengthofanindividualcell,andtimebythecharacteristic timescale,T
=
μ
/
K L2,equations(1)and(2)becomedxi dt
= −
∇
iE
,
(3)E
=
α1 2
(
A
α
−
A0,α)
2+
i,j
li,j
+
α2P
2
α
,
(4)Table 1
Descriptionofparametervaluesusedinoursimulations.
Parameter Description Value Reference
Cell–cell adhesion coefficient 0.12 [3] Cortical contractility coefficient 0.04 [3]
t Time step 0.01 [48]
Amin T2 transition area threshold 0.001 [48]
lT1 T1 transition length threshold 0.01 [48] ρ New edges after a T1 transition have the lengthlnew=ρlT1 1.5 [48]
As Initial cell area 1.0 [3]
As
0 Initial cell target area 1.0 [3]
Ns Initial cell number 36 [3]
tl Mean cell cycle duration 1,750 –
ttot Simulation duration 27,000 –
nd Total number of divisions per cell 4 – Forparametervaluesforwhichnoreferenceisgiven,pleaseseemaintextfordetailsonhowthese valueswereestimated.Spatialandtemporalparametersarenon-dimensionalised(seesection2for details).
withrespecttotherescaled
i
thvertexposition.Inthenon-dimensionalisedmodel,cellshapesaregovernedbytherescaled target area ofeach cell A0,α andtherescaled mechanical parameters,and
. Fortheseparameters we usepreviously proposedvalues[3],unlessstatedotherwise.AcompletelistofparametersusedinthisstudyisprovidedinTable 1.
Tosolveequations(3)and(4)numericallyweuseaforwardEulerscheme:
xi
(
t+
t
)
=
xi(
t)
−
∇
iE(
t)
t.
(5)Weanalysethedependenceofsimulationoutcomesonthesizeof
tintheResultssection.
Initial and boundary conditions Initially,thesheetisrepresentedbya regularhexagonallatticeofsixbysixcells (Fig. 1A). Theboundaryofthelatticeisallowed tomovefreelythroughoutthesimulation.Eachcell hasinitial areaandtargetarea
As
=
As0
=
1,respectively.Cell neighbour exchange and removal T1transitions (Fig. 1D) are executed wheneverthelength of agivenedge decreases belowthethreshold
l
T1=
0.
01.Thelengthofthenewedge,l
new=
ρ
lT1(
ρ
=
1.
5)
,ischosentobeslightlylongerthanthis thresholdtoavoidanimmediatereversionofthetransition.Asecond topologicalrearrangement invertexmodelsisa T2transition, duringwhich asmalltriangularcell orvoidis removed fromthetissue andreplacedby anewvertex(Fig. 1E).In ourimplementationanytriangularcell isremoved if its areadropsbelowthethreshold AT2
=
0.
001.Theenergyfunction,equation (2),inconjunctionwithT2transitionscan be understood asa model forcell removal: cells are extruded fromthe sheet by a T2transitionif the energyfunction, equation(2),leadstoasufficientlysmallcell.Notethatinequation(2)thebulkelasticityorareacontributionofacellα
is finiteevenwhenthearea Aα iszero,allowingindividualcellstobecomearbitrarilysmallifthisisenergeticallyfavourable. As cells decrease in area they typically also reduce their number of sides. Hence, it is sufficient to remove only small triangularcellsinsteadofcellswithfourormoresides[3,4,25].Wefurthermodelthemergingofoverlappingtissueboundaries(Fig. 1F).Whenevertwoboundarycellsoverlap,anew edgeoflength
l
newiscreatedthatissharedbytheoverlappingcells.Incaseswherethecellsoverlapbymultiplevertices, orifthesamecellsoverlapagainafterapreviousmergingofedges,theimplementationensuresthattwoadjacentpolygons neversharemorethanoneedgebyremovingobsoletevertices.Themergingofboundaryedgesisdiscussedinfurtherdetail in[48].Cell growth and division Unlessstatedotherwisethetissueissimulatedfor
n
d=
5 roundsofdivision,i.e.eachcelldividesexactly
n
d times.Tofacilitatecomparisonwithprevious simulations ofthewingdisc whereverticeswere propagated byminimisingtheenergyfunction (2) [3,41],we modeleachcell tohavetwo cellcyclephases:quiescentandgrowing.The durationofthefirst,quiescent,phaseofthecellcycleisdrawnindependentlyfromanexponentialdistributionwithmean 2tl
/
3,wheret
listhetotalcellcycleduration.Weintroducestochasticityinthisphaseofthecellcycletoavoidbiologically unrealisticsynchronous adjacent divisions;thisalso helpskeepingthe simulations ina quasistaticregime sinceadjacent divisionsarepreventedfrominfluencingeachother,thus maintainingmechanicalequilibrium.Thedurationofthesecond, growing,phaseofthecellcycleisfixedatlengtht
l/
3 foreachcell.Duringthistimethetargetarea, A0,α,ofthecellgrows linearlytotwiceits originalvalue.Upon completionofthegrowthphase,thecelldivides.Wechoose afixeddurationfor thegrowthphasetoensuregradual, quasistaticcell growth.Two-stagecellcycleswithanexponentially distributedanda fixed length contributionhavepreviously been observedin variouscell cultures [50,51] andhavebeenapplied to model growthintheDrosophila
wingimaginaldisc[28].Initialise timet=0; Generateinitialconfiguration;
whilet<ttotdo
1.Updatecelltargetareas;
2.Performcelldivisiononcellsthathavereachedtheendoftheircellcycle; 3.PerformanyT2transitions;
4.PerformanyT1transitions; 5.Performboundarymerging;
6.Propagatevertexpositionsusingequation(3); 7.Incrementtimebyt;
end
Algorithm 1:Pseudocode of the simulation algorithm.
cell cycle durationsare stochastic, while allowing the growth phase to occupy a significant proportion of the total cell cycleduration,ensuringgradual,quasistaticgrowth.Theassumptionthatthetissueisinaquasi-steadystateiscommonin vertexmodels[3,27,28,34]andreflectsthefactthatthetimescalesassociatedwithmechanicalrearrangements(secondsto minutes)areanorderofmagnitudesmallerthantypicalcellcycletimes(hours)[3].
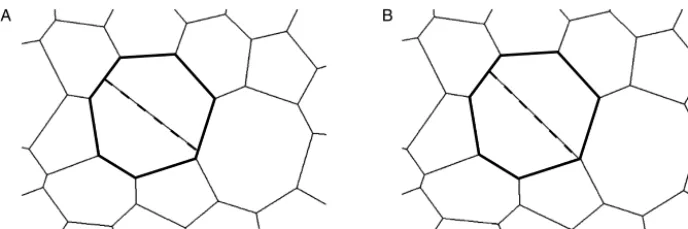
At each cell division event, a newedge iscreated thatseparates thenewly created daughtercells (Fig. 1G).The new edge is drawn along the shortaxis ofthe polygon that represents themother cell [48]. The shortaxis hasbeen shown to approximate the division direction(cleavage plane)of cells in avariety of tissues [52],including the Drosophilawing imaginal disc [53]. The short axis ofa polygon crosses thecentre of mass ofthe polygon, andit is defined asthe axis around whichthe momentofinertiaof thepolygonismaximised.Each daughtercell receives halfthetarget area ofthe mothercellupondivision.
Applying thiscellcyclemodel,weletthetissuegrowfor
n
d=
5 generationsuntilitcontainsapproximately1,000 cells,making itsufficiently largetoobtain summary statisticsofcellpacking.Note thattheprecise numberofcells attheend ofthesimulationvaries,duetovariationsinthenumberofT2transitionsbywhichindividualcells areremovedfromthe tissue.Eachcellofthelastgenerationremainsinthequiescentphaseofthecellcycleuntilthesimulationstops.Weselect the totalsimulationtime tobe
t
tot=
27,
000,unlessspecified otherwise.Thisdurationis chosensuch that thetissuecan relaxintoitsequilibriumconfigurationafterthefinalcelldivision.Computational implementation WeimplementthemodelwithinChaste,anopensourceC++librarythatprovidesa system-atic framework forthesimulationofvertexmodels [48,49].Ourcode isavailable inthesupplementary material asazip archive.Pseudocode forourimplementation isprovidedin Algorithm 1.Eachtime stepstarts by updatingthe celltarget areas. Then, cell division, removal (T2transitions), rearrangement (T1 transitions), andboundary merging are performed beforeincrementingthesimulationtime.Thealgorithmstopswhentheendtimeofthesimulationisreached.
3. Results
In this section, we analyse how model behaviour dependson numericaland non-physical model parameters. Vertex modelsaretypicallyusedtopredictsummarystatisticsofcellpackingandgrowth,suchasthedistributionofcellneighbour numbersandareas[3,25].Weanalysehowthesesummarystatisticsdependonsimulationparameters.Specifically,wefocus onthefinalnumberofcellsinthetissue,thetotaltissuearea,thenumbersofcellrearrangements(T1transitions)andcell removals (T2transitions),thedistributionofcell neighbournumbers,andthecorrelation betweencellneighbournumber andcellarea.Notethatweexcludecellsonthetissueboundaryfromstatisticsofcellneighbournumbersinordertoavoid boundaryartefacts,whichcanbeseeninFig. 1C.InFig. 1C,cellshapesalong thetissueboundarydifferfromthoseinthe bulk ofthetissue, andthecellneighbournumberis poorlydefinedforcells alongthe tissueboundary, sinceit doesnot coincidewiththenumberofcelledges.
Tissue size is sensitive to cell cycle duration
Inprevious vertexmodelapplications[3,4,25],experimentally measuredsummarystatisticsofcellpackingwere repro-duced usingan energyminimisationimplementation.Such energyminimisation schemesassume quasistaticevolution of the sheet, wherethetissue isin mechanicalequilibriumatall times.Itis unclearto whatextent summary statisticsare preservedwhenthetissueevolvesinadynamicregime.
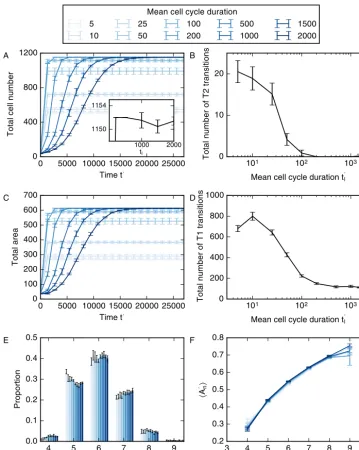
Fig. 2.Variationofcellnumbers(A),numberofT2transitions(B),tissuearea(C),totalnumberofT1transitions(D),cellneighbournumberdistribution(E) andmeanareaperpolygonclass(F)withmeancellcycleduration.Errorbarsdenotestandarddeviationsacross100simulations.Allsimulationparameters areprovidedinTable 1.
the numberof cell rearrangementsor the numberof cellremoval convergenumericallyas themean cell cycleduration increases,duetothestochasticnatureofthesystem.
Fig. 3.Magnitudeofarea(A),edge(B),andperimeterforce(C)contributionsovertime.Thesolidlinesrepresenttheaverageofforcecontribution mag-nitudesacrossallverticesofonesimulation.Theshadedregionsrepresentonestandarddeviationoftheforcecontributionmagnitudesacrossthetissue. A cellcycledurationoftl=2000 isused.AllotherparametersarelistedinTable 1.
Anothercommon summarystatistic ofcell packingisthe meanarea ofcells ofeach polygonnumber
An,where·
denotes anaverage acrossallcells inthetissuethat arenot onthetissueboundary, A istherescaledcell area,andn
is thepolygonnumber,i.e.thenumberofneighboursthateachcellhas.Thissummary statisticisoftenusedtocharacterise epithelia [3,26,54,55].We find thatthe meancell area foreach polygon numberis not sensitiveto changes incell cycle lengthandincreasesmonotonicallywithpolygonnumber(Fig. 2F).We interpretthedata inFig. 2asfollows.Differencesintissuesize andcellpackingarise duetoa sensitiveinterplay betweenthecellcycledurationandthetimescaleformechanicalrelaxationofthetissue,
T
.Growingcellspushagainsttheir neighbours,leadingtotissuegrowth.Thisoutwardmovementiscounteractedbythefrictiontermintheforceequation(1). As cellsgrowmorequickly,i.e.withsmallercellcycledurations,theforcerequiredtopushthesurroundingcellsoutward increases. For sufficiently small cell cycledurations, the forces maybecome strong enough to causecell extrusion. This finding maynotbe biologicallyrelevantwhen studyinggrowthintheDrosophila
wingimaginaldisc,sinceinthissystem thetimescalesformechanicalrearrangementareordersofmagnitudesmallerthanthetimescalesassociatedwithgrowth andproliferation[3].Howeverourresultssuggestthat,inothersystems,wherecellsdivideonthetimescales ofminutes ratherthanhours,suchastheDrosophila
embryonicepidermis,cellextrusionmaybeinducedduringperiodsoffasttissue growth.Cell growth and division increase forces within the tissue
Theenergyexpression(4)leadstothreedifferentforce contributionsoneachvertex:an areaforce;an edgeforce;and aperimeterforce.InFig. 3weanalysethemagnitudeofthesecontributionsforasimulationwithmeancellcycleduration
tl
=
2000. The solid line represents the average magnitudes for the individual contributions for all forces inthe tissue, and the shaded areasmark one standard deviation. The strongest force contributionis the area force (Fig. 3A), whereas the weakestistheedgeforce (Fig. 3B).Thisrelationship isintuitiveifoneconsiders thedirectionsoftheindividualforce contributions when bothand
are positive: Mostcells in the tissue haveareas smallerthan their target area of1.0 (compare with Fig. 2F), henceforan individual cell, thearea force contribution points outwardsfromthe cell. Theedge contribution and perimetercontribution (Fig. 3C)point inwards forindividual cells, thus counteractingthe area force. It follows that the area contributionis strongest since, inmechanical equilibrium, it counteracts the sum ofthe edge and perimeter contributions.The variation ofeach force contributionhasthe sameorderof magnitudeastheir meanvalues, illustrating that the forces on vertices can vary strongly across the tissue. The force magnitudes change throughout the simulation,andthey peakatavaluethat is50%higherthanthefinal values.Fortimeslargerthan 15000time units,the forcesdonot changewithtime inFig. 3.Atthistimecells stopdividingandthefinal cellnumberisreached,illustrating thattheforcesarelargestwhenthetissuesizeisincreasingmostrapidly.Thistransientriseinforcesemergesbecausecells intheinteriorofthesimulatedtissuepushontheirneighboursastheygrowbeforedivision.Theseobservationsenableus topredictthatcellsundergoingactiveprocesses,suchasgrowthanddivision,aresubjecttosignificantlyhigherforcesthan cellsinquiescenttissues.
Large time steps suppress cell rearrangement
Fig. 4.Variationinsimulationresultwiththe timestep.(A)Theerrorfunction(6)for100differentrealisationsofthemodelplottedasoverlapping, opaquecurves.Theerrorfunctiondecreasesasthetimestepisdecreased,butdoesnotconvergeforallsimulations.(B)Thedependenceofthenumber ofT1transitionsonthetimestepfor100modelrealisations.ThenumberofT1transitionsinthesimulationsisstablefortimestepssmallerthan0.02 anddecreaseswithtimestepsgreaterthan0.002.(C)Fortimestepst<0.02 thecellneighbournumberdistributionisstable;themeansofindividual polygonclassproportionsvarybylessthan0.01.Inthesesimulations,cellsundergond=4 roundsofdivision,andthetotalsimulationtimeisttot =21,000. AllotherparametervaluesarelistedinTable 1.Errorbarsdenotestandarddeviationsacross100simulations.
kt
=
jxkj
−
j
xkj−1
,
(6)wherethesumsrunoverallrescaledvertexpositions,
x
kj,attheendofthesimulationwithtimesteps
tkand
tk−1.The errorfunction(6)evaluatesthedifferencesbetweenthesumsoffinalvertexpositionsatdecreasingvaluesofthetimestep. Toensurethatsimulations withconsecutivevaluesofthetime stepfollowidenticaldynamicswe generatefixed seriesof exponentiallydistributedrandomvariatesfromwhichwecalculatethecellcycledurations.
Weplotresultsofouranalysisoftheconvergenceofthevertexpositionswiththetimestep
tinFig. 4.Ingeneral,the errorfunctiondoesnotconverge. However,formostsimulationstheerrorfunction (6)assumesvaluessmallerthan 10−1 fortime stepssmaller than10−2 (Fig. 4A). Notethat thistimestep isfiveorders ofmagnitudesmallerthan theaverage cell cycleduration. When the time stepis larger than 10−2 the errorfunction (6) is larger than one since a significant numberofT1transitionsaresuppressed.Onrareoccasions,forlessthanfiveexamplesoutof100,theerrorfunctionmay be non-negligibleeven ifthetime step issmallerthan 10−2.Theselarge valuesofthe errorfunction (6)reflectchanges inthe numberofT1transitionsasthetime stepdecreases (Fig. 4B).When thetime step issmallerthan 10−2 summary statisticsofcell packing,suchasthedistributionofcell neighbournumbers (Fig. 4C)orthetotal numberofcells, donot changeasthetime stepisdecreased further.Notethat thedistributionofcellneighbournumbers inFig. 4Cdiffers from thoseinFig. 2duetothedecreasednumberofdivisionspercell,
n
d.Further,weconcludefromouranalysisinFig. 4thatitisnecessarytouseatimestepsmallerthan0.01inordertoarriveatphysicallymeaningfulsolutionsofthevertexmodel, sinceotherwisetheamountofcellrearrangementandsummarystatisticsofcellpackingwillbeaffectedbythenumerical implementationofthemodel.
Fig. 5.Differencesinvertexconfigurationscanariseinsimulationsrunwithdifferenttemporalresolution.Adividingcellinsimulationsrunwithtime stepst=0.004 (A)andt=0.002 (B)isshowninbold.Duringthecelldivision,anewcell–cellinterface(dashedline)iscreatedalongtheshort axisofthedividingcellbycreatingnewvertices(seeMethodssectionfordetails).Thedaughtercellsofthedividingcellcontaindifferentverticesinthe configurationscorrespondingtothetwotimesteps.Thisleadstodifferentvertexconfigurationsattheendofthesimulations.
Fig. 6.Variationinsimulationresultwiththetimestepifafourth-orderRunge–Kuttaschemeisused.Theerrorfunction(6)for100differentrealisations ofthemodel,evaluatedusingafourth-orderRunge–Kuttascheme,isplottedasoverlapping,opaquecurves.Theerrorfunctiondecreasesasthetimestep isdecreased,butdoesnotconvergeforallsimulations.ThisresultissimilarforsimulationsrunwithaforwardEulerschemeinFig. 4A.
Model convergence with time step is not improved if higher-order numerical methods are used
The results in Figs. 4 and 5were generatedby propagating the vertexpositions using a forward Eulertime-stepping scheme. The choiceof a forwardEulerscheme overmore accurate numericalmethods iscommon invertexmodels. For example,inaprevious applicationwhereatissuewasrelaxedstarting fromarandominitialcondition,itwasshownthat, in ordertoaccuratelyresolve allT1transitions,sufficientlysmalltime steps hadto bechosen thatthe benefitsofhigher order numerical methods were negligible [56]. However, in Figs. 4 and 5 vertex positions do not converge asthe time stepisdecreasedduetodifferencesinT1transitionsandcelldivisionsforvaryingvaluesofthetimestep,suggestingthat convergencemightbeachievedifhigher-ordernumericalmethodswereused.WetestthishypothesisinFig. 6,wherewe record the errorfunction(6)when propagatingthe vertexmodelwithafourth-order Runge–Kuttatime-steppingscheme asfollows.First,allverticesareaccumulatedintothevertexvector
x
,suchthatifthereareN
verticesattimet
thenthe vectorx
(
t)
has2N components.Wepropagatethevertexvectorusingx
(
t+
t
)
=
x(
t)
+
t
6
(
k1+
2k2+
2k3+
k4) ,
(7)k1
= −
∇
E(
t,
x(
t)),
(8)k2
= −
∇
E(
t+
t
2
,
x(
t)
+
t
2 k1
),
(9)k3
= −
∇
E(
t+
t
2
,
x(
t)
+
t
2 k2
),
(10)k4
= −
∇
E(
t+
t
,
x(
t)
+
tk3
).
(11)Here,
∇
denotesthegradientwithrespecttothevectorx
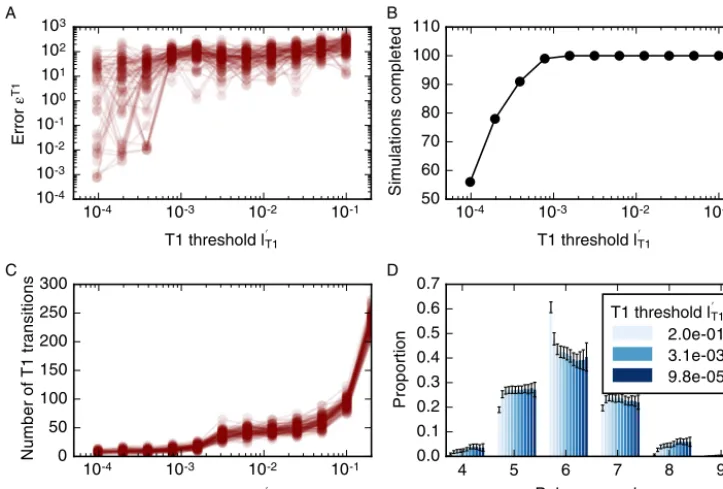
.Fig. 7.VariationofsimulationresultwithsizeoftheT1transitionthreshold,lT1.(A)ThedependenceoftheerrorfunctiononlT1for100modelrealisations. Theerrorfunction(12)doesnotconvergeaslT1decreases.(B)ForsmallvaluesoftheT1transitionthreshold,somesimulationsfailtocomplete(seemain text).(C)ThedependenceofthenumberofcellrearrangementsonlT1 for100modelrealisations.Thenumberofcellrearrangementsislargerthan100 foralargevalueoftherearrangementthreshold,lT1>0.1,whereascellrearrangementsaresuppressedforsmallvaluesoftherearrangementthreshold,
lT1<0.001,withcellrearrangementnumberslessthan 30.(D)Varyingamountsofcellrearrangementleadtodifferentdistributionsincellneighbour numbers.ParametervaluesarelistedinTable 1.Errorbarsdenotestandarddeviationsacross100simulations.
fourth-orderRunge–Kuttaschemerequiretimestepssmallerthanroughly0.01inorderfortheerrorfunction(6)toassume valuessmallerthanoneonaverage,whileexhibitingasimilardegreeofvariabilityacrossallsimulations.
Occurrence of cell rearrangements is regulated by rearrangement threshold
WefurtheranalysethedependenceofvertexpositionsandsummarystatisticsontheT1transitionthreshold,
l
T1.Similar tothetimestepconvergenceanalysis,wedefineaseriesofdecreasingvaluesofl
T1,kandtheerrorfunctionkT1
=
jxkj
−
j
xkj−1
,
(12)whichmeasuresthedifferencebetweenthefinalvertexpositionsofsimulationswithdecreasingvaluesoftheT1transition threshold,
l
T1,k.The variationofthe errorfunction withdecreasingvaluesofl
T1,k isshowninFig. 7A.Forall considered valuesofl
T1 theerrorfunctiondoesnotconvergeandvariesbetweenvaluesof1 and103.Onlyforl
T1<
10−3istheerror function (12)smallerthan one forsome simulations. However, forsuch smallvaluesofl
T1, manysimulations failasthe simulation algorithm encounters situations that it cannot resolve, for example configurations includingoverlapping cells (Fig. 7B).AlargeT1transitionthresholdof0.2lengthunitsleadstoalargenumberofT1transitions,whereas T1transitionsare suppressed forthresholdsof 0.003 length unitsorsmaller (Fig. 7C). Thisvariation inthe numberofcell rearrangements influencessummary statisticsofcellpacking,forexampleleadingto variationsinthecell neighbournumberdistribution. Forlargerearrangementthresholds,e.g.
l
T1=
0.
2,thenumberofcellrearrangementsishigh,leading toahighproportion ofhexagons(around0.6),whereassuppressionofcellrearrangementsforsmallcellrearrangementthresholds,forexamplelT1
=
0.
2,leadstoawiderdistributionofcellneighbournumberswithaproportionofhexagonsbelow0.4.Thenumberof cellrearrangementsisstablebetweenT1transitionthresholdsof0.02and0.003.Inthisregime,theproportionofhexagons variesslightlybetween0.425and0.409(Fig. 7D).DespitethestablenumberofT1transitionsacrossthisparameterregime between0.02 and0.003the finalvertexpositions differforanytwo valuesoftheT1transitionthreshold,asreflectedin valuesoftheerrorfunction.Fig. 8.SmallvaluesoftheT1transitionthreshold,lT1<10−3,suppressrearrangementandleadtofailureofthesimulationalgorithm.Oneofthefailing simulationsinFig. 7isanalysed.Thetissueconfigurationinthelasttimestepbeforesimulationfailurecontainstwoverticesthatappeartobemerged duetoashortedgeonthetissueboundary.Theshortedgeisindicatedbyanarrow(A)andmagnifiedforthepenultimate(B)andfinalcompletedtime step(C)ofthesimulation.Sincetheshortedgeinthepenultimatetimestepispreventedfromrearranging,thetwoadjacentboundarycellsintersecteach other,leadingtofailureofthesimulation.
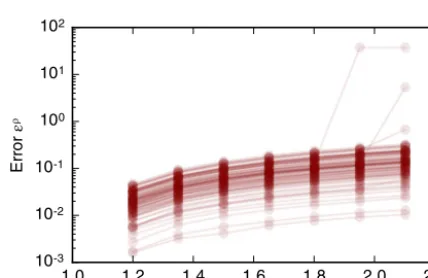
Fig. 9.DependenceofsimulationresultsonthelengthofedgescreatedbyT1transitions,lnew =ρlT1.Theerrorfunction(13)isrecordedfor100simulations. AllsimulationparametersarelistedinTable 1.Theerrorfunctionissmallerthanoneforρ<2.0.
thesimulationatthelasttwotimestepsbeforesimulationfailure.Duetoashortedgetwoboundaryverticesinthetissue appear merged(arrowinFig. 8A). Thisshortedgeismagnifiedforthepenultimate (Fig. 8B)andlasttime steps (Fig. 8C) before simulation failure. At this last time step, one of the boundary cells becomes concave. The simulation then fails sinceourvertexmodelimplementationcannotresolvethisconfiguration.Whentwoboundarycellsoverlap,thesimulation procedureattemptstomergethevertexwithitsclosestcellboundary.Thisprocedurefailsbecausetheidentifiedboundary isinternaltothetissueratherthanaboundaryinterface.
Simulation results are robust to variation in length of newly formed edges
WhencellsexchangeneighboursbywayofT1transitions,newedgesareformed.Eachnewedgehaslength
l
new=
ρ
lT1. In ordertoinvestigatetheextenttowhichchanges inthelengthofnewly formededges canaffectsimulationresultswe defineaseriesofincreasingvaluesforρ
k andtheerrorfunctionkρ
=
jxkj
−
j
x0j
,
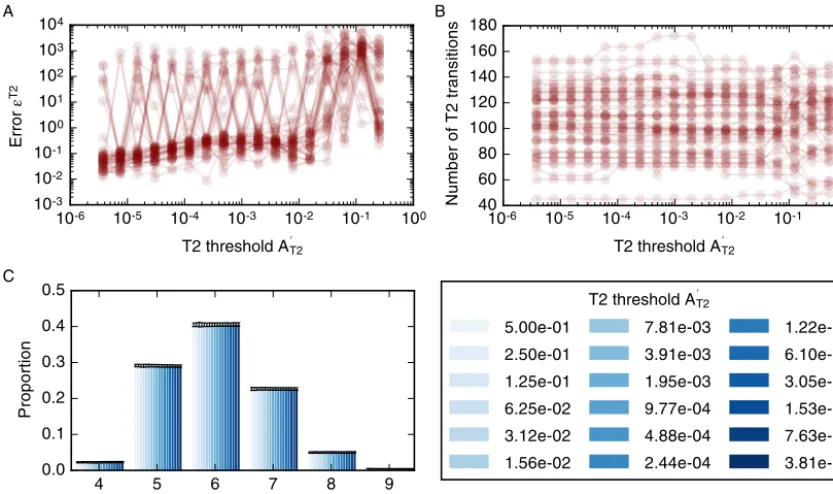
(13) [image:11.561.169.383.306.445.2]Fig. 10.DependenceofsimulationresultsontheT2transitionthreshold,AT2.(A) Thedependenceoftheerrorfunction(14)ontheT2transitionthreshold for50modelrealisations.Theerrorfunctionassumesvalueslessthanonefor AT2<10−2butdoesnotconverge.(B) ThetotalnumberofT2transitions for50modelrealisationsisstableforallobservedvaluesofAT2.(C) Tissue-levelsummarystatisticssuchasthecellneighbournumberdistributionarenot affectedbychangesinthethreshold.Errorbarsdenotestandarddeviationsacross50simulations.Simulationsarerunwithnd=8 roundsofdivision,acell cycledurationoftl=700,andtotalsimulationtimettot=19600.AllfurthersimulationparametersarelistedinTable 1.
Rate of T2 transitions is robust to variation in the T2 transition threshold over five orders of magnitude
Next,weturntothevalueoftheT2transitionthreshold.Wedefinea seriesofdecreasingvaluesof Ak
T2 andtheerror function
kT2
=
jxkj
−
j
xkj−1
,
(14)whichmeasuresthedifferencebetweenthefinalvertexpositionsofsimulationswithdecreasingvaluesoftheT2transition threshold, AT2k.Toanalysethevalue oftheerrorfunction(14)inasimulationwithasignificantamountofcell rearrange-mentandremovalwerunsimulationswith
n
d=
8 generations,acellcycledurationoft
l=
700,andtotalsimulationtimettot
=
19600.AllotherparametervaluesarelistedinTable 1.The value of the error function, on average, is small (Fig. 10A). However, the error function does not converge for individual simulations and may be large between consecutive values of the threshold. In particular, the error function doesnot convergeto zero.As the threshold decreases, the overall numberof T2transitions in the simulations isstable at approximately 150 T2 transitions per simulation (Fig. 10B). However, for individual simulations, the total numberof T2 transitions may vary by up to 10 asthe threshold AT2 is decreased. The overall number of T2transitions does not changeoveralargerangeofT2transitionthresholdsthatcoversmultipleordersofmagnitude,andallsimulationscomplete withouterrorseveniftheT2transitionthresholdissmallerthan10−6,whichisthreeordersofmagnitudessmallerthan thestandardvalueforthisparameterinoursimulations.TheindependenceofthenumberofT2transitionsofthethreshold
AT2k isreflectedintissue-levelsummarystatistics,suchasthedistributionsofcellneighbournumbers,whichareunaffected bychangesintheT2transitionthreshold(Fig. 10C).
Dependence of the simulation results on the update ordering in each time step
one time step may have an impact on simulation outcomes. Our results imply that no adjacent two edges undergo T1 transitionsin100samplesimulations.
4. Discussion
Cell-based models havethepotential tohelp unravelfundamental biophysicalmechanismsunderlying thegrowthand dynamics ofbiologicaltissues. However, thenumericalimplementationofsuch modelsis rarelyanalysed andthe depen-denceofmodelpredictions onimplementationdetails oftenremainsunexplored.Here,we analysea widelyapplied class ofcell-basedmodels,avertexmodel,andprobetowhatextentexperimentallyrelevantsummarystatisticscandependon implementationdetails,suchasthechoiceofnumericalornon-physicalmodelparameters.
For example, we find that the speed at which cells grow and divide relative to the speed of tissue relaxation can significantly alter
in silico
tissuebehaviour.Thetotalnumbercellsinthetissue,aswellasthetissuearea andthenumber ofcellrearrangements,variesbyuptoafactoroftwoasthemeancellcycledurationischanged.Summarystatisticsofcell packing, suchasthedistribution ofcellneighbournumbers, orthecorrelation betweencellneighbournumberandarea, are lessstronglyaffectedbytheexact choiceoftimescale;themainfeatures ofthesestatisticsare preservedinallcases. Thisfindingthatthetotalcellnumberandtissueareadependonthemeancellcycledurationsuggeststhatcellextrusion maybeinducedinfast-growingtissues.Thedistributionofcellnumbersforthecaseofquasistaticsimulations,identifiedassimulationswhereincreasesinthe cell cycleduration would not lead to an overall increase in tissue area or cell number, differs frompreviously reported results[3].Specifically,we observefewerpentagonsthanhexagons.Thisdiscrepancymightarise fromadifferenceinhow equation (2)isusedtoevolve thetissue.Forexample,ourimplementationofthecellcyclediffersfromother implemen-tations wherethe cell cycledurationvariesspatially in thetissue [4,24,28].Further, in[3],a globalenergyminimisation schemeisusedtopropagatevertexpositions,whereasamoreaccurateforce-basedapproachisusedhere.Amajor differ-encebetweenthetwoapproachesisthefractionofcellsinthetissuethatareallowedtogrowanddivideconcurrently.In ourimplementation,uptoonethirdofthecellsundergocell-growthatanygiventime,whereasinotherimplementations all cells growanddivide sequentially.Furtheranalysisis requiredtounderstandto whatextent synchronousgrowthand division can affectcellpackingin epithelialtissues.Milan etal.report that up to1.7%ofcells inthe earlywingdiscare mitotic atanygiventime[57].However, mitosisandcellgrowthmaynothappenconsecutively,hencetheoptimalchoice ofthedurationofthegrowthphaseinoursimulationsisunclear.Overall,itisuncleartowhatextentdifferentchoicesfor thecellcyclemodelmayinfluencesummarystatisticsofcellpacking.
Ouranalysisofforcesthroughoutsimulations,presented inFig. 3,revealsthat,onaverage,the areaforce contribution isstrongerthantheedgeforcecontributionandtheperimeterforcecontributiononagivenvertex.Further,forcesoncells increase during phasesof proliferationand growth.Our findings maybe of relevance in force-inferenceapproachesthat estimateforcesusingsegmentedmicroscopyimagesofepithelialtissues[58–60].Force-inferencemethodsoftenassumethat themeasuredconfigurationofcells isinequilibriumanditisuncleartowhatextentforce-inferenceapproachesintroduce errorsifthisisnotthecase.Inoursimulations,forcesareupto50%higherwhensimulationsareruninadynamicregime, where cells growanddivide,thanin thestaticregime attheendofthe simulation,wherecells arerelaxedinto astatic configuration.
The vertex positions, as well assimulation summary statistics, vary as the time step is changed, and differences in vertexpositionsdecreasewiththetimestep.Counterintuitively,largetime stepscansuppresscellrearrangementinvertex simulations.Thismaybeexplainedbyconsideringthat,forlargetime steps,vertexpositionsmovefurtherthanthelength threshold for cell rearrangements, and instances when the lengths of cell–cell interfaces fall below this threshold may not be resolved. Importantly, in orderfor differencesin simulation results to be negligibly small, a time step hasto be chosen thatis fiveorders ofmagnitudesmaller thanthe averagecell cycleduration inour simulation,andsixorders of magnitudesmallerthanthesimulationtime.Forindividualsimulations,simulationoutcomesmaychangeifasmallertime stepischosen,an effectthatispreservedevenwhenahigher-ordernumericalscheme,such asfourth-orderRunge–Kutta, is used.The latterfindingconfirms that, forvertexmodelimplementationswithad-hoc rulesforcell rearrangementand division, suchasinthisstudy,thebenefitsofhigher-ordernumericalschemes diminish,anditisbeneficial toreduce the computational costofthealgorithmby usinga simplernumericalscheme,suchasforwardEuler.AforwardEulerscheme ismorecomputationallyefficientthanafourth-orderRunge–Kuttaschemesinceitrequiresfewerfloatingpointoperations per time step.Inoursimulations,differencesinsimulationoutcomeswithdecreasingtime stepsoccurredatallobserved choicesofthetimestepforbothnumericalschemesinvestigated.Moreresearchisrequiredtoanalysetheextenttowhich further decreases in thetime step can lead toconvergence ofthe simulation results.Here, we stoppedinvestigating the effectsoffurtherdecreasingthetimestepduetoprohibitiveincreasesincalculationtimesasthetimestepisdecreased.In previous studies,vertexmodelshavebeenreportedtoconvergeasthetimestepisdecreased[45,56].Ouranalysisdiffers fromthesepreviousstudiesbyconsideringatissueundergoingcelldivisionandrearrangementratherthanrelaxationfrom aninitialcondition.
OurresultsthatboththetimestepandthecellrearrangementthresholdmayinfluencetherateofT1transitions illus-trates that theseparameters are interconnected.When thetime step ischosen sufficiently large such thatvertices move furtherthan thecellrearrangementthresholdbetweentime steps,cell rearrangementissuppressed.Thismeansthat ifa smallcell rearrangementthreshold ischosen, a sufficientlysmalltime step needs tobe chosen. Acareful choiceof time stepsandcellrearrangementthresholdiscrucialsinceanincorrectchoicemayleadtofailureofthesimulationalgorithm. Forvertexmodelsdesignedtosimulatepolycrystallinematerialsanadaptivetime-steppingschemehasbeendevelopedthat resolvestheexacttimeatwhichtheendpointsofashortedgemeet,andaT1transitionisperformedwheneverthis hap-pens[18].MoreworkisrequiredtounderstandhowratesofT1transitionsdifferifdifferentconditionsforrearrangement areimplemented,such astheshortening ofanedgetoagiventhresholdortheshrinkingedgeofanedgetoapoint. Ulti-mately,theoptimalalgorithmtosimulatecellrearrangementinepithelialtissuescanonlybe chosenthrough comparison withexperimentalresults.
Whilesimulatedvertexmodelconfigurationsaresensitivetothesizeofthetimestepandthresholdsforcell rearrange-ment, they are lesssensitive to the length ofnewly formed edges, andto thresholds forcell removal. We find that the lengthofnewly formededges maybeuptotwiceaslongasthethresholdforT1transitionswithoutaffectingfinal vertex configurations.However,thismaychangeinotherparameterregimes,forexampleiflargervaluesforthecellrearrangement thresholdarechosen.
Thesizeoftheareathresholdforcellremovalmaybevariedoversixordersofmagnitudewithoutimpactingtissue-level summary statistics,even though theexact numberofT2transitions maydifferforanytwo valuesofthe area threshold. Inparticular,itseemstobe possibletochoosearbitrarily smallvaluesfortheT2transitionthresholdwithoutcausingthe algorithm to fail.There are three effects that maycontribute to the stability ofsmall elements in oursimulations. First, sincesmallcellswithareasclosetothethresholdforcellremovalarefarawayfromtheirpreferredareainoursimulations (A0,α
>
1.
0),theirarea forceislargerthanthat ofadjacentneighbours.Thismakesthecellsstiff andpreventsthemfrom becominginvertedorotherwisemisshapen.Second,therelationshipbetweenareaandcellneighbournumberspresentedin Fig. 2showsthatsmallelementsaremostlikelytobe triangular.Oursimulationalgorithmdoesnotpermit T1transitions iftheshortedgeispartofatriangularcellinordertoprevent triangularelementsfrombecominginvertedandthusthe algorithm fromfailure. Third, this relationship betweencell area and cell neighbournumber mayalso contribute to the stability ofthe algorithmwhen thearea threshold islarge,for example0.2. Inthiscase, individual cells maybe smaller thantheareathresholdwithoutundergoingT2transitionsiftheyarenottriangular.The energyequation (2)provides a geometrical hypothesis forthe removal ofcells from epithelia,in which cells are removed fromthetissue ifthisisenergeticallyfavourable. Mechanicaleffectsofcell death arean area ofincreasing bio-physicalinterest[61],anditisthesubjectoffutureworktodesignvertexmodelsthatallowalternativehypothesesforcell deathtobetested.
Here,weanalysedhownumericalandnon-physicalparameterscaninfluenceexperimentallymeasurablesummary statis-ticsincell-basedmodelsbyexaminingaforce-propagation-basedimplementationofvertexmodels.Individual resultsmay berelevanttootherimplementationchoices.Forexample,ourfindingthatthedurationofthecellcycleinourmodel influ-encessimulationoutcomesmaymeanthatparameters thatcontrol therateofenergy-minimisation mayinfluenceresults inother vertexmodelimplementations [3,25,62].In general,furtherwork isrequiredtounderstandhowother choicesof implementationschemes mayimpactcomputationalmodelpredictions. Forexample,thenoisestrength inaMonteCarlo vertexpropagationscheme[39,40]orthechoiceofenergy-minimisationalgorithmmayinfluencevertexmodelbehaviour.
Whilemostofour findings areofa numericalnature,some haveexplicitbiological relevance.Ouranalysisof the de-pendenceoftissuepropertiesandforcesonthemeancell cycleduration revealsthat thevertexmodelpredicts increased forcesintissues undergoinggrowthandproliferation,andthat fasttissuegrowthmayinducecell extrusion.Ourfindings furthersuggestthatstatisticsofcellpackingmaydependonthenatureofthecellcycleortheboundaryconditionofthe tissue. Notethat findings thatdo not makeexplicit biologicalpredictions, suchasthe robustness ofthe vertexmodelto changesintheareathresholdforcellremoval,oritssensitivitytochangesinthelengththresholdforcellrearrangement, arenonethelesshighlyrelevant,sincethesefindingshighlightthatchoicesofmodeldesignandimplementationhavetobe carefullyconsideredwhenapplyingvertexmodelsquantitatively.
Throughoutthemanuscriptweusenon-dimensionalparametersthatarisewhenrescalingtimeandspacebythe charac-teristiclengthandtimescalesofthemodel.Theuseofsuchrescaledparametersisbeneficialinthiscasesinceitallows,for example,thecomparisonofourmodelparameterstopreviouslyusedvalues[3,4,28].Further,weidentifyreference param-etervaluesforwhichoursimulationsarephysicallyreasonable.Byprovidingnon-dimensionalvaluesfortheseparameters wefacilitatetheir reuseinother applicationswherethephysicalvaluesofthecharacteristiclength ortime scalesmaybe different.
5. Conclusions
choicesmayhaveonmodelpredictionswhenanalysingaspecificbiophysicalphenomenon.Understandingmodelbehaviour in detailis crucialto prevent modellingartefactsfrominfluencing experimental predictionsandcloudingour biophysical understandingand,assuch,ourfindingsemphasisetheneedtofullydocumentalgorithmsforsimulatingcell-basedmodels. Closeattentiontoimplementationdetailsisrequiredinordertounravelthefullpredictivepowerofcell-basedmodels.
Acknowledgements
J.K. acknowledges the University of Oxford and the Engineering and Physical Sciences Research Council for funding through a studentship (grantnumber EP/K503113/1). The authors would like to acknowledge the use of the University ofOxfordAdvancedResearchComputing(ARC)facilityincarryingoutthiswork.
Appendix A. Supplementary material
Supplementarymaterialrelatedtothisarticlecanbefoundonlineathttp://dx.doi.org/10.1016/j.jcp.2017.05.048.
References
[1] H.Kitano,Systemsbiology:abriefoverview,Science295 (5560)(2002)1662–1664,http://dx.doi.org/10.1126/science.1069492. [2] J.Fisher,T.A.Henzinger,Executablecellbiology,Nat.Biotechnol.25 (11)(2007)1239–1249,http://dx.doi.org/10.1038/nbt1356.
[3] R.Farhadifar,J.-C.Röper,B.Aigouy,S.Eaton,F.Jülicher,Theinfluenceofcellmechanics,cell–cellinteractions,andproliferationonepithelialpacking, Curr.Biol.17 (24)(2007)2095–2104,http://dx.doi.org/10.1016/j.cub.2007.11.049.
[4] Y.Mao,A.L.Tournier,P.A.Bates,J.E.Gale,N.Tapon,B.J.Thompson,PlanarpolarizationoftheatypicalmyosinDachsorientscelldivisionsinDrosophila, GenesDev.25 (2)(2011)131–136,http://dx.doi.org/10.1101/gad.610511.
[5] G. Trichas, A.M. Smith, N. White, V. Wilkins, T. Watanabe, A. Moore, B. Joyce, J. Sugnaseelan, T.A. Rodriguez, D. Kay, et al., Multi-cellular rosettesinthemouse visceralendodermfacilitatetheordered migrationofanteriorvisceralendodermcells,PLoSBiol.10 (2)(2012)e1001256,
http://dx.doi.org/10.1371/journal.pbio.1001256.
[6] B.Monier,M.Gettings,G.Gay,T.Mangeat,S.Schott,A.Guarner,M.Suzanne,Apico-basalforcesexertedbyapoptoticcellsdriveepitheliumfolding, Nature518 (7538)(2015)245–248,http://dx.doi.org/10.1038/nature14152.
[7] K.Atwell,Z.Qin,D.Gavaghan,H.Kugler,E.J.Hubbard,J.M.Osborne,Mechano-logicalmodelofC.elegansgermlinesuggestsfeedbackonthecellcycle, Development142 (22)(2015)3902–3911,http://dx.doi.org/10.1242/dev.126359.
[8]D.C.Walker,G.Hill,S.M.Wood,R.H.Smallwood,J.Southgate,Agent-basedcomputationalmodelingofwoundedepithelialcellmonolayers,IEEETrans. Nanobiosci.3 (3)(2004)153–163.
[9] A.R.A.Anderson,A.M.Weaver,P.T.Cummings,V.Quaranta,Tumormorphologyandphenotypicevolutiondrivenbyselectivepressurefromthe mi-croenvironment,Cell127 (5)(2006)905–915,http://dx.doi.org/10.1016/j.cell.2006.09.042.
[10]E.Weinan,B.Engquist,Multiscalemodelingandcomputation,Not.Am.Math.Soc.50 (9)(2003)1062–1070.
[11] R.E.Miller,E.B.Tadmor,Aunifiedframeworkandperformancebenchmarkoffourteenmultiscaleatomistic/continuumcouplingmethods,Model.Simul. Mater.Sci.Eng.17 (5)(2009)053001,http://dx.doi.org/10.1088/0965-0393/17/5/053001.
[12] P.Pantazis,W.Supatto,Advancesinwhole-embryoimaging:aquantitativetransitionisunderway,Nat.Rev.Mol.CellBiol.15 (5)(2014)327–339,
http://dx.doi.org/10.1038/nrm3786.
[13] J.C.Yu,R.Fernandez-Gonzalez,Quantitativemodellingofepithelialmorphogenesis:integratingcellmechanicsandmoleculardynamics,Semin.Cell Dev.Biol.(2016),http://dx.doi.org/10.1016/j.semcdb.2016.07.030.
[14] M.Pargett,D.M.Umulis,Quantitativemodelanalysiswithdiversebiologicaldata:applicationsindevelopmentalpatternformation,Methods62 (1) (2013)56–67,http://dx.doi.org/10.1016/j.ymeth.2013.03.024.
[15] A.G.Fletcher,M.Osterfield,R.E.Baker,S.Y.Shvartsman,Vertexmodelsofepithelialmorphogenesis,Biophys.J.106 (11)(2014)2291–2304,http://dx. doi.org/10.1016/j.bpj.2013.11.4498.
[16] T.Okuzono,K.Kawasaki,Intermittentflowbehaviorofrandomfoams:acomputerexperimentonfoamrheology,Phys.Rev.E51 (2)(1995)1246–1253,
http://dx.doi.org/10.1103/PhysRevE.51.1246.
[17] K.Kawasaki,T.Nagai,K.Nakashima,Vertexmodelsfortwo-dimensionalgraingrowth,Philos.Mag.B60 (3)(1989)399–421,http://dx.doi.org/10.1080/ 13642818908205916.
[18] C.E.Torres,M.Emelianenko,D.Golovaty,D.Kinderlehrer,S.Ta’asan,Numericalanalysisofthevertexmodelsforsimulatinggrainboundarynetworks, SIAMJ.Appl.Math.75 (2)(2015)762–786,http://dx.doi.org/10.1137/140999232.
[19] H.Honda,DescriptionofcellularpatternsbyDirichletdomains:thetwo-dimensionalcase,J.Theor.Biol.72 (3)(1978)523–543,http://dx.doi.org/10. 1016/0022-5193(78)90315-6.
[20] T.Nagai,K.Kawasaki,K.Nakamura,Vertexdynamicsoftwo-dimensionalcellularpatterns,J.Phys.Soc.Jpn.57 (7)(1988)2221–2224,http://dx.doi.org/ 10.1143/JPSJ.57.2221.
[21]M.Weliky,G.Oster,Themechanicalbasisofcellrearrangement.I.EpithelialmorphogenesisduringFundulusepiboly,Development109 (2)(1990) 373–386.
[22] T. Nagai,H.Honda,Adynamiccellmodelfor theformationofepithelialtissues,Philos.Mag.B81 (7)(2001)699–719,http://dx.doi.org/10.1080/ 13642810108205772.
[23]B.Alberts,A.Johnson,J.Lewis,M.Raff,K.Roberts,P.Walter,MolecularBiologyoftheCell,5thed.,GarlandScience,2008.
[24] Y.Mao,A.L.Tournier,A.Hoppe,L.Kester,B.J.Thompson,N.Tapon,Differentialproliferationratesgeneratepatternsofmechanicaltensionthatorient tissuegrowth,EMBOJ.32 (21)(2013)2790–2803,http://dx.doi.org/10.1038/emboj.2013.197.
[25] T.Aegerter-Wilmsen,A.Smith,A.Christen,C.Aegerter,E.Hafen,K.Basler,Exploringtheeffectsofmechanicalfeedbackonepithelialtopology, Devel-opment137 (3)(2010)499–506,http://dx.doi.org/10.1242/dev.041731.
[26] A.B.Patel,W.T.Gibson,M.C.Gibson,R.Nagpal,Modelingandinferringcleavagepatternsinproliferatingepithelia,PLoSComput.Biol.5 (6)(2009) e1000412,http://dx.doi.org/10.1371/journal.pcbi.1000412.
[27] K.P.Landsberg,R.Farhadifar,J.Ranft,D.Umetsu,T.J.Widmann,T.Bittig,A.Said,F.Jülicher,C.Dahmann,Increasedcellbondtensiongovernscell sortingattheDrosophilaanteroposteriorcompartmentboundary,Curr.Biol.19 (22)(2009)1950–1955,http://dx.doi.org/10.1016/j.cub.2009.10.021. [28] O.Canela-Xandri,F.Sagués,J.Casademunt,J.Buceta,Dynamicsandmechanicalstabilityofthedevelopingdorsoventralorganizerofthewingimaginal
[29] G.Salbreux,L.K.Barthel,P.A.Raymond,D.K.Lubensky,Couplingmechanicaldeformationsandplanarcellpolaritytocreateregularpatternsinthe zebrafishretina,PLoSComput.Biol.8 (8)(2012)e1002618,http://dx.doi.org/10.1371/journal.pcbi.1002618.
[30] K.Sugimura,S.Ishihara,Themechanicalanisotropyinatissuepromotesorderinginhexagonalcellpacking,Development140 (19)(2013)4091–4101,
http://dx.doi.org/10.1242/dev.094060.
[31] J.Kursawe,P.A.Brodskiy,J.J.Zartman,R.E.Baker,A.G.Fletcher,Capabilitiesandlimitationsoftissuesizecontrolthroughpassivemechanicalforces, PLoSComput.Biol.11 (12)(2015)e1004679,http://dx.doi.org/10.1371/journal.pcbi.1004679.
[32] O.Wartlick,P.Mumcu,F.Jülicher,M.González-Gaitán,Understandingmorphogeneticgrowthcontrol–lessonsfromflies,Nat.Rev.Mol.CellBiol.12 (9) (2011)594–604,http://dx.doi.org/10.1038/nrm3169.
[33] D.Bi,J.H.Lopez,J.Schwarz,M.L.Manning,Energybarriersandcellmigrationindenselypackedtissues,SoftMatter10(2014)1885–1890,http://dx.doi. org/10.1039/C3SM52893F.
[34] E.Marinari,A.Mehonic,S.Curran,J.Gale,T.Duke,B.Baum,Live-celldelaminationcounterbalancesepithelialgrowthtolimittissueovercrowding, Nature484 (7395)(2012)542–545,http://dx.doi.org/10.1038/nature10984.
[35] T.Nagai,H.Honda,Computersimulationofwoundclosureinepithelialtissues:cell-basal-laminaadhesion,Phys.Rev.E80(2009)061903,http://dx.doi. org/10.1103/PhysRevE.80.061903.
[36] M.Rauzi,P.Verant,T.Lecuit,P.-F.Lenne,NatureandanisotropyofcorticalforcesorientingDrosophilatissuemorphogenesis,Nat.CellBiol.10 (12) (2008)1401–1410,http://dx.doi.org/10.1038/ncb1798.
[37] C.Collinet,M.Rauzi,P.-F.Lenne,T.Lecuit,Localandtissue-scaleforcesdriveorientedjunctiongrowthduringtissueextension,Nat.CellBiol.17 (10) (2015)1247–1258,http://dx.doi.org/10.1038/ncb3226.
[38] R.J.Tetley,G.B.Blanchard,A.G.Fletcher,R.J.Adams,B.Sanson,Unipolardistributionsofjunctionalmyosiniiidentifycellstripeboundariesthatdrive cellintercalationthroughoutDrosophilaaxisextension,eLife5(2016)1–35,http://dx.doi.org/10.7554/eLife.12094.
[39] R.Etournay,M.Popovi ´c,M.Merkel,A.Nandi,C.Blasse,B.Aigouy,H.Brandl,G.Myers,G.Salbreux,F.Jülicher,etal.,Interplayofcelldynamicsand epithelialtensionduringmorphogenesisoftheDrosophilapupalwing,eLife4(2015)e07090,http://dx.doi.org/10.7554/eLife.07090.
[40] R.P.Ray,A.Matamoro-Vidal,P.S.Ribeiro,N.Tapon,D.Houle,I.Salazar-Ciudad,B.J.Thompson,Patternedanchoragetotheapicalextracellularmatrix definestissueshapeinthedevelopingappendagesofDrosophila,Dev.Cell34 (3)(2015)310–322,http://dx.doi.org/10.1016/j.devcel.2015.06.019. [41] D.Staple,R.Farhadifar,J.-C.Röper,B.Aigouy,S.Eaton,F.Jülicher,Mechanicsandremodellingofcellpackingsinepithelia,Eur.Phys.J.E33(2010)
117–127,http://dx.doi.org/10.1140/epje/i2010-10677-0.
[42] A. Merzouki,O. Malaspinas,B. Chopard,The mechanical propertiesofa cell-basednumerical modelofepithelium, Soft Matter 12 (21)(2016) 4745–4754,http://dx.doi.org/10.1039/C6SM00106H.
[43] G.-K.Xu,Y.Liu,B.Li,Howdochangesatthecelllevelaffectthemechanicalpropertiesofepithelialmonolayers?,SoftMatter11 (45)(2015)8782–8788,
http://dx.doi.org/10.1039/C5SM01966D.
[44] Y.Davit,J.Osborne,H.Byrne,D.Gavaghan,J.Pitt-Francis,ValidityoftheCauchy-bornruleappliedtodiscretecellular-scalemodelsofbiologicaltissues, Phys.Rev.E87 (4)(2013)042724,http://dx.doi.org/10.1103/PhysRevE.87.042724.
[45] A.M.Smith,R.E.Baker,D.Kay,P.K.Maini,Incorporatingchemicalsignallingfactorsintocell-basedmodelsofgrowingepithelialtissues,J.Math.Biol. 65(2012)441–463,http://dx.doi.org/10.1007/s00285-011-0464-y.
[46] J.M.Osborne,A.G.Fletcher,J.M.Pitt-Francis,P.K.Maini,D.J.Gavaghan,Comparingindividual-basedapproachestomodellingtheself-organizationof multicellulartissues,PLoSComput.Biol.(2016),http://dx.doi.org/10.1101/074351.
[47] R.Magno,V.A.Grieneisen,A.F.M.Marée,Thebiophysicalnatureofcells:potentialcellbehavioursrevealedbyanalyticalandcomputationalstudiesof cellsurfacemechanics,BMCBiophys.8 (1)(2015)8,http://dx.doi.org/10.1186/s13628-015-0022-x.
[48] A.G.Fletcher,J.M.Osborne,P.K.Maini,D.J.Gavaghan,Implementingvertexdynamicsmodelsofcellpopulationsinbiologywithinaconsistent compu-tationalframework,Prog.Biophys.Mol.Biol.113 (2)(2013)299–326,http://dx.doi.org/10.1016/j.pbiomolbio.2013.09.003.
[49] G.R.Mirams,C.J.Arthurs,M.O.Bernabeu,R.Bordas,J.Cooper,A.Corrias,Y.Davit,S.-J.Dunn,A.G.Fletcher,D.G.Harvey,etal.,Chaste:anopensource C++libraryforcomputationalphysiologyandbiology,PLoSComput.Biol.9 (3)(2013)e1002970,http://dx.doi.org/10.1371/journal.pcbi.1002970. [50] J.A.Smith,L.Martin,Docellscycle?,Proc.Natl.Acad.Sci.USA70 (4)(1973)1263–1267,http://dx.doi.org/10.1073/pnas.70.4.1263.
[51] R.Shields,Furtherevidenceforarandomtransitioninthecellcycle,Nature273(1978)755–758,http://dx.doi.org/10.1038/273755a0.
[52]W.Hofmeister,ZusätzeundBerichtigungenzuden1851veröffentlichenUntersuchungengenderEntwicklunghöhererKryptogamen,Jahrb.wiss.Bot. 3(1863)259–293.
[53] W.T.Gibson,J.H.Veldhuis,B.Rubinstein,H.N.Cartwright,N.Perrimon,G.W.Brodland,R.Nagpal,M.C.Gibson,Controlofthemitoticcleavageplaneby localepithelialtopology,Cell144 (3)(2011)427–438,http://dx.doi.org/10.1016/j.cell.2010.12.035.
[54] F.T.Lewis,Thecorrelationbetweencelldivisionandtheshapesandsizesofprismaticcellsintheepidermisofcucumis,Anat.Rec.38 (3)(1928) 341–376,http://dx.doi.org/10.1002/ar.1090380305.
[55] S.Kim,M.Cai,S.Hilgenfeldt,Lewis’lawrevisited:theroleofanisotropyinsize–topologycorrelations,NewJ.Phys.16 (1)(2014)015024,http://dx. doi.org/10.1088/1367-2630/16/1/015024.
[56]A.M.Smith,VertexModelApproachestoEpithelialTissuesinDevelopmentalSystems,Ph.D.thesis,UniversityofOxford,2011.
[57] M.Milán,S.Campuzano,A.García-Bellido,CellcyclingandpatternedcellproliferationinthewingprimordiumofDrosophila,Proc.Natl.Acad.Sci. USA93(1996)640–645,http://dx.doi.org/10.1073/pnas.93.2.640.
[58] S.Ishihara, K. Sugimura, Bayesian inference offorce dynamics duringmorphogenesis, J. Theor. Biol.313 (0) (2012) 201–211, http://dx.doi.org/ 10.1016/j.jtbi.2012.08.017.
[59] S.Ishihara,K.Sugimura,S.Cox,I.Bonnet,Y.Bellaïche,F.Graner,Comparativestudyofnon-invasiveforceandstressinferencemethodsintissue,Eur. Phys.J.E36 (4)(2013)1–13,http://dx.doi.org/10.1140/epje/i2013-13045-8.
[60] K.K. Chiou,L. Hufnagel, B.I. Shraiman, Mechanicalstress inference for two-dimensional cell arrays, PLoSComput. Biol. 8 (5) (2012) e1002512,
http://dx.doi.org/10.1371/journal.pcbi.1002512.
[61] A.Ambrosini,M.Gracia,A.Proag,M.Rayer,B.Monier,M.Suzanne,Apoptoticforcesintissuemorphogenesis,Mech.Dev.(2016),http://dx.doi.org/10. 1016/j.mod.2016.10.001.