ISSN Online: 2327-509X ISSN Print: 2327-5081
DOI: 10.4236/jbm.2017.58002 Aug. 2, 2017 11 Journal of Biosciences and Medicines
Development of Functional Interlaminar
Pathways in the Mouse Superior Colliculus
Revealed by Optical Imaging with Axonal
Labeling
Nana Morita1, Tetsufumi Ito2, Ryohei P. Hasegawa1,3, Kazuyuki Murase1,4
1Graduate School of Engineering, University of Fukui, Fukui, Japan
2Anatomy II, School of Medicine, Kanazawa Medical University, Ishikawa, Japan
3Human Technology Research Institute, National Institute of Advanced Industrial Science and Technology (AIST), Ibaraki, Japan 4Organization for Life Science Advancement Programs, University of Fukui, Fukui, Japan
Abstract
The superior colliculus (SC) is a laminated midbrain structure responsible for visual orientation behaviors. In the mature SC, neurons in the stratum gri-seum superficiale (SGS) receive visual inputs that contribute to exciting pre-motor neurons in the stratum griseum intermediale (SGI) through a dorso-ventral pathway. SGI activation generates feedback signals to the SGS through a ventrodorsal pathway. However, the developmental changes in signal transmission within the SC around the time of eye opening are not yet well understood. We compared the functional connections between the SGS and SGI before and after eye opening by imaging the neuronal population res-ponses using a voltage-sensitive absorption dye in mouse SC slices. Electro-phoresis of a fluorescent dye from the stimulating electrodes was used to fill the cells in the stimulated site. We here show that the dorsoventral transmis-sion is present both before and after eye opening. This is in contrast to our previous finding that the ventrodorsal transmission develops after eye open-ing. Functions of intrinsic inhibitory systems mediated by gamma-aminobutyric acid were also investigated with the antagonist. The processes stained by elec-trophoresis from stimulating electrodes before eye opening were confined within the respective stimulated layers. Whereas, after eye opening, the processes were widely extended especially dorsoventrally and ventrodorsally invading the SGI and SGS, respectively. These corresponded well to the early component of voltage responses that is known to reflect the activation of pre-synaptic elements, presumably the axonal arborizations and varicosities. Thus, How to cite this paper: Morita, N., Ito, T.,
Hasegawa, R.P. and Murase, K. (2017) Deve- lopment of Functional Interlaminar Path- ways in the Mouse Superior Colliculus Re- vealed by Optical Imaging with Axonal La- beling. Journal of Biosciences and Medicines, 5, 11-35.
https://doi.org/10.4236/jbm.2017.58002
Received: July 14, 2017 Accepted: July 30, 2017 Published: August 2, 2017
Copyright © 2017 by authors and Scientific Research Publishing Inc. This work is licensed under the Creative Commons Attribution International License (CC BY 4.0).
http://creativecommons.org/licenses/by/4.0/
DOI: 10.4236/jbm.2017.58002 12 Journal of Biosciences and Medicines the optically-revealed functional connections between the SGS and SGI were correlated to the morphology.
Keywords
Axonal Projection, Optical Imaging, Superior Colliculus, Visual Orientation, Voltage-Sensitive Dye
1. Introduction
The mammalian superior colliculus (SC) is a topographically organized mid-brain structure that guides visual orientation behaviors by transmitting spatial information from the visual system to premotor neurons involved in head and eye movements. The SC consists of several layers, among which the stratum gri-seum superficiale (SGS) and stratum grigri-seum intermediale (SGI) are known to play crucial roles in visual orientation behaviors. Neurons in the SGS receive input from the visual cortex and retina [1] [2] [3]. These SGS neurons excite premotor neurons in the SGI, which in turn contribute to the initiation of orientation behaviors, such as head and saccadic eye movements [4]-[9]. Recent studies have revealed a feed forward (dorsoventral) pathway from the SGS to SGI that is involved in short latency eye movements, such as express saccades [10][11][12]. Other studies have also reported the presence of a feedback (ven-trodorsal) pathway from the SGI to SGS, with both excitatory [4][13] and inhi-bitory actions [14] on the SGS.
Evidence indicates substantial modifications in SC neuronal circuitry around the time of eye opening [15][16][17]. Recently, we demonstrated that the exci-tatory ventrodorsal pathway develops after eye opening [18]. Developmental changes in the dorsoventral pathway are also expected because visual orientation behavior is acquired after eye openings [19]. However, the relationship between eye opening and maturation of the dorsoventral pathway remains unclear. A more detailed description of the developmental differences between dorsoventral and ventrodorsal pathways will help reveal functional changes in the SC occur-ring at the time of eye opening.
DOI: 10.4236/jbm.2017.58002 13 Journal of Biosciences and Medicines interlaminar communication before and after eye opening have not been de-scribed. It has been shown that the functional roles of GABAergic transmission changes in early stages of development in various parts of the CNS [21]. It is thus of interest that changes in GABAergic transmission in the SC may take place around the time of eye opening.
In this study, we examined the developmental changes in the interlaminar communication. Neuronal excitation in SC slices was visualized using the voltage- sensitive absorption dye RH-482, which is commonly used for studying neuronal activity in slices [22][23][24][25][26]. Excitation evoked by electrical stimula-tion of the SGS or SGI was recorded from mouse SC slices before and after eye opening. We also examined whether inhibition shapes the strength, kinetics, and extent of interlaminar communication before and after eye opening by measur-ing dorsoventral and ventrodorsal propagation in the presence of a GABAA re-ceptor antagonist.
Previous studies have also used combined physiological and morphological techniques. Injection of biotin during whole-cell patch-clamp recording revealed the detailed morphology of the recorded single cells [27]. Injection of biotiny-lated dextran amine after optical imaging showed the projections that are thought to involve in the neuronal responses [11]. In this study, we introduced a fluores-cent dye tetramethylrhodamine cadaverine (TMR-c) into neurons during stimu-lation for optical imaging in order to stain neuronal elements that are responsi-ble for the optically recorded neuronal activities.
2. Materials and Methods
2.1. Slice PreparationAll experiments were conducted in accordance with the Guidelines for Animal Experiments of the University of Fukui and with EC Directive 86/609/EEC for animal experiments. The experimental procedures have been described else-where [18]. In short, experiments were performed in two different age groups of ICR mice, PND 7 to 9 (infant mice; n = 12) and PND 25 to 35 (young mice; n = 16). These age ranges were chosen because they are before and after eye opening, respectively.
Mice were anesthetized with diethyl ether and rapidly decapitated. The brains were removed and transferred to an ice-cold slice-preparation solution [18]. Coronal SC slices of 300-μm thickness were cut with a microslicer (DTK-1000, Dosaka EM, Kyoto, Japan). After sectioning, the slices were incubated with ar-tificial cerebrospinal fluid (ACSF) at 30˚C.
2.2. Optical Imaging with a Voltage-Sensitive Dye
ha-DOI: 10.4236/jbm.2017.58002 14 Journal of Biosciences and Medicines logen lamp. Heat absorption and band-pass (700 ± 30 nm) filters and a me-chanical shutter were inserted in the path between the light source and condens-er lens. The slices wcondens-ere pcondens-erfused with ACSF at room tempcondens-erature (25˚C ± 2˚C). We chose this temperature in accordance with a number of previous studies in our laboratory. However, there is a possibility that physiological temperature may improve the results found in this study.
In fifteen cases, two bipolar tungsten electrodes were used to deliver electrical stimuli, one positioned in the SGS under microscopic control and the other po-sitioned in the SGI. The tungsten electrode position in the SGI was determined according to vertical distance from the dorsal edge of the slice, 400 μm for PND 7 - 9 mice or 500 - 700 μm for PND 2 - 35 mice. This position corresponds to the SC intermediate gray layer according to mouse stereotaxic coordinates [28]. Furthermore, the cytoarchitecture of the slices was examined after optical imag-ing usimag-ing propidium iodide (PI; Thermo Fisher Scientific, Waltham, MA) stain-ing to confirm the location of stimulation electrodes (described in Histology).
Sixteen single pulses (0.3 mA, 0.2 ms) were delivered at a constant interval of 15 s to produce differential images (see below). This stimulus induced near-ly the maximal response in infant slices, and the same strength was used for young slices. The change in light absorption at 700 ± 32 nm within a 0.83 × 0.83-mm area was recorded through a ×10 objective (numerical aperture [NA] = 0.3) using an imaging system (Deltalon 1700; Fujifilm Co., Tokyo, Japan) with 128 × 128-pixel photo sensors (6.5 μm2/pixel) at a frame rate of 0.6 ms. We used 0.7 × 0.7-mm area of the image for analysis. Image acquisition started 10 ms before each stimulus, and 64 consecutive frames (38.4 ms) at 0.6 ms/frame were usually acquired by the image sensors (in some cases, 128 frames were acquired). A reference frame taken immediately before each series of 64 frames was subtracted from subsequent frames. We then averaged 16 se-ries of differential images. The initial frame was produced by averaging the first 15 frames of the differential images, and then the subsequent frames were produced by subtracting this average from each of the 64 frames of raw image data on a pixel-by-pixel basis to eliminate the effects of noise contained in the reference frame. Ratiometric images were then calculated by dividing the im-aging data by the reference frame.
We first recorded the optical response of slices that were perfused with nor-mal ACSF. We then perfused the same slices with 100 μM picrotoxin (PTX, Sigma-Aldrich Co., St. Louis, MO) dissolved in ACSF for 15 min, and recorded the response in the presence of PTX.
DOI: 10.4236/jbm.2017.58002 15 Journal of Biosciences and Medicines were induced. It is thus not appropriate to compare the magnitudes of optical responses between infant and young slices, although the change induced by agents such as PTX in the same region of the same slice can be evaluated.
2.3. Optical Imaging with Axonal Labeling
For thirteen cases, a glass electrode filled with 1% TMR-c (Setareh Biotech LLC, Eugene, OR) dissolved in ACSF was used for stimulation. Both the tungsten and glass electrodes had similar resistance (8 - 15 MΩ). The dye was injected by elec-trophoresis with the stimulation pulses. No staining was observed without sti-mulation pulses.
2.4. Analysis of Optical Response
Sequential spatial averages in a 52 × 52-μm area (8 × 8 pixels) were used to as-sess the time course of the optical response in the SGS and SGI. Optical res-ponses in the stimulated layer were measured in the center between tips of the bipolar electrode. The response in the other layer was measured at the point of largest response closest to the lamina boarder. If no clear response was ob-served in the distal layer, we measured optical signals in the layer closest to the lamina border. To determine whether there was any significant activity, we compared the maximal absorption before (baseline) and after (peak) the sti-mulus.
The fast component of the optical response was defined as the change in ab-sorbance over the first 5 frames (3 ms) from signal onset since the response in this brief epoch remained even after blocking synaptic transmission by removing extracellular Ca2+ ion from the saline (data not shown) similarly to other CNS regions [29] [30][31]. The slow component of optical response (dependent on synaptic transmission) was defined as the first 30 frames (18 ms) after the fast component since this signal disappeared within 18 ms in young mice. Peak la-tency was defined as the time interval between response onset and response peak.
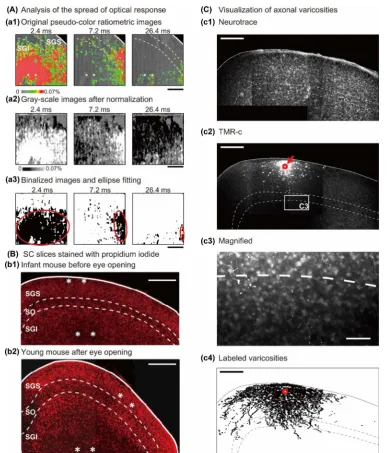
We performed a spatial analysis of neural transmission using optical imaging
(Figure 1(A)). The intensity of each optical image was amplified and shifted so
that the minimal and maximal intensity became 0 and 255, respectively (Figure
1(A)-(a1) and Figure 1(A)-(a2)). It is then binarized with the threshold of the
DOI: 10.4236/jbm.2017.58002 17 Journal of Biosciences and Medicines Data sets were examined with the Shapiro-Wilk test to determine whether the distribution was normal. Normally distributed datasets were compared by Stu-dent’s t-test if variances were equal or Welch’s t-test if variances were unequal. Non-normally distributed datasets were compared by the Mann-Whitney U-test or Wilcoxon signed-rank test. All statistical analyses were conducted using R software (version 3.0.1, http://cran.r-project.org/, The R Foundation for Statis-tical Computing, Vienna, Austria). P < 0.05 was considered significant for all tests. Data are presented as means ± standard error of the mean.
2.5. Histology
To identify the SC layer borders relative to the location of the electrode tips, slice cytoarchitecture was visualized with Nissl stain. For experiments using tungsten electrodes, PI staining was used in infant (Figure 1(B)-(b1)) and young (Figure
1(B)-(b2)) slices. Briefly, after the optical experiments, slices were fixed with 4%
paraformaldehyde in 0.01 M PBS at 4˚C overnight and then incubated in 2 μL/mL PI plus 0.3% Triton X (Sigma-Aldrich Co.) in 0.01 M PBS overnight at room temperature. The sections were mounted on glass slides and coverslipped with the fluorescent mounting medium Glycergel (Dako, Carpinteria, CA). Im-ages of the SC were captured using a confocal laser microscope (LSM 5 Pascal, Carl Zeiss, Oberkochen, Germany). PI was visualized using a 543-nm laser and 560-nm long-pass emission filter.
For experiments that used TMR-c-filled glass electrodes, Neurotrace was used for Nissl stain and TMR-c was for axonal staining (Figure 1(C)). After optical recording, the slices were incubated in ACSF for 6 h at room temperature [32]. Then, slices were fixed with 4% paraformaldehyde in 0.01 M PBS at 4˚C over-night and then incubated in 2 μL/mL Neurotrace 500/525 green florescent Nissl stain (Thermo Fisher Scientific) plus 0.3% Triton X in 0.01 M PBS overnight at room temperature. The sections were mounted on glass slides with ScaleS [33]. Z-stack images of the SC were captured at a pixel size of 0.15 × 0.15 μm and a z-step of 5 - 6 μm using a confocal laser scanning microscope (LSM 710 NLO, Carl Zeiss) equipped with a ×63 lens (NA = 1.4). The TMR-c and Neurotrace were excited with 561-nm and 488-nm lasers, and emitted fluorescence was fil-tered with 560-nm low-pass and 500-520-nm band-pass filters, respectively
(Figures 1(C)-((c1)-(c3))).
Acquired micrographs were analyzed with Image J. SC layers were determined according to cell size and density (Figure 1(B) and Figure 1(C)-(c1)). TMR-c- labeled varicosities were plotted (Figure 1(C)-(c4)), and the number of labeled varicosities were counted in each layer.
2.6. Verification of Stimulus Location
DOI: 10.4236/jbm.2017.58002 18 Journal of Biosciences and Medicines of labeled cells (Figure 1(B) and Figure 1(C)-(c1)). The SGS was distinguished by a high density of small cells, while the SGI, especially the dorsal part, was po-pulated by numerous medium-sized cells. The region between the SGS and SGI, in which the density of cells was lower than that in the SGS and SGI, was identi-fied as the stratum opticum (SO). In all imaging experiments, we confirmed that the tissue indentations made by the tips of bipolar electrodes or TMR-c deposit were confined to the SGS and/or SGI.
3. Results
3.1. Dorsoventral Propagation Evoked by SGS Stimulation
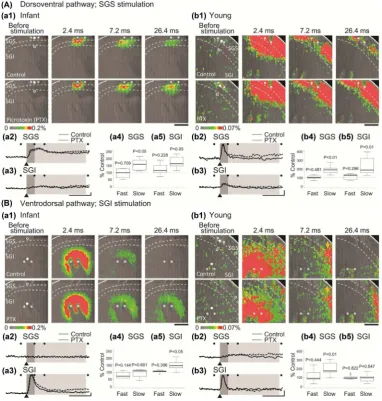
Stimulation of the SGS evoked optical response in both SGS and SGI regions in slices taken from infant and young mice (2.4, 7.2 and 26.4 ms of Control in
Fig-ure 2(A)-(a1) and Figure 2(A)-(b1), respectively). This indicates that the
dor-soventral transmission is present before eye opening. This is in good contrast to our previous finding that the ventrodorsal transmission from the SGI to SGS develops after eye opening [18] (see also Section 3.2).
In the presence of GABAA antagonist picrotoxin (PTX), the later part of opti-cal response was augmented in infant and young (26.4 ms of PTX in Figure
2(A)-(a1) and Figure 2(A)-(b1)). The time courses taken at points of the
maximal response consisted of the fast quick-raising component and slow long- lasting components in the SGS and SGI (0 ~ 3 ms and 3 ~ 26.4 ms after stimula-tion, respectively, Figure 2(A)-(a2) and Figure 2(A)-(a3) for infant and Figure
2(A)-(b2) and Figure 2(A)-(b3) in young). By PTX, the slow component was
augmented whereas the fast component was not altered. The changes were sig-nificant in young as shown in box plots (Figure 2(A)-(a4) and Figure 2(A)-(a5) for infant and Figure 2(A)-(b4) and Figure 2(A)-(b5) for young).
The optical response is the sum of presynaptic activity directly elicited by electrical stimulation and subsequent postsynaptic activity. The early fast com-ponent of optical response was predominantly due to presynaptic activity and the later slow component due to postsynaptic activity because blockade of syn-aptic transmission by removal of extracellular Ca2+ eliminated the optical sponse occurring >3 ms after stimulation (data not shown) as in other CNS re-gions [29] [30] [31]. Thus, we speculated that PTX would specifically alter the postsynaptic component since the GABAA receptor is mostly expressed postsy-naptically [34]. However, this does not exclude possible actions within the pre-synaptic elements. It should be noted that in this slice preparation, GABAergic inputs from other regions are not present and PTX primarily acts on the local GABAergic transmissions.
DOI: 10.4236/jbm.2017.58002 20 Journal of Biosciences and Medicines t-test, n = 9). The magnitude of optical responses is comparable to other CNS regions in our previous studies with the same voltage-sensitive dye [24][25][29] [30][35][36], and the resolution of the imaging system used (16 bit or higher, the minimum detectable level of 0.0015% of the exposed light intensity) was suf-ficient to record the neuronal excitation-induced changes [37]. The magnitude of optical response obtained in young mice was smaller than that in infant mice, because slices taken from young mice were less transparent than those from in-fant mice (see details in Experimental procedures).
The peak latency of optical response in infant (3.9 ± 0.8 ms in SGS and 7.2 ± 0.3 ms in SGI, n = 6) was slower than that in young (peak latencies: 2.2 ± 0.2 ms in SGS and 3.7 ± 0.8 ms in SGI, n = 9). This may be due to the immaturity of neuronal processes.
3.2. Ventrodorsal Propagation Evoked by SGI Stimulation
Stimulation of the SGI evoked optical response in both SGS and SGI regions in slices taken from young mice (2.4, 7.2 and 26.4 ms of Control in Figure
2(B)-(b1)), while the response is confined within SGI in slices from infant mice
(2.4, 7.2 and 26.4 ms of Control in Figure 2(B)-(a1)). This can be also seen in the time courses at points of the maximal response (Figure 2(B)-(a2) and
Fig-ure 2(B)-(a3) for infant and Figure 2(B)-(b2) and Figure 2(B)-(b3) in young).
Note that no response was observed in the SGS in infant (Figure 2(B)-(a2)). The peak magnitudes were in SGS: 0.0044% ± 0.0008%, P = 0.841 vs. baseline, paired t-test, n = 6 and SGI: 0.165% ± 0.013%, P < 0.01 in infant, and in SGS: 0.005% ± 0.005%, P < 0.01 (vs. baseline, paired t-test, n = 9) and SGI: 0.022% ± 0.002%, P < 0.01 in young. We have already reported this developmental change elsewhere [18]. We here repeated the experiment in order to examine together with the dorsoventral communication induced by the SGS stimulation in the same prep-arations with the same conditions.
In PTX, the slow component of optical response in SGI in infant (26.4 ms of PTX in Figure 2(B)-(a1)) and in SGS in young (26.4 ms of PTX in Figure
2(B)-(b1)) was augmented. It also appeared in the time courses (Figure
2(B)-(a2) and Figure 2(B)-(a3) for infant and Figure 2(B)-(b2) and Figure
2(B)-(b3) in young) and in the box plots (Figure 2(B)-(a4) and Figure
2(B)-(a5) for infant and Figure 2(B)-(b4) and Figure 2(B)-(b5) in young).
The peak latency in the SGI was short (1.6 ± 0.1 ms, n = 6 in infant and 1.1 ± 0.1 ms, n = 9 in young) as expected from direct stimulation, whereas that in the SGS was longer (4.0 ± 0.7 ms, n = 9 in young) due to the propagation to distant region.
3.3. Spatiotemporal Analysis
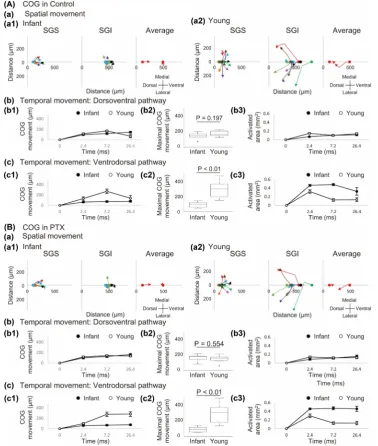
DOI: 10.4236/jbm.2017.58002 21 Journal of Biosciences and Medicines in both the absence (Figure 3(A)) and presence (Figure 3(B)) of PTX. Since the size of image was smaller than that of optical response in some cases, the area and the distance of COG movement could be underestimated. However, it is sufficient to evaluate the relative changes.
In infant mice, the COG of optical response induced by SGS stimulation moved toward SGI (Figure 3(A)-(a1)), and the movement took place during the initial period (0 - 7.2 ms, Figure 3(A)-(b1)). Whereas, that by SGI stimulation remained at the stimulated site (Figure 3(A)-(a1)). The change in the area oc-curred during the initial period (Figure 3(A)-(b3)). The significant difference of young mice to infant mice was the large movement of COG toward SGS for SGI stimulation (Figure 3(A)-(a2) and Figure 3(A)-(c2)). Surprisingly, these prop-erties were not significantly modified by PTX (Figure 3(B)).
3.3.1. Infant Mice
To be specific, in infant mice, most SGS electrodes stimulated a site at a distance of about 100 μm from the dorsal surface and the COG of neural excitation moved about 100 μm toward the SGI (Figure 3(A)-(a1), SGS). On the other hand, the SGI electrode stimulated a site 450 - 550 μm ventral to the dorsal sur-face. Unlike SGS stimulation, neural excitation evoked by SGI stimulation pro-duced little movement of the COG, which remained around the site of stimula-tion (Figure 3(A)-(a1), SGI).
The vector average of the directions of movement indicated that the neural excitation propagated from the SGS to the SGI in infant mice (Figure 3(A)-(a1), Average). The data shown in Figure 3(A)-(b1) and Figure 3(A)-(c1) also indi-cate that the mean distance of COG movement of neural excitation from the electrode site after SGS stimulation was similar to that after SGI stimulation at all time points in infant mice. No significant difference was observed between the maximum distance of movement of the COG after SGS stimulation and that after SGI stimulation (145.6 ± 17.2 μm vs. 90.0 ± 15.1 μm, P = 0.137, paired t-test, n = 6).
We also analyzed the change in activated area over time and found that after SGS stimulation (Figure 3(A)-(b3), closed circle), the activated area increased over time, reaching a maximum at 26.4 ms after stimulation. In contrast, after SGI stimulation (Figure 3(A)-(c3), closed circle), a large propagation area was observed 2.4 ms after stimulation, with the maximum activation area observed 7.2 ms after stimulation. The average maximum activation area was significantly greater with SGI stimulation than with SGS stimulation (0.493 ± 0.030 μm2 vs. 0.120 ± 0.014 μm2, P < 0.01, paired t-test, n = 6). These results demonstrated different patterns of neuronal ascending and descending connections between the layers.
3.3.2. Young Mice
DOI: 10.4236/jbm.2017.58002 22 Journal of Biosciences and Medicines Figure 3. Spatio-temporal analysis of optical response in the absence (A) and presence (B) of PTX. (a): The spatial movement of the ellipse’s center of gravity (COG) in infant (a1) and young (a2) mice. The movements of neuronal responses determined by
DOI: 10.4236/jbm.2017.58002 23 Journal of Biosciences and Medicines SGI and then mediolateral movement within SGS (Figure 3(A)-(a2)). The me-diolateral movement was greater than that observed in infant mice (Figure
3(A)-(a1)). After SGI stimulation, although the direction of mediolateral
prop-agation was not uniform, there was substantial movement into the SGS, as much as 400 μm.
In terms of the averaged direction of movement, as shown in Figure
3(A)-(a2), SGS stimulation resulted in movement of the COG toward the SGI
and then toward the SGS, while SGI stimulated resulted in movement toward the SGS. The changes in the mean distance of movement of the COG from the elec-trode site in young mice are shown in Figure 3(A)-(b1) and Figure 3(A)-(c1) as open circles.
The average maximum distance of movement of the COG was significantly higher with SGI stimulation than with SGS stimulation (281.3 ± 38.6 μm vs. 172.7 ± 11.6 μm, P < 0.05, paired t-test, n = 9). When the maximum distance of movement was compared between infant and young mice, no significant devel-opment-related difference was observed with SGS stimulation (145.6 ± 17.2 μm vs. 172.7 ± 11.6 μm, P = 0.197, Student’s t-test, n = 6 and 9, respectively, Figure
3(A)-(b2)), whereas SGI stimulation resulted in a significantly greater
move-ment in young mice than in infant mice (281.3 ± 38.6 μm vs. 90.0 ± 15.1 μm, P < 0.01, Student’s t-test, n = 9 and 6, respectively, Figure 3(A)-(c2)). This suggests the establishment of a ventrodorsal pathway after eye opening.
An analysis of activated area showed that the time need to achieve maximal activated area was 2.4 ms after stimulation, and the layer stimulated was irrele-vant to this finding. The average maximum activation area was significantly greater in SGI stimulation than in SGS stimulation (0.320 ± 0.040 μm2 vs. 0.154 ± 0.016 μm2, P < 0.01, paired t-test, n = 9, Figure 3(A)-(b3) and Figure
3(A)-(c3)). These results imply that presynaptic activity plays an important role
in the ventrodorsal pathway.
3.3.3. PTX
In PTX, no parameters were significantly different in infant and young mice as seen in Figure 3(B). In infant, no significant increase in the distance of COG movement from the electrode was observed before and after PTX administration (SGS: 163.2 ± 19.1 μm, P = 0.070 vs. control, paired t-test, n = 6; SGI: 86.8 ± 13.6 μm, P = 0.692 vs. control, paired t-test, n = 6; Figure 3(B)-(b1), Figure
3(B)-(b2), Figure 3(B)-(c1) and Figure 3(B)-(c2)). No significant change in
the area was observed before and after PTX administration after either stimula-tion (SGS: 0.156 ± 0.027 μm2, P = 0.120 vs. control, paired t-test, n = 6; SGI: 0.512 ± 0.021 μm2, P = 0.233 vs. control, paired t-test, n = 6).
DOI: 10.4236/jbm.2017.58002 24 Journal of Biosciences and Medicines SGI: 0.155 ± 0.022 μm2, P = 0.384 vs. control, paired t-test, n = 9).
3.4. Staining of Terminal Varicosities and Comparison with Optically Recorded Voltage Response
In the previous sections, we assumed that the fast and slow components reflect pre- and postsynaptic activity. However, an underlying anatomical basis to jus-tify these analyses is needed. To reveal anatomical mechanism underlying the generation of optically recorded voltage response, we used a glass pipette filled with TMR-c for both electrical stimulation and labeling of neuronal population. It is known that positive current pulses make small holes in the cell membrane and also cause depolarization of the same cell, for example, as seen in juxtacellu-lar staining [38]. Strongly labeled cell bodies were mainly found adjacent to electrode (Figure 1(C)-(c2)). Even after 6 h incubation period, we did not ob-serve retrogradely labeled cell bodies in distant location from electrode, suggest-ing labeled fibers were mainly originated adjacent to electrode. Because TMR-c can be electrophoresed with positive current, it is very likely that TMR-c is in-troduced into the electrically activated cells, allowing visualization of the neu-ronal population that contributes the presynaptic component of optical re-sponse.
By TMR-c injection without stimulation pulses to TMR-c-filled electrodes, no or minimal staining was observed (data not shown), indicating the stimulus- dependent nature of staining. We do not yet know exactly what kinds of neu-ronal processes uptake the dye, what fraction of active (or inactive) processes get labeled, or whether the uptake is voltage-dependent. However, as shown below, the results corresponded well with the voltage imaging.
3.5. Axonal Labeling by SGS Stimulation
In this experiment, we identified the projections of the dorsoventral pathway
(Figure 4(A)). First, we found that, after SGS stimulation in infant mice, signals
slowly propagated from the SGS toward the SGI, a pattern similar to that ob-served after stimulation with a tungsten electrode (Figures 4(A)-((a1)-(a3))). Tracer-labeled varicosities (red dots in Figure 4(A)-(a4)) were superimposed on an optical response taken 0.6 ms after stimulation (white area in Figure
4(A)-(a4)). Labeled varicosities were present in the SGS, and a few were found
in SO, but they were not observed in SGI. Laterally extending processes were al-so observed in SGS. These may reflect the presence of labeled horizontal cells.
DOI: 10.4236/jbm.2017.58002 25 Journal of Biosciences and Medicines Figure 4. Staining of terminal varicosities and comparison with optically recorded voltage response in dorsoventral (A) and ven-trodorsal (B) pathways. (A) SGS stimulation-induced neuronal excitation recorded by optical imaging and axonal tracing in infant (a) and young (b) mice. Optical imaging and axonal trace were obtained in the same slice. ((a1), (b1)): Pseudocolor images of propagation of neuronal excitation in response to SGS stimulation. White dashed lines indicate the layer borders obtained by Neurotrace staining. The acquisition times after a single stimulus pulse are shown above each image. Asterisks indicate the posi-tion of the glass electrode. Scale bar = 200 μm. ((a2), (a3) and (b2), (b3)): Time courses of the spatially averaged optical responses (8 × 8 pixels) in the SGI and SGS of infant ((a2), (a3)) and young ((b2), (b3)) mice at the positions indicated by closed and open white circles in (a1) and (b1) (before stimulation), respectively. The black arrowheads indicate the time of stimulation and the four dots the times at which the images displayed as pseudocolor maps in (a1) and (b1) were acquired. The time range of the fast com-ponent is indicated by the deep gray shading and that of the slow comcom-ponent by the lighter gray shading. The vertical axis of scale bars is 0.01% in infant ((a2), (a3)) and 0.007% in young ((b2), (b3)), and the horizontal axis is 10 ms. ((a4), (b4)): Stained varicosi-ties with red dots superimposed on monochrome images obtained by optical imaging. Optical images were taken 0.6 and 3.0 ms after stimulation for infant and young mice, respectively; (B) SGI stimulation-induced neuronal excitation recorded by optical imaging and axonal tracing in infant (a) and young (b) mice. The same as (A) except the difference in the stimulation site. In (a4) and (b4), optical images were taken 0.6 ms after stimulation for both infant and young mice. The vertical axis of scale bars is 0.01% in infant ((a2), (a3)) and 0.02% in young ((b2), (b3)), and the horizontal axis is 10 ms.
DOI: 10.4236/jbm.2017.58002 26 Journal of Biosciences and Medicines outside the SGS into SO and SGI, to produce a dorsoventral pathway. Further-more, the correlation between activity and labeled fibers suggest that the initial phase of optical responses (~3.0 ms) reflects presynaptic activity in these axons.
3.6. Axonal Labeling by SGI Stimulation
The projections of the ventrodorsal pathway were identified after eye opening
(Figure 4(B)). SGI stimulation also resulted in a propagation pattern similar to
that reported previously, where persistent responses were observed in the SGI, but they did not propagate to the SGS in infant mice (Figures 4(B)-((a1)-(a3))). Labeled varicosities were mainly distributed in the SGI, indicating the extent of axons within the layer (Figure (B)-(a4)). They were also observed to a lesser ex-tent in the SO, but not in the SGS.
When labeled varicosities were superimposed on an optical response taken 0.6 ms after stimulation, the excited region and the varicosity-dense region were almost completely matched, except for varicosities extending toward the side of the SGI (Figure 4(B)-(a4)). In young mice, the propagation of SGI responses toward the SGS was observed (Figures 4(B)-((b1)-(b3))). Labeled varicosities were distributed in SGI, SO, and SGS. They were actually more widespread in SO and SGS than in SGI (Figure 4(B)-(b4)). These observations suggest that the local collaterals of SGI neurons are limited to the area immediately around the parent cell, but that intralaminar projections are more widespread. The corres-pondence between terminal distribution and activity indicates that the initial phase (~3.0 ms) of the optical response reflects presynaptic activity.
3.7. Quantitative Analysis of Axonal Labeling
The distribution of labeled varicosities was quantified in each region. The aver-age number of labeled varicosities was significantly higher in young mice than in infant mice (3889 ± 917 vs. 749 ± 255, P < 0.05, n = 7 and 6, Student’s t-test), suggesting development of axonal arborization during the period. We then cal-culated the percentages of varicosities distributed in each layer (Figure 5). In in-fant mice, the average percentages of labeled varicosities arising from SGS neu-rons and distributed in the SGS, SO, and SGI were 92.3% ± 3.8%, 7.1% ± 3.4%, and 0.7% ± 0.4%, respectively (Figure 5(a1), closed bar), and those arising from SGI neurons and distributed in the SGI, SO, and SGS were 85.4% ± 5.1%, 9.0% ± 2.9%, and 5.7% ± 2.4%, respectively (Figure 5(a2), closed bar). These results suggest that the limited response seen in SGI after SGS stimulation mostly re-flected postsynaptic activity.
DOI: 10.4236/jbm.2017.58002 27 Journal of Biosciences and Medicines Figure 5. The percentage of labeled varicosities in each layer. The ratio of labeled varicos-ities in each layer are shown with the total number of labeled varicosvaricos-ities defined as 100. The percentage of varicosities distributed in each layer after SGS (a1) and SGI (a2) sti-mulations in infant mice (closed bar, respectively) and young mice (open bar, respective-ly) are shown.
optical responses in all layers, but in the dorsoventral pathway, the contribution of presynaptic activity is greater in the SGS than in the SO and SGI.
In the dorsoventral pathway, only 0 - 6 labeled varicosities arising from the SGS were found in the SGI of infant mice, whereas 96 - 367 varicosities were found in young mice, suggesting the establishment of direct projection during the period. However, no significant difference was observed between infant and young mice in the percentage of varicosities of SGS origin distributed in the SGI (0.7% ± 0.4% vs. 5.1% ± 1.9%, P = 0.132, both n = 3, Student’s t-test), suggesting that direct projection is a minor component of total projection even in young mice. The percentage of varicosities of SGI origin in the SGS was significantly higher in young mice than in infant mice (5.7% ± 2.4% vs. 45.4% ± 4.8%, P < 0.05, n = 3 and 4, Student’s t-test). These data clearly indicate that interlaminar projection develops during the period of eye opening.
4. Discussion
4.1. Properties of Evoked Optical Responses
DOI: 10.4236/jbm.2017.58002 28 Journal of Biosciences and Medicines invasion of SGI.
The response to stimulation consisted of two kinetically distinct components, an early fast peak within ~3 ms and a longer slow response lasting ~20 ms. Ad-ministration of the GABAA receptor antagonist PTX augmented the slow com-ponent to roughly the same extent in both the SGS and the SGI of infant and young mice, indicating that the slow response arises from synaptic transmission of excitatory activity.
We have chosen two age groups, P7-9 as infant before eye opening and P25-35 as young after eye opening. A portion of the changes seen between these time points may be due to the effects of experience-dependent mechanisms. Other changes may be solely due to time-dependent maturation and growth of collicu-lar neurons. The latter may include changes both before and after eye opening. Experiments in which eye opening is manipulated will be needed to sort these factors out. Nevertheless, the present results provide data on the relevant starting and end points of this process.
In contrast to dorsoventral propagation, ventrodorsal propagation from the SGI to SGS evoked by SGI stimulation was not observed until after eye opening. In infant mice, SGI stimulation only activated SGI. The effects of PTX were age- dependent. In young mice, the slow component in the SGS was augmented by PTX while the slow component in the SGI was not. Conversely, in infant mice, the slow component in the SGI was augmented by PTX. The ventrodorsal prop-agation increased to a greater extent than dorsoventral propprop-agation after eye opening. These propagation characteristics were not modified by PTX. Staining of terminal varicosities with the tracer revealed that interlaminar direct projec-tion was achieved in young but not in infant mice. The ratio of varicosities of the ventrodorsal projection was far larger than that of the dorsoventral projection in young mice.
Taken together with the results of the axonal labeling experiment, these find-ings indicate it is very likely that prolonged SGS activity after SGI stimulation in young mice is caused by the combination of the establishment of direct SGI–SGS projection and persistent SGS local circuit activity. On the other hand, develop-mental change in the persistence of SGI activity after SGS stimulation is mainly interpreted as a change in the persistence of SGI local circuit activity. In sum, these results indicate distinct postnatal developmental sequences for interlami-nar projections and intrinsic inhibitory circuitry in the SC. How visual inputs after eye opening guide these neuroplastic changes remains to be elucidated.
4.2. Dorsoventral Propagation Pathways
DOI: 10.4236/jbm.2017.58002 29 Journal of Biosciences and Medicines and organization of laminar structure are incomplete before eye opening [39]. In addition, full maturation of the excitatory dorsoventral pathway is likely estab-lished after eye opening [12][40][41][42][43][44]. Indeed, before eye opening, propagation of the fast excitatory component from the SGS to SGI was almost negligible, while the slow component in the same pathway was prominent. Fur-thermore, the peak latency of SGS-to-SGI propagation was slower in infant than young mice.
In accordance with the voltage imaging, TMR-c-labeled varicosities arising from the SGS were not observed in the SGI of infant mice, but a significant number was observed in young mice (Figure 4(A)-(a4) and Figure 4(A)-(b4)). It is reasonable to assume that excitation propagated slowly in infant mice be-cause the direct projection pathway from the SGS to SGI was poorly developed. However, although the peak latency was slow, it was insensitive to PTX. Given that the infant SGS contains many GABAergic neurons [45] and that SC myeli-nation occurs from PND 12 to 24 [39], the PTX-insensitive, slow SGS-to-SGI propagation in infant SC is likely not due to polysynaptic activity but rather due to the absence of myelination in the direct SGS-to-SGI pathway before eye opening. In any case, we can conclude that direct projection from SGS-to-SGI fully establishes after eye opening.
Morphological and functional development of SGS has also been shown to depend largely on retinal spontaneous activity [46] and that signals from the SGS are necessary for the development of deeper laminae [16]. This suggests that propagation of activity from the SGS to SGI before eye opening is important for development of SGI neural circuitry. Before eye opening, most retinal axons terminate over a large area of the SGS, but this terminal zone becomes much smaller after eye opening [46]. These changes in retinal-SGS circuitry are in contrast to the developmental changes in propagation patterns within the SGS; before eye opening, the area of activation was small and became larger after eye opening. These findings suggest that during SGS development, activity is initial-ly maintained by less-selective retinal inputs and later by lateral propagation of activity by local neurons excited by highly selective retinal inputs.
4.3. Ventrodorsal Propagation Pathways
DOI: 10.4236/jbm.2017.58002 30 Journal of Biosciences and Medicines orientation behaviors [18].
Analysis of the distribution of varicosities showed that they were distributed in only the SGI in infant mice, but were more abundantly distributed in the SGS than in the SGI in young mice (Figure 4(B)-(a4) and Figure 4(B)-(b4)). These findings suggest that visually guided orientation behaviors, which are driven by the SGI-to-SGS pathway, are established later than visual feedback, which is conveyed by the SGS-to-SGI pathway. The development of ventrodorsal propa-gation after eye opening may be responsible, in part, for saccadic suppression via the ventrodorsal pathway [14]. The different time course of activity between the two pathways after eye opening likely reflects their different time windows of function.
4.4. Roles of GABAergic Inhibition
PTX produced no significant changes in the fast components, peak latencies, and areas of the optical responses in infant and young mice, strongly suggesting that the fast component mainly reflects presynaptic activity. Alternatively, the effects of PTX on the slow components indicate propagation by local circuitry strongly influenced of GABAergic interneurons. In infant mice, PTX augmented propa-gation of the slow component evoked by local SGI stimulation, but did not faci-litate propagation to the SGS (Figure 2(B)-(a1)-(a3)), further demonstrating the absence of a functional ventrodorsal connection before eye opening. After eye opening, SGS stimulation evoked a larger slow component within the SGS and SGI in the presence of PTX (Figure 2(A)). This is consistent with a previous study by Isa, et al. (1998) [12] showing that SGS stimulation activates SGI neu-rons under GABAergic disinhibition by bicuculline. SGI stimulation in young mice evoked a significantly larger slow component in the SGS, consistent with previous studies [14][18].
In contrast, SGI stimulation in the presence of PTX after eye opening evoked no slow component in the SGI (Figure 2(B)-(b1)-(b3)), suggesting that local inhibitory activity within the SGI is weakened after eye opening. This is consis-tent with the change in the morphological arrangement of GABAergic neurons after eye opening described previously [47][48][49]. Collectively, these studies suggest that GABAergic inhibition in the dorsoventral pathway is of equal strength in the SGS and SGI, while only the SGS side of the ventrodorsal path-way is under strong GABAergic inhibition.
4.5. Asymmetric Nature in Development
bi-DOI: 10.4236/jbm.2017.58002 31 Journal of Biosciences and Medicines directional transmission between SGS and SGI under GABAergic disinhibition after eye opening is in accord with a previous study using optical imaging [20], except that long-lasting low-amplitude activity in the SGI was not observed, probably due to insufficient sensitivity or species difference. A single-cell re-cording study reported the existence of a feedforward inhibitory circuit from the SGI to SGS via GABAergic neurons in the SGI, suggesting that the circuit is in-volved in saccadic suppression [14] and further that the SGI-to-SGS ventrodor-sal pathway is critical for efficient visual information gathering.
Results of spatiotemporal analysis are consistent with the proposed functional roles of SGS and SGI. The dorsoventral pathway may contribute to transmission of visual inputs from the retina since movement of the COG became faster after eye opening. The ventrodorsal pathway, on the other hand, may contribute to the feedback process for saccadic suppression in the SC since ventrodorsal propagation becomes larger after eye opening. In contrast to movement of the COG, the mode of transmission was not markedly altered by PTX, suggesting that the local GABAergic inhibition controls the gain of SC neural circuitry, es-pecially in the SGS, but not the modes of interlaminar propagation.
In this study, we found that the development of neuronal circuits around the time of eye opening in the SC assuming that visual information has strong ef-fects on the development of the SC. However, during the period, a variety of sensory systems develop and the information is also fed to the SC. Therefore, we cannot conclude that the development found in this study is driven purely by visual inputs. In the future, it is necessary to perform experiments on animals whose eye is removed.
Acknowledgements
This study was initiated under the guidance of Professor Hiroshi Ikeda (HI), University of Fukui, who was passed away in August 2014. The authors are grateful to Dr. Y. Konishi (University of Fukui) for help with confocal laser mi-croscopy and to Dr. M. Ono (Kanazawa Medical University) for constructive criticism of the manuscript. This work was supported by the Grants-in-Aid from JSPS; Nos. 23659317 and 24390148 for KM, 25670284 and 25713025 for HI, and 25430034, 16H01501, and 16K07026 for TI.
References
[1] Cynader, M. and Berman, N. (1972) Receptive-Field Organization of Monkey Supe-rior Colliculus. Journal of Neurophysiology, 35, 187-201.
[2] May, P.J. (2006) The Mammalian Superior Colliculus: Laminar Structure and Con-nections. Progress in Brain Research, 151, 321-378.
https://doi.org/10.1016/S0079-6123(05)51011-2
[3] Schiller, P.H. and Stryker, M. (1972) Single-Unit Recording and Stimulation in Su-perior Colliculus of the Alert Rhesus Monkey. Journal of Neurophysiology, 35, 915- 924.
DOI: 10.4236/jbm.2017.58002 32 Journal of Biosciences and Medicines
between the Superficial and Deeper Layers of the Superior Colliculus: An Anatomi-cal Substrate for Sensorimotor Integration. Journal of Neurophysiology, 23, 6596- 6607.
[5] Hasegawa, R.P., Hasegawa, Y.T. and Segraves, M.A. (2009) Neural Mind Reading of Multi-Dimensional Decisions by Monkey Mid-Brain Activity. Neural Networks, 22, 1247-1256. https://doi.org/10.1016/j.neunet.2009.07.028
[6] Helms, M.C., Ozen, G. and Hall, W.C. (2004) Organization of the Intermediate Gray Layer of the Superior Colliculus. I. Intrinsic Vertical Connections. Journal of
Neurophysiology, 91, 1706-1715. https://doi.org/10.1152/jn.00705.2003
[7] Ratcliff, R., Hasegawa, Y.T., Hasegawa, R.P., Smith, P.L. and Segraves, M.A. (2007) Dual Diffusion Model for Single-Cell Recording Data from the Superior Colliculus in a Brightness-Discrimination Task. Journal of Neurophysiology, 97, 1756-1774.
https://doi.org/10.1152/jn.00393.2006
[8] Sparks, D.L. (1986) Translation of Sensory Signals into Commands for Control of Saccadic Eye Movements: Role of Primate Superior Colliculus. Physiological
Re-views, 66, 118-171.
[9] Tehovnik, E.J. (1989) Head and Body Movements Evoked Electrically from the Caudal Superior Colliculus of Rats: Pulse Frequency Effects. Behavioural Brain
Re-search, 34, 71-78. https://doi.org/10.1016/S0166-4328(89)80091-9
[10] Fischer, B. and Boch, R. (1983) Saccadic Eye Movements after Extremely Short Reaction Times in the Monkey. Brain Research, 260, 21-26.
https://doi.org/10.1016/0006-8993(83)90760-6
[11] Higashi, S., Crair, M.C., Kurotani, T., Inokawa, H. and Toyama, K. (1999) Altered Spatial Patterns of Functional Thalamocortical Connections in the Barrel Cortex af-ter Neonatal Infraorbital Nerve Cut Revealed by Optical Recording. Neuroscience, 91, 439-452. https://doi.org/10.1016/S0306-4522(98)00666-6
[12] Isa, T., Endo, T. and Saito, Y. (1998) The Visuo-Motor Pathway in the Local Circuit of the Rat Superior Colliculus. Journal of Neurophysiology, 18, 8496-8504. [13] Ghitani, N., Bayguinov, P.O., Vokoun, C.R., McMahon, S., Jackson, M.B. and Basso,
M.A. (2014) Excitatory Synaptic Feedback from the Motor Layer to the Sensory Layers of the Superior Colliculus. Journal of Neurophysiology, 34, 6822-6833.
https://doi.org/10.1523/JNEUROSCI.3137-13.2014
[14] Lee, P.H., Sooksawate, T., Yanagawa, Y., Isa, K., Isa, T. and Hall, W.C. (2007) Iden-tity of a Pathway for Saccadic Suppression. Proceedings of the National Academy of
Sciences of the United States of America, 104, 6824-6827.
https://doi.org/10.1073/pnas.0701934104
[15] Cork, R.J., Calhoun, T., Perrone, M. and Mize, R.R. (2000) Postnatal Development of Nitric Oxide Synthase Expression in the Mouse Superior Colliculus. The Journal
of Comparative Neurology, 427, 581-592.
https://doi.org/10.1002/1096-9861(20001127)427:4<581::AID-CNE6>3.0.CO;2-M
[16] King, A.J., Schnupp, J.W. and Thompson, I.D. (1998) Signals from the Superficial Layers of the Superior Colliculus Enable the Development of the Auditory Space Map in the Deeper Layers. The Journal of Neuroscience, 18, 9394-9408.
[17] Mohler, C.W. and Wurtz, R.H. (1976) Organization of Monkey Superior Colliculus: Intermediate Layer Cells Discharging before Eye Movements. Journal of
Neurophy-siology, 39, 722-744.
DOI: 10.4236/jbm.2017.58002 33 Journal of Biosciences and Medicines
Excitation from Intermediate to Superficial Layers. Neuroreport, 25, 242-247.
https://doi.org/10.1097/WNR.0000000000000081
[19] Rochefort, N.L., Narushima, M., Grienberger, C., Marandi, N., Hill, D.N. and Kon-nerth, A. (2011) Development of Direction Selectivity in Mouse Cortical Neurons.
Neuron, 71, 425-432. https://doi.org/10.1016/j.neuron.2011.06.013
[20] Vokoun, C.R., Jackson, M.B. and Basso, M.A. (2010) Intralaminar and Interlaminar Activity within the Rodent Superior Colliculus Visualized with Voltage Imaging.
The Journal of Neuroscience, 30, 10667-10682.
https://doi.org/10.1523/JNEUROSCI.1387-10.2010
[21] Ben-Ari, Y. (2002) Excitatory Actions of Gaba during Development: The Nature of the Nurture. Nature Reviews Neuroscience, 3, 728-739.
https://doi.org/10.1038/nrn920
[22] Choen, L.B. and Lesher, S. (1986) Optical Monitoring of Membrane Potential: Me-thods of Multisite Optical Measurement. In: De Weer, P. and Saltzberg, B.M., Eds.,
Optical Methods in Cell Physiology, Wiley, New York, 71-99.
[23] Grinvald, A., Frosting, R.D., Lieke, E. and Hildesheim, R. (1988) Optical Imaging of Neuronal Activity. Physiological Reviews, 68, 1285-1366.
[24] Ikeda, H., Ryu, P.D., Park, J.B., Tanifuji, M., Asai, T. and Murase, K. (1998) Optical Responses Evoked by Single-Pulse Stimulation to the Dorsal Root in the Rat Spinal Dorsal Horn in Slice. Brain Research, 812, 81-90.
https://doi.org/10.1016/S0006-8993(98)00928-7
[25] Kiritoshi, T., Ikeda, H. and Murase, K. (2010) Long-Term Potentiation of Neuronal Excitation in the Central Nucleus of the Rat Amygdala Revealed by Imaging with a Voltage-Sensitive Dye. Brain Research, 1349, 32-40.
https://doi.org/10.1016/j.brainres.2010.06.039
[26] Salzberg, B.M. (1983) Optical Recording of Electrical Activity in Neurons Using Molecular Probes. In: Barker, J. and Mckelvey, J., Eds., Current Methods in Cellular
Neurobiology, Wiley, New York, 139-187.
[27] Pettit, D.L., Helms, M.C., Lee, P., Augustine, G.J. and Hall, W.C. (1999) Local Exci-tatory Circuits in the Intermediate Gray Layer of the Superior Colliculus. The
Jour-nal of Neuroscience, 81, 1424-1427.
[28] Paxinos, G. and Franklin, K.B.J. (2001) The Mouse Brain in Stereotaxic Coordi-nates. 2nd Edition, Academic Press, San Diego.
[29] Ikeda, H. and Murase, K. (2004) Glial Nitric Oxide-Mediated Long-Term Presynap-tic Facilitation Revealed by OpPresynap-tical Imaging in Rat Spinal Dorsal Horn. The Journal
of Neuroscience, 24, 9888-9896. https://doi.org/10.1523/JNEUROSCI.2608-04.2004
[30] Kita, H., Yamada, H., Tanifuji, M. and Murase, K. (1995) Optical Responses Rec-orded after Local Stimulation in Rat Neostriatal Slice Preparations: Effets of GABA Antagonists, Glutamate Antagonists, and Dopamine Agonists. Experimental Brain
Research, 106, 187-195. https://doi.org/10.1007/BF00241114
[31] Kusudo, K., Asai, T., Ikeda, H., Takenoshita, M. and Murase, K. (2003) Inhibitory Effect of Caffeine on C-Fibre-Evoked Excitation in the Rat Spinal Dorsal Horn Rec-orded under Ca2+-Free Condition: An Interaction with Halothane. Neuroscience
Letters, 336, 17-20. https://doi.org/10.1016/S0304-3940(02)01198-9
[32] Chang, S.L., LoTurco, J.J. and Nisenbaum, L.K. (2000) InVitro Biocytin Injection into Perinatal Mouse Brain: A Method for Tract Tracing in Developing Tissue.
Journal of Neuroscience Methods, 97, 1-6.
DOI: 10.4236/jbm.2017.58002 34 Journal of Biosciences and Medicines
[33] Hama, H., Hioki, H., Namiki, K., Hoshida, T., Kurokawa, H., Ishidate, F., Kaneko, T., Akagi, T., Saito, T., Saido, T. and Miyawaki, A. (2015) ScaleS: An Optical Clear-ing Palette for Biological ImagClear-ing. Nature Neuroscience, 18, 1518-1529.
https://doi.org/10.1038/nn.4107
[34] Mize, R.R. and Butler, G.D. (1997) The Distribution of the GABA (A) Beta2, Beta3 Subunit Receptor in the Cat Superior Colliculus Using Antibody Immunocytoche-mistry. Neuroscience, 79, 1121-1135.
https://doi.org/10.1016/S0306-4522(96)00667-7
[35] Sugitani, M., Sugai, T., Tanifuji, M., Murase, K. and Onoda, N. (1994) Optical Im-aging of the in vitro Guinea Pig Piriform Cortex Activity Using a Voltage-Sensitive Dye. Neuroscience Letters, 165, 215-218.
https://doi.org/10.1016/0304-3940(94)90748-X
[36] Tanifuji, M., Sugiyama, T. and Murase, K. (1994) Horizontal Propagation of Excita-tion in Rat Visual Cortical Slices Revealed by Optical Imaging. Science, 266, 1057- 1059. https://doi.org/10.1126/science.7973662
[37] Ichikawa, M., Iijima, T. and Matsumoto, G. (1993) Real-Time Optical Recording of Neuronal Activity in the Brain. In: Ono, T., Squire, L.R., Raichle, M.E., Perrett, D.I. and Fukuda, M., Eds., Brain Mechanisms of Perception and Memory, Oxford U.P., New York, 638-648.
[38] Pinault, D. (1996) A Novel Single-Cell Staining Procedure Performed in vivo under Electrophysiological Control: Morpho-Functional Features of Juxtacellularly La-beled Thalamic Cells and Other Central Neurons with Biocytin or Neurobiotin.
Journal of Neuroscience Methods, 65, 113-136.
https://doi.org/10.1016/0165-0270(95)00144-1
[39] Warton, S.S. and Jones, D.G. (1985) Postnatal Development of the Superficial Lay-ers in the Rat Superior Colliculus: A Study with Golgi-Cox and Kluver-Barrera Techniques. Experimental Brain Research, 58, 490-502.
https://doi.org/10.1007/BF00235865
[40] Behan, M. and Appell, P.P. (1992) Intrinsic Circuitry in the Cat Superior Colliculus: Projections from the Superficial Layers. The Journal of Comparative Neurology, 315, 230-243. https://doi.org/10.1002/cne.903150209
[41] Lee, P. and Hall, W.C. (1995) Interlaminar Connections of the Superior Colliculus in the Tree Shrew. II: Projections from the Superficial Gray to the Optic Layer.
Vis-ual Neuroscience, 12, 573-588. https://doi.org/10.1017/S0952523800008464
[42] Lee, P.H., Helms, M.C., Augustine, G.J. and Hall, W.C. (1997) Role of Intrinsic Synaptic Circuitry in Collicular Sensorimotor Integration. Proceedings of the
Na-tional Academy of Sciences of the United States of America, 94, 13299-13304.
https://doi.org/10.1073/pnas.94.24.13299
[43] Lee, P.H., Schmidt, M. and Hall, W.C. (2001) Excitatory and Inhibitory Circuitry in the Superficial Gray Layer of the Superior Colliculus. The Journal of Neuroscience, 21, 8145-8153.
[44] Mooney, R.D., Nikoletseas, M.M., Hess, P.R., Allen, Z., Lewin, A.C. and Rhoades, R.W. (1988) The Projection from the Superficial to the Deep Layers of the Superior Colliculus: An Intracellular Horseradish Peroxidase Injection Study in the Hamster.
The Journal of Neuroscience, 8, 1384-1399.
[45] Endo, T., Yanagawa, Y., Obata, K. and Isa, T. (2003) Characteristics of GABAergic Neurons in the Superficial Superior Colliculus in Mice. Neuroscience Letters, 346, 81-84. https://doi.org/10.1016/S0304-3940(03)00570-6
DOI: 10.4236/jbm.2017.58002 35 Journal of Biosciences and Medicines
Promotes Morphological and Functional Synaptic Development of Neurons in the Superior Colliculus. Journal of Neurophysiology, 110, 1441-1454.
https://doi.org/10.1152/jn.01066.2012
[47] Mize, R.R. (1992) The Organization of GABAergic Neurons in the Mammalian Su-perior Colliculus. Progress in Brain Research, 90, 219-248.
https://doi.org/10.1016/S0079-6123(08)63616-X
[48] Okada, Y. (1992) The Distribution and Function of Gamma-Aminobutyric Acid (GABA) in the Superior Colliculus. Progress in Brain Research, 90, 249-262.
https://doi.org/10.1016/S0079-6123(08)63617-1
[49] Tsunekawa, N., Yanagawa, Y. and Obata, K. (2005) Development of GABAergic Neurons from the Ventricular Zone in the Superior Colliculus of the Mouse.
Jour-nal of Neuroscience Research, 51, 243-251.
https://doi.org/10.1016/j.neures.2004.11.011
Submit or recommend next manuscript to SCIRP and we will provide best service for you:
Accepting pre-submission inquiries through Email, Facebook, LinkedIn, Twitter, etc. A wide selection of journals (inclusive of 9 subjects, more than 200 journals)
Providing 24-hour high-quality service User-friendly online submission system Fair and swift peer-review system
Efficient typesetting and proofreading procedure
Display of the result of downloads and visits, as well as the number of cited articles Maximum dissemination of your research work
Submit your manuscript at: http://papersubmission.scirp.org/