Modeling of resonantly pumped mid-infrared
Pr
3+-doped chalcogenide fiber amplifier with
different pumping schemes
M.
S
HEN,
1D.
F
URNISS,
1Z.
T
ANG,
1E.
B
ARNEY,
1L.
S
OJKA,
2S.
S
UJECKI,
1,2T.
M.
B
ENSON,
1 ANDA.
B.
S
EDDON,
1,*1Mid-Infrared Photonics Group, George Green Institute for Electromagnetics Research, Faculty of Engineering, University of Nottingham, University Park, Nottingham NG7 2RD, UK
2Telecommunications and Teleinformatics Department, Wroclaw University of Technology, Wybrzeze Wyspianskiego 27, 50-370 Wroclaw, Poland
Abstract: We propose a model for resonantly pumped Pr3+-doped chalcogenide fiber
amplifiers which includes excited state absorption and the full spectral amplified spontaneous
emission spanning from 2 μm to 6 μm. Based on this model, the observed near- and
mid-infrared photoluminescence generated from Pr3+-doped chalcogenide fiber is explained. Then
the output properties of a 4.1 μm resonantly pumped Pr3+-doped chalcogenide fiber amplifier
are simulated in both co- and counter-pumping schemes. Results show that the 4.1 μm counter -pumped fiber amplifier can achieve a power conversion efficiency (PCE) of over 62.8 % for
signal wavelengths ranging from 4.5 μm to 5.3 μm. This is, to our best knowledge, the highest
simulated PCE for a Pr3+-doped chalcogenide fiber amplifier.
© 2018 Optical Society of America
OCIS codes: (060.2360) Fiber optics amplifiers and oscillators; (140.3070) infrared and far-infrared lasers; (160.5690) Rare-earth doped material.
References and links
1. B. Behzadi, M. Aliannezhadi, M. Hossein-Zadeh, and R. K. Jain, “Design of a new family of narrow-linewidth mid-infrared lasers,” J. Opt. Soc. Am. B 34(12), 2501-2513 (2017).
2. F. Kühnemann, K. Schneider, A. Hecker, A. Martis, W. Urban, S. Schiller, and J. Mlynek, “Photoacoustic trace-gas detection using a cw single-frequency parametric oscillator,” Appl. Phys. B 66(6), 741-745 (1998). 3. M. Van Herpen, S. Bisson, A. Ngai, and F. Harren, “Combined wide pump tuning and high power of a continuous-wave, singly resonant optical parametric oscillator,” Appl. Phys. B 78(3-4), 281-286 (2004). 4. M. S. Vitiello, G. Scalari, B. Williams, and P. De Natale, “Quantum cascade lasers: 20 years of challenges,” Opt.
Express 23(4), 5167-5182 (2015).
5. J. Li, U. Parchatka, and H. Fischer, “A formaldehyde trace gas sensor based on a thermoelectrically cooled CW-DFB quantum cascade laser,” Anal. Methods 6(15), 5483-5488 (2014).
6. Y. Yao, A. J. Hoffman, and C. F. Gmachl, “Mid-infrared quantum cascade lasers,” Nat. Photonics 6(7), 432-439 (2012).
7. V. V. Fedorov, S. B. Mirov, A. Gallian, D. V. Badikov, M. P. Frolov, Y. V. Korostelin, V. I. Kozlovsky, A. I. Landman, Y. P. Podmar'kov, and V. A. Akimov, “3.77-5.05 μm tunable solid-state lasers based on Fe2+ -doped ZnSe crystals operating at low and room temperatures,” J. Quantum Electron. 42(9), 907-917 (2006). 8. S. B. Mirov, V. Fedorov, D. Martyshkin, I. Moskalev, M. Mirov, and V. Gapontsev, “Progress in mid-IR Cr2+
and Fe2+ doped II-VI materials and lasers,” Opt. Mater. Express 1(5), 898-910 (2011).
9. M. Bernier, V. Fortin, N. Caron, M. El-Amraoui, Y. Messaddeq, and R. Vallée, “Mid-infrared chalcogenide glass Raman fiber laser,” Opt. Lett. 38(2), 127-129 (2013).
10. M. Bernier, V. Fortin, M. El-Amraoui, Y. Messaddeq, and R. Vallée, “3.77 μm fiber laser based on cascaded Raman gain in a chalcogenide glass fiber,” Opt. Lett. 39(7), 2052-2055 (2014).
11. M. R. Majewski and S. D. Jackson, “Highly efficient mid-infrared dysprosium fiber laser,” Opt. Lett. 41(10), 2173-2176 (2016).
12. O. Henderson-Sapir, S. D. Jackson, and D. J. Ottaway, “Versatile and widely tunable mid-infrared erbium doped ZBLAN fiber laser,” Opt. Lett. 41(7), 1676-1679 (2016).
13. O. Henderson-Sapir, A. Malouf, N. Bawden, J. Munch, S. D. Jackson, and D. J. Ottaway, “Recent advances in
3.5 μm erbium-doped mid-infrared fiber lasers,” J. Sel. Top. Quantum Electron. 23(3), 1-9 (2017). 14. V. Fortin, M. Bernier, S. T. Bah, and R. Vallée, “30 W fluoride glass all-fiber laser at 2.94 μm,” Opt. Lett.
15. F. Maes, V. Fortin, M. Bernier, and R. Vallée, “5.6 W monolithic fiber laser at 3.55 μm,” Opt. Lett. 42(11), 2054-2057 (2017).
16. R. Woodward, M. Majewski, G. Bharathan, D. Hudson, A. Fuerbach, and S. Jackson, “Watt-level dysprosium
fiber laser at 3.15 μm with 73% slope efficiency,” Opt. Lett. 43(7), 1471-1474 (2018).
17. R. M. Almeida and J. D. Mackenzie, “Vibrational spectra and structure of fluorozirconate glasses,” J. Chem. Phys. 74(11), 5954-5961 (1981).
18. A. B. Seddon, Z. Tang, D. Furniss, S. Sujecki, and T. M. Benson, “Progress in rare-earth-doped mid-infrared fiber lasers,” Opt. Express 18(25), 26704-26719 (2010).
19. L. Shaw, B. Cole, P. Thielen, J. Sanghera, and I. Aggarwal, “Mid-wave IR and long-wave IR laser potential of rare-earth doped chalcogenide glass fiber,” J. Quantum Electron. 37(9), 1127-1137 (2001).
20. J. S. Sanghera, L. B. Shaw, and I. D. Aggarwal, “Chalcogenide glass-fiber-based mid-IR sources and applications,” J. Sel. Top. Quantum Electron. 15(1), 114-119 (2009).
21. L. Sojka, Z. Tang, D. Furniss, H. Sakr, A. Oladeji, E. Bereś-Pawlik, H. Dantanarayana, E. Faber, A. Seddon, and T. Benson, “Broadband, mid-infrared emission from Pr3+ doped GeAsGaSe chalcogenide fiber, optically clad,” Opt. Mater. 36(6), 1076-1082 (2014).
22. B. J. Park, H. S. Seo, J. T. Ahn, Y. G. Choi, D. Y. Jeon, and W. J. Chung, “Mid-infrared (3.5-5.5 μm) spectroscopic properties of Pr3+ -doped Ge–Ga–Sb–Se glasses and optical fibers,” J. Luminescence 128(10), 1617-1622 (2008).
23. I. D. Aggarwal and J. S. Sanghera, “Development and applications of chalcogenide glass optical fibers at NRL,” J. Optoelectron. Adv. Mater. 4(3), 665-678 (2002).
24. M. C. Falconi, G. Palma, F. Starecki, V. Nazabal, J. Troles, J.-L. Adam, S. Taccheo, M. Ferrari, and F. Prudenzano, “Dysprosium-doped chalcogenide master oscillator power amplifier (MOPA) for mid-IR emission,” J. Lightwave Technol. 35(2), 265-273 (2017).
25. M. C. Falconi, G. Palma, F. Starecki, V. Nazabal, J. Troles, S. Taccheo, M. Ferrari, and F. Prudenzano, “Design of an efficient pumping scheme for Mid-IR Dy3+: Ga
5Ge20Sb10S65 PCF fiber laser,” Photon. Technol. Lett. 28(18), 1984-1987 (2016).
26. Z. Tang, D. Furniss, M. Fay, H. Sakr, L. Sójka, N. Neate, N. Weston, S. Sujecki, T. M. Benson, and A. B. Seddon, “Mid-infrared photoluminescence in small-core fiber of praseodymium-ion doped selenide-based chalcogenide glass,” Opt. Mater. Express 5(4), 870-886 (2015).
27. A. B. Seddon, D. Furniss, Z. Tang, T. Benson, R. Caspary, and S. Sujecki, “True mid-infrared Pr3+ absorption cross-section in a selenide-chalcogenide host-glass,” in 18th International Conference on Transparent Optical Networks (ICTON), (IEEE, 2016), paper 7550709.
28. L. Sójka, Z. Tang, H. Zhu, E. Bereś-Pawlik, D. Furniss, A. Seddon, T. Benson, and S. Sujecki, “Study of mid-infrared laser action in chalcogenide rare earth doped glass with Dy3+, Pr3+ and Tb3+,” Opt. Mater. Express 2(11), 1632-1640 (2012).
29. J. Hu, C. R. Menyuk, C. Wei, L. B. Shaw, J. S. Sanghera, and I. D. Aggarwal, “Highly efficient cascaded amplification using Pr3+ -doped mid-infrared chalcogenide fiber amplifiers,” Opt. Lett. 40(16), 3687-3690 (2015).
30. M. Khamis and K. Ennser, “Design of highly efficient Pr3+ -doped chalcogenide fiber laser,” Photon. Technol. Lett. 29(18), 1580-1583 (2017).
31. L. Sójka, Z. Tang, D. Furniss, H. Sakr, E. Bereś-Pawlik, A. Seddon, T. Benson, and S. Sujecki, “Numerical and experimental investigation of mid-infrared laser action in resonantly pumped Pr3+ doped chalcogenide fibre,” Opt. Quantum Electron. 49(1), s11082-016-0827-0 (2017).
32. P. Sourková, B. Frumarova, M. Frumar, P. Nemec, M. Kincl, V. Nazabal, V. Moizan, J.-L. Doualan, and R. Moncorgé, “Spectroscopy of infrared transitions of Pr3+ ions in Ga–Ge–Sb–Se glasses,” J. Luminescence 129(10), 1148-1153 (2009).
33. R. Quimby, L. Shaw, J. Sanghera, and I. Aggarwal, “Modeling of cascade lasing in Dy: chalcogenide glass fiber laser with efficient output at 4.5 μm,” Photon. Technol. Lett. 20(2), 123-125 (2008).
34. P. Becker, N. Olsson, and J. Simpson, Erbium-Doped Fiber Amplifiers Fundamentals and Technology, (Academic 1999), Chap. 6.
35. A. A. Hardy and R. Oron, “Amplified spontaneous emission and Rayleigh backscattering in strongly pumped fiber amplifiers,” J. Lightwave Technol. 16(10), 1865-1873 (1998).
36. E. Yahel and A. Hardy, “Modeling high-power Er3+-Yb3+ codoped fiber lasers,” J. Lightwave Technol. 21(9), 2044-2052 (2003).
37. E. Karaksina, V. Shiryaev, M. Churbanov, E. Anashkina, T. Kotereva, and G. Snopatin, “Core-clad Pr(3+)-doped Ga(In)-Ge-As-Se-(I) glass fibers: preparation, investigation, simulation of laser characteristics,” Opt. Mater. 72, 654-660 (2017).
38. X. Zhu and R. Jain. “Numerical analysis and experimental results of high-power Er/Pr: ZBLAN 2.7 μm fiber lasers with different pumping designs,” Appl. Opt. 45(27), 7118-7125 (2006).
1. Introduction
Narrow-band mid-infrared (MIR) sources, particularly those covering the spectrum from 2.5
sensing, defense and environmental monitoring [1]. Usually, these narrow-band MIR sources include the optical parametric oscillator [2, 3], quantum cascade laser [4-6], transition-metal ion doped bulk crystal laser [7, 8], MIR Raman fiber laser [9, 10], rare-earth (RE) ion doped MIR fiber laser [11, 12] and so on. Among these, the RE doped MIR fiber laser is one of the promising candidates to achieve a notably robust, high power, high efficiency, near-diffraction limited MIR laser.
Continuous wave (CW) fiber lasers of 2.7 - 4 μm have been achieved by Er3+, Ho3+, or Dy3+
-doped ZBLAN fibers in recent decades [13]. The output power of an Er3+-doped ZBLAN CW
fiber laser has already reached 30 W at 2.9 μm [14]. However, the output power significantly decreases to a few Watts as output wavelength increases above 3 μm [15, 16], due to the relatively high phonon energy of ZBLAN glass fibers; this has become the main obstacle to realizing further power scaling for wavelengths longer than 4 μm [13, 17].
Chalcogenide glasses exhibit many excellent properties such as lower phonon energy, chemical durability towards water and oxygen, and reasonable solubility for RE ions. These enable them to be drawn into fiber and utilized as an active medium for the spectral range
beyond 4 μm [18]. RE dopants of Pr3+, Dy3+ and Tb3+ have attracted great attention since they
have numerous MIR transitions spanning from 3 μmto 12 μm [19, 20]. Moreover, 3 - 5 μm
photoluminescence (PL) has been observed in Pr3+, Dy3+ or Tb3+ -doped chalcogenide glass
fibers, which proves their potential capability for MIR lasing above 4 μm wavelength [21-25].
Recently, step index small core Pr3+-doped chalcogenide fiber has been reported with
comparatively low optical loss, around 2 dB/m in the wavelength region of 6.5 ~ 7.1 μm [26].
This indicates that MIR laser generation based on the Pr3+-doped chalcogenide fiber is
promising, yet, so far, no Pr3+-doped MIR chalcogenide fiber laser has been realized
experimentally. We suggest that this is mainly because of extrinsic hydride vibrational absorption loss, still to be eradicated in the active wavelength range [27], and also because of the complicated energy transitions of Pr3+ ions in the MIR wavelength region and a long lifetime
in the lower laser level. These two latter concerns suggest that an appropriate optical structure is required for practical MIR lasing.
Several optical structures have been proposed already and numerically simulated. Sójka et al. simulated a dual-wavelength cascade fiber laser structure based on Pr3+-doped chalcogenide
fiber [28]. Two pairs of fiber Bragg gratings (FBGs) were applied in this structure corresponding to two separate laser emissions from the 3H
6→3H5 (~3.7 μm) and 3H5→3H4 (~4.7
μm) transitions. Hu et al. proposed a cascade amplifier of Pr3+-doped chalcogenide fiber with
a 2 μm pump laser. The overlapped emission cross section between the 3H
6→3H5 and3H5→3H4
transitions was utilized for simultaneously amplifying a signal laser of 4.5 μm, which achieved a simulated slope efficiency of 45 % for the signal laser under the cooperative effect of the two transitions [29]. Khamis et al. recentlypresented a similar modeling result with 48 % slope efficiency in a cascade laser structure with a single FBG. In that structure, the Pr3+-doped
chalcogenide fiber was also pumped by a 2 μm laser and the overlapped emission cross section of Pr3+ions was used for 4.5 μm lasing as well [30]. Lately, Sójka et al. also reported a model
of a resonantly pumped Pr3+-doped chalcogenide fiber laser. Here, the simulated slope
efficiency of the 4.8 μm laser reached 55 % under 4.15 μm laser pumping [31]. Although, the feasibility of MIR laser operation has been confirmed in the previous work, none of the above publications considered the amplified spontaneous emission (ASE) effect attributed to the (3H
6, 3F
2)→3H4(~2.4 μm) transition of Pr3+ ions, which might transfer a part of the pump power to
near-infrared (NIR) ASE, around 2.4 μm, and away from the MIR lasing of interest. In fact,
excited-stated absorption (ESA) and the corresponding NIR PL have been found experimentally in Pr3+-doped Ga-Ge-Se-As fiber recently [31]. The peak of the NIR PL was at
a wavelength around 2.4 μm, as a consequence of the NIR ASE effect of the (3H
6, 3F2)→3H4
transition. Similarly, 2 - 3 μm NIR PL associated with the (3H
6, 3F2)→3H4 transition has already
Thus, a more general model for Pr3+-doped chalcogenide fiber that considers both the NIR ASE
and the MIR ASE is needed.
In this paper, we propose an improved simulation model, for resonantly pumped Pr3+-doped
chalcogenide fiber amplifiers, that includes ESA and the ASE spanning from 2 μm to6 μm.
This paper consists of five further parts: Section 2 describes the experimental measurement of NIR and MIR PL in Pr3+-doped chalcogenide fiber under 4.1 μm laser pumping; Section 3 is
the establishment of the theoretical model and its verification; Section 4 is the simulation of the
4.1 μm resonantly co- and counter-pumped Pr3+-doped chalcogenide fiber amplifier; Section 5
compares the different pumping schemes and considers optimization of the resonantly pumped amplifier. Finally, conclusions are drawn in Section 6.
2. PL experiment and results under 4.1 μm resonant pumping
The experimental set-up for the PL measurements of the Pr3+-doped chalcogenide fiber is
described in Fig. 1. The fiber sample used in the experiment was an unstructured 500 ppmw Pr3+-doped Ga-Ge-Se-As fiber of 102 mm length and 230 μm outside diameter; it was pumped
by a quantum cascade laser (Model 1101-4150-CW-1500, Pranalytica) operating at a
wavelength of 4.1 μm with an output power of 100 mW. The collimated beam of the pump
laser was focused on the launch end of the fiber sample using an aspheric lens with a 5.95 mm
focal length (390028-E, Thorlabs). The PL signal generated by the Pr3+-doped fiber was
collimated and focused by a CaF2 lens pair with focal lengths of 50 mm (LA5763, Thorlabs)
[image:4.612.192.421.498.596.2]and 40 mm (LA5370, Thorlabs), respectively. The output PL signal was modulated using a chopper (Scitec Instruments), at a frequency of 70 Hz, before being collected, then a lock-in amplifier (9503SC, Brookdale Electronics Ltd.) was used to enhance the signal-to-noise ratio (SNR) of the PL signal. Finally, the output PL spectrum was measured using a monochromator with a built-in diffraction grating blazed at 6 μm (Jobin Yvon). Two different detectors were utilized for the PL signal measurement in two different wavelength regions. The 2 to ~ 2.6 μm NIR PL signal was detected using a room temperature extended InGaAs detector (PDA10D-EC, Thorlabs), whilst a HgCdTe detector (PVI-4TE-6, Vigo System) with a four stage thermoelectric cooler was used for detecting the 4 to ~ 6 μm MIR PL signal. During the MIR PL measurement, the wavelength of output spectrum was recorded from 4.3 μm to 6.3 μm, to avoid the residual pump laser (4.1 μm) in the output spectrum, and a 3.4 μm long-pass filter (SLWP-3403-001120, Northumbria Optical Coatings Ltd.) was placed in front of the monochromator to prevent the interference of the NIR PL on the output spectrum. For the NIR PL measurements, the LPF (long-pass filter) was removed from the whole setup.
Fig. 1. Experimental set-up for the PL measurements of Pr3+-doped chalcogenide-selenide fiber. A quantum cascade laser (QCL) operating at a wavelength of 4.1 μm was the pump laser. Expanded InGaAs, and HgCdTe, detectors were respectively used for the NIR PL, and MIR PL, signal detection (LPF: long-pass filter).
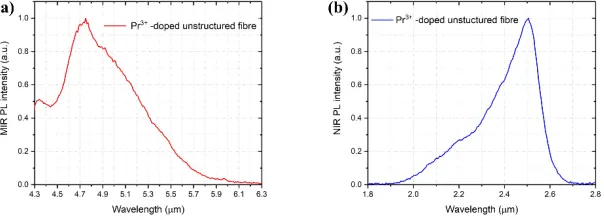
Both MIR and NIR PL were observed under the 100 mW, 4.1 μm laser pumping. The MIR
PL spectrum of the Pr3+-doped chalcogenide fiber is presented in Fig. 2(a). Broadband PL was
26]. Figure 2(b) shows the NIR PL spectrum of the fiber, which spans the wavelength range from 1.9 μm to 2.6 μm, and the peak wavelength is located around 2.5 μm. It should be noted that both MIR and NIR PL spectra in Fig. 2 were normalized by their respective peak intensities.
Fig. 2. The output: (a) MIR PL spectrum and (b) NIR PL spectrum, were obtained from Pr3+ -doped Ga-Ge-Se-As fiber, resonantly pumped at the wavelength 4.1 μm, with pump power of 100 mW. Each spectrum was normalized to ‘1’ by dividing by its highest PL intensity.
Based on the electronic energy level diagram of Pr3+ ions, shown in Fig. 3(a), it can be seen
that the MIR PL, which peaked at 4.75 μm, is MIR ASE from the 3H
5→3H4 transition and
generated by ground state absorption (GSA). The peak NIR PL, located at 2.5 μm, is NIR ASE associated with the (3H
6, 3F2)→3H4 transition and enabled by excited state absorption (ESA)
that describes the absorption process of the 3H
5→(3H6, 3F2) transition. Figure 3(b) shows the
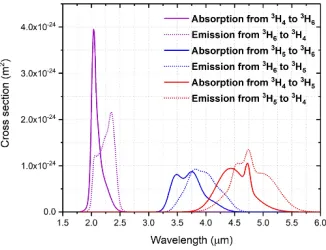
absorption cross section of the GSA and the ESA from Pr3+-doped Ga-Ge-Se-As fiber [31]. The
GSA cross section presented has been modeled and recalculated to take account of the underlying H-Se extrinsic absorption in the glass host [27]. Apparently, the profiles of the GSA and the ESA overlap in the wavelength range from 3.7 μm to ~ 4.5 μm. Thus, the 4.1 μm pump
laser used in the PL experiments had the opportunity to be simultaneously absorbed by Pr3+
ions in both the ground state (3H
4) and the excited state (3H5). In this case, the two processes of
ESA and MIR ASE can occur for the 3H
5 level of the Pr3+ ions under 4.1 μm resonant pumping,
which leads to the co-existence of the NIR PL [(3H
6, 3F2)→3H4] and the MIR PL (3H5→3H4).
Statistically speaking, the (3H
6, 3F2)→3H5 transition is not likely to occur because the population
of the 3H
5 level will tend to be much higher than that of the (3H6, 3F2) level. Therefore, the
excited Pr3+ ions populating the (3H
6, 3F2) level would have been prone to fall to the ground
state (3H
4) and result in the emission of the NIR PL.
[image:5.612.142.474.503.621.2]These PL results indicate that MIR lasing using resonantly pumped Pr3+-doped
chalcogenide-selenide fiber is promising. However, the simultaneous presence of MIR PL and NIR PL predicts that a part of the pump power might be depleted by NIR emission rather than contributing to MIR lasing; this should be considered when investigating MIR laser operation of Pr3+-doped chalcogenide fiber via resonant pumping. Therefore ESA, and the effect of the
full spectral ASE, should both be taken into account when simulating this resonantly pumped Pr3+-doped chalcogenide fiber amplifier.
3. Simulation model and verification
The above section reported the existence of both NIR PL and MIR PL experimentally demonstrated in Pr3+-doped chalcogenide fiber. In this section, a more general amplifier model,
that considers the ESA and the full spectral ASE effect, is established. Based on this model, the output PL properties of Pr3+-doped chalcogenide fiber under 4.1 μm resonant pumping are
simulated and compared with the experimental PL results to provide verification of the model.
3.1 Simulation model
The electronic transitions of the Pr3+ ions under resonant pumping are considered within a
simplified three-level system. From the energy transition diagram shown in Fig. 4, the 3H 4→3H5
transition corresponds to the absorption process of the pump laser, and the MIR signal laser is amplified by the 3H
[image:6.612.217.388.338.415.2]5→3H4 transition.
Fig. 4. Energy levels and transitions of Pr3+ ions.
In order to simulate the process of MIR laser amplification, the population distribution of the Pr3+ions along the active fiber is required, it is described by solving the rate and total
population equations shown in Eqs. (1) [29, 33]:
3
1 13 2 23 3 31 32 3
2
1 12 2 21 23 21 3 32 32
1 2 3
( )
( ) ( )
a a e e
a e a e
dN
N W N W N W W W
dt dN
N W N W W W N W W
dt
N N N N
= + − + +
= − + + + +
= + +
(1)
Here, N1, N2, N3 respectively stand for the population of levels 3H4, 3H5, and 3H6. N is the
total doping concentration of Pr3+ ions in the fiber. W
e31, We32, and We21 are the stimulated
emission rates for transitions 3H
6→3H4, 3H6→3H5 and 3H5→3H4,respectively. Similarly, Wa13,
Wa23, and Wa12 represent the stimulated absorption rate of the corresponding transitions,
respectively. W3 is the total spontaneous emission rate of 3H6 level, which is written as W3 =
W31+W32= 1/τ3. W31,W32, W21are respectively denoted as the spontaneous emission rate from
level i (i=3,2) to level j (j = 2,1), each of them can be obtained from Wij= βijτi. βij is the branching
ratio between level i and level j, τi is the lifetime oflevel i. In our model, a steady state situation
1 13 2 23 3 31 32 3
1 12 2 21 23 21 3 32 32
1 2 3
( ) 0
( ) ( ) 0
a a e e
a e a e
N W N W N W W W
N W N W W W N W W
N N N N
+ − + + =
− + + + + =
= + +
(2)
The stimulated absorption rate Waij and the stimulated emission rate Weij are expressed by
the integral forms presented in Eqs. (3):
1 ( ) ( ) ( ) 1 ( ) ( ) ( ) aij aij eij eij
W P d
Ahc
W P d
Ahc
λ σ λ λ λ λ
λ σ λ λ λ λ
= Γ
= Γ
∫
∫
(3)where i,j = 1,2,3 are the different energy levels, σaij and σeij are the absorption cross section
(ACS) and emission cross section (ECS) of the transition from level i to level j, respectively. Figure 5 shows the ACS and ECS of each transition in Pr3+-doped chalcogenide glass, it should
be noted that the H-Se impurity vibrational absorption band underlying in the absorption from
3H
4 to 3H5 was removed by recalculating the ACS of this transition [27, 28, 31]. P(λ) is the
spectral power density at a wavelength λ. Г(λ) is the confinement factor at a wavelength λ, namely the overlap between the mode field and the Pr3+-doped core of the fiber, which is
determined by the core diameter and numerical aperture of the fiber [34]. A, h and c are the area
of the fiber core, Planck’s constant and the speed of light in vacuo, respectively. The
propagation equation for the wavelength λ is given by [29]:
3 32 2 21 3 31
( )
( ) ( ) ( e e e ) ( ) spon ( )
dP
g P N N N P P
dz
λ = Γ λ λ + σ + σ + σ Γ λ −α λ
(4)
where g is thenet gain produced by the Pr3+ ions and is defined as:
(
3 e32 2 a23) (
2 e21 1 a12) (
3 e31 1 a13)
g= Nσ −Nσ + Nσ −Nσ + Nσ −Nσ (5)
The power density for the spontaneous emission noise is written as Pspon = 2Δλhc2/λ3 [35,
36]. Δλ is the wavelength step of 10 nm used to resolve the ASE spectrum, and α in Eq. (4) is the background loss of the fiber. According to Eqs. (2)-(5), the power evolution can be simulated in a Pr3+-doped fiber amplifier. It should be noted that g represents the net gain
contributed from all energy transitions in Pr3+ ions, the first term is associated with the ESA
process, the second term is contributed by the signal amplification at a wavelength from 3.8
[image:7.612.214.377.487.612.2]μm to 5.7 μm, and the third term is related to the NIR ASE.
Fig. 5. Both absorption (solid curve) and emission (dashed curve) cross sections from the Pr3+ -doped chalcogenide fiber. Note that the true ACS of the 3H
4→3H5 transition is presented with the underlying H-Se impurity vibrational absorption band removed. [27, 28, 31].
3.2 Model verification
simulate the process of PL generation. The pump wavelength, pump power and fiber parameters were selected to be consistent with the PL experiments. The pump power at the launch end of
the Pr3+-doped fiber was assumed to be 100 mW and to be completely coupled into the fiber
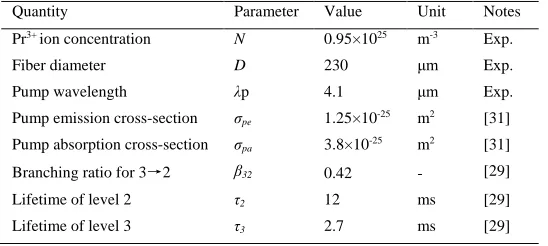
without any Fresnel reflection. The fiber length was set as 102 mm which was the same length as the fiber sample used in the PL experiments. The fiber loss was assumed to be 1 dB/m at all wavelengths [29-31], which is a simplified situation for our modeling. However, it is known that the H-Se extrinsic absorption underlying the MIR region exceeds 1 dB/m in our present experimental Pr3+-doped chalcogenide glass fiber [27]. Other parameters used in the modeling
[image:8.612.171.445.258.381.2]are listed in Table 1. and correspond to our experimental data or data taken from the literature [27, 29, 31]. Note that here the core diameter shown in Table 1. is the fiber outside diameter for our unstructured fiber.
Table 1. Modeling parameters for PL generated from Pr3+-doped chalcogenide glass fiber. (Exp. means parameters from our experiment.)
Quantity Parameter Value Unit Notes
Pr3+ ion concentration N 0.95×1025 m-3 Exp.
Fiber diameter D 230 μm Exp.
Pump wavelength λp 4.1 μm Exp.
Pump emission cross-section σpe 1.25×10⁻²⁵ m2 [31]
Pump absorption cross-section σpa 3.8×10⁻²⁵ m2 [31]
Branching ratio for 3→2 β32 0.42 - [29]
Lifetime of level 2 τ2 12 ms [29]
Lifetime of level 3 τ3 2.7 ms [29]
The calculated MIR PL spectrum is shown in Fig. 6(a) and, as expected, covers wavelengths
from 3.5 μm to 6 μm. The comparison between the calculated and experimental spectra, over the available wavelength range from 4.3 μm to 6 μm is presented in Fig. 6(b). The dominant peak in the calculated spectrum is at a wavelength of 4.79 μm and is mainly attributed to the
3H
5→3H4 transition, which is quite close to the experimentally observed value of 4.75 μm.
Furthermore, a second peak in the calculated spectrum is observed around 4.5 μm, which is
consistent with the ECS shape of the 3H
5→3H4 transition of Pr3+ ions, as shown in Fig. 5. In
contrast, the 4.5 μm peak shown in the calculated spectrum is missing in the experimental spectrum as demonstrated in Fig. 6(b). It is believed that this is due to extrinsic vibrational absorption from the H-Se contamination in the experimental glass fiber sample which exhibits a strong, broad absorption band peaking around 4.5 μm [21, 26, 27].
Fig. 6. (a) Calculated MIR PL spectrum (solid curve) and (b) comparison with the experimental MIR PL spectrum (dashed curve) over the available wavelength range from 4.3 μm to 6 μm. Note that the experimentally measured MIR PL spectrum shown in Section 2 was recorded from
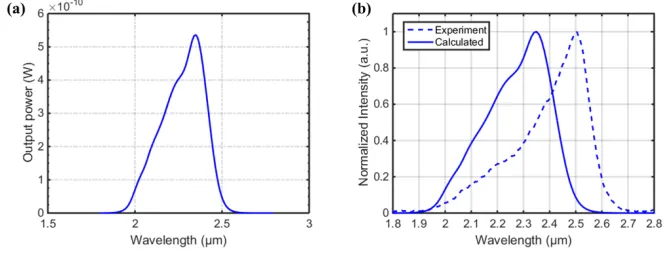
Figure 7(a) shows the calculated NIR PL spectrum covering 2 μm to 2.5 μm, in which a
single peak at a wavelength of 2.35 μm due to the (3H
6, 3F2)→3H4 transition is observed. It
suggests that the experimentally observed NIR PL is closely described by our simulation model. However, a difference between the calculated and experimental NIR spectra is found in Fig.
7(b). The peak wavelength of the experimental NIR spectrum is at 2.5 μm, which is 150 nm
longer than the calculated NIR peak at 2.35 μm. This is mainly because the ECS used in our calculation was calculated from the ACS of the 3H
4→(3H6, 3F2)transition via the Mc-Cumber
theory [28], which corresponds to photon absorption around 2 μm, as shown in Fig. 5. However, in the PL experiment, the NIR PL of the Pr3+-doped chalcogenide fiber is generated by the ESA
process of the 4.1 μm pump laser. One of the possible reasons is that the energy levels (3H 6, 3F
2) are have been hypothesized to be thermally coupled together, and that the centers of the 3H
6 and 3F2 levels are approximately separated by 600 cm-1 (~200 nm) [19]. This thermal
coupling might increase the probability that the Pr3+ ions, excited to the (3H
6, 3F2) levels by
absorbing different wavelength photons, are distributed differently within these two thermally coupled levels. Thus, the ECS of the (3H
6, 3F2)→3H4 transition may vary with the absorption of
photons of different photon energy, and the peak wavelength of the NIR PL spectrum could then be shifted by a notable amount from the calculated value of 2.35 μm to the experimentally
measured value of 2.5 μm, as found in Fig. 7(b). This will be experimentally investigated in future work.
Despite these differences between the calculated and experimental PL results from the 4.1
μm resonantly pumped Pr3+-doped chalcogenide-selenide fiber, similar optical behavior is
exhibited, which suggests that our simulation model is reliable. To our best knowledge, this is the first time that the NIR PL generated by Pr3+-doped chalcogenide fiber is explained using a
simulation model.
Fig. 7. (a) Calculated NIR PL spectrum (solid curve) and (b) comparison with the experimental NIR PL spectrum (dashed curve) over the wavelength range from 1.8 μm to 2.8 μm.
4. Simulation results and discussion of the fiber amplifiers
4.1 Pump wavelength selection
From the above experiments and the simulations of the PL behavior based on the 4.1 μm resonantly pumped Pr3+-doped chalcogenide fiber, it can be seen that the ESA process will
consume a part of 4.1 μm pump power and generate the NIR ASE. It is suggested that the power conversion efficiency (PCE) of the resonantly pumped MIR Pr3+-doped chalcogenide fiber
amplifier might also be affected by ESA of the pump laser. Therefore, the wavelength of the pump laser should be carefully selected for the simulation of the fiber amplifier.
In Fig. 8, the three calculated cross-sections of the ESA (σa23), GSA (σa12), and the emission
of the 3H
5→3H4 transition (σe21) from Pr3+-doped chalcogenide-selenide fiber are depicted [31].
Usually, in an amplifier, the GSA of the pump laser should be stronger than the emission at the pump wavelength λp, namely σa12(λp) > σe21(λp). Thus, the wavelength of the pump laser should
[image:9.612.135.469.373.500.2]below 4.05 μm, theσa23(λp) will be larger than σa12(λp) which would result in a strong ESA
process of the pump laser between the 3H
5→(3H6, 3F2) transition. Therefore, the wavelength of
the pump laser for the resonantly pumped Pr3+-doped chalcogenide glass fiber amplifier,
considered here, should be located within the range of 4.05 μm to 4.5 μm, so that the GSA of the pump laser is stronger than both the emission and the ESA at the pump wavelength. In the next sub-sections, the pump wavelength is set to be 4.1 μm in the simulation of the resonantly pumped fiber amplifier to keep consistency with the above PL experiments (in Section 2) and simulations (in Section 3).
Fig. 8. Cross sections of the ESA (σa23), GSA (σa12), emission from the 3H5→3H4 transition (σe21) in the Pr3+-doped chalcogenide-selenide fiber [31]. The selected range of the pump wavelength is shown in the gray region.
4.2 Co-pumping scheme
Based on the model introduced in Section 3.1, the output optical properties of the 4.1 μm co-pumped Pr3+-doped chalcogenide fiber amplifier are simulated. The optical structure of the
simulated amplifier is shown in Fig. 9, in which the pump laser and the signal laser are coupled into the fiber using a dichroic mirror. In the simulation, a Pr3+-doped small-core
chalcogenide-selenide fiber, with core diameter of 10 μm and numerical aperture of 0.3 was chosen as the active fiber, as it had been made and measured in the literature [26, 29], and the concentration of Pr3+ ions was set as 2×1025 m-3 (1000 ppmw Pr3+ ions) [19, 29, 37]. The pump power was
selected to be 10 W at a wavelength of 4.1 μm, and the signal power was selected as 0.1 W [29]. Other parameters used in the simulation are listed in Table 1. It should be noted that all the simulations presented in this paper assume a constant background loss in the Pr3+-doped
chalcogenide fiber across the active wavelength regions of 1 dB/m [29-31]; this is not yet achieved in practice. The underlying extrinsic absorption loss in the glass host exceeds this level by more than an order of magnitude at specific contaminant associated vibrational absorption bands [27]. Yet assuming a 1 dB/m fiber loss, a simplified situation in terms of the fiber quality, leads to some promising results, which shows the underlying physical mechanisms of signal amplification in the 4.1 μm resonantly pumped Pr3+-doped fiber amplifier.
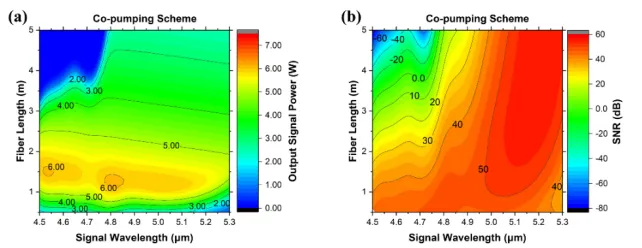
[image:10.612.219.381.197.331.2] [image:10.612.209.403.593.660.2]In order to find the optimal signal laser wavelength, and active fiber length, in the co-pumped amplifier, the output signal power and SNR were calculated for different signal wavelengths and different active fiber lengths. The SNR is defined in Eq. (6):
signal
output signal
SNR 10 lg P
P P
=
−
(6)
where the output signal power and the total output power are noted as Psignal and Poutput,
respectively. The scan range of the signal wavelength was set as 4.5 μm to 5.3 μm, and that for the fiber length was set as 0.5 m to 5 m. The results of output signal power and SNR are respectively presented in Fig. 10(a) and Fig. 10(b) in the form of 2-D contour-maps: the horizontal axis is the signal wavelength, the vertical axis is the length of the Pr3+-doped
chalcogenide-selenide fiber, and the color-bar represents the output signal power in Fig. 10(a) and the SNR in Fig. 10(b).
Fig. 10. (a) The output signal power evolution and (b) the SNR evolution with signal wavelength varying from 4.5 μm to 5.3 μm and active fiber lengths varying from 0.5 m to 5 m in a 4.1 μm co-pumped Pr3+-doped chalcogenide-selenide fiber amplifier.
The maximum output signal power in a 4.1 μm co-pumped Pr3+-doped chalcogenide fiber
amplifier was obtained under two conditions: (1) 6.03 W for 1.5 m of active fiber, seeded with a 4.53 μm signal laser and (2) 6.08 W for 1.2 m of active fiber, seeded with a 4.82 μm signal laser, as shown in Fig. 10(a). It can be clearly seen from Fig. 10(a) that the output signal power strongly depends on the length of the active fiber. The optimum active fiber length for achieving the maximum output signal power is between 1.2 m and 1.5 m. When the active fiber length is less than 1.2 m, the output signal power increases with the fiber length because the pump power is not fully absorbed for the case of shorter fiber lengths. When further increasing the fiber length beyond 1.5 m, the output power begins to decrease in two different downward trends. It is also apparent from Fig. 10(a) that, in the region of signal wavelength less than 4.8 μm, the output signal power is reduced dramatically when the fiber length is longer than 1.5 m. A slower, and almost linear, decrease of output signal power with an increase in active fiber length is observed for signal wavelengths longer than 4.8 μm. Additionally, the SNR shows a dependency on the signal wavelength in Fig. 10(b). For the signal wavelengths less than 4.8
μm, the SNR experiences a significant decline from 50 dB to - 50 dB as the fiber length is
increased. In the range of signal wavelengths between 4.8 μm and5.1 μm, the SNR remains
above 10 dB after initially decreasing from 50 dB. For signal wavelengths longer than 5.1 μm, the SNR is first increased from 40 dB to 50 dB and then remains steady.
Thus evolution of each of the output signal power and the SNR, respectively, suggest that the underlying physical mechanisms of signal amplification are different for different active fiber lengths and signal wavelengths: this observation informs that understanding the amplification process of the co-pumped Pr3+-doped chalcogenide fiber amplifier is essential.
[image:11.612.150.471.251.375.2]4.53 μm, 4.82 μm, and 5.1 μm using a shorter fiber length of 1.5 m, a medium fiber length of 3 m and a longer fiber length of 4.5 m.
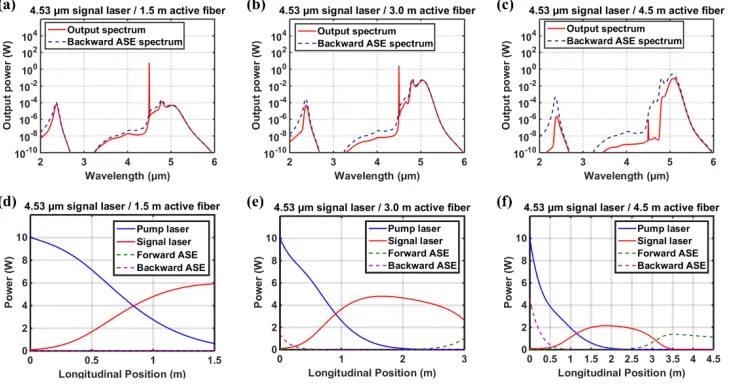
The output spectrum and backward ASE spectrum calculated for a 4.53 μm signal laser and the three different active fiber lengths are shown in Fig. 11(a)-11(c), the corresponding power distributions along each fiber length are presented in Fig. 11(d)-11(f). Apparently, the output spectrum is composed of an amplified signal laser, the MIR ASE and the NIR ASE. The MIR ASE in the output spectrum, spanning from 3.2 μm to 5.9 μm, is attributed to the 3H
5→3H4
transition, and the two main peaks of the MIR ASE are located at wavelengths of 4.82 μm and
5.1 μm, respectively. The NIR ASE mainly occurs over the wavelength range from 2 μm to 2.7
μm and is due to the (3H
6, 3F2)→3H4 transition after the ESA process; the peak of the NIR ASE
is at 2.35 μm. Similar to the output spectrum, the backward spectrum consists of the NIR ASE and the MIR ASE but not the amplified signal laser.
For a 4.53 μm signal laser and a 1.5 m active fiber length, the output power is dominated by the amplified signal laser, and the peak power of ASE is about six orders of magnitude less than the output power of signal laser, as shown in Fig. 11(a). A similar phenomenon is presented by the power distribution along the active fiber in Fig. 11(d); only the signal laser is amplified by the pump laser, showing an upward trend of the signal power, and both forward and backward ASE power are nearly kept at a zero level. However, with a further increase of the active fiber length, the signal power starts to decrease, as shown in Fig. 11(e) and 11(f). It is obvious that the signal power increases in the front 1.5 m of the active fiber then decreases in the rear section of the active fiber. Meanwhile, forward and backward ASE power are evident at the same time, of which the major ASE spectral component is the MIR ASE ranging from
[image:12.612.125.492.375.568.2]4.8 μm to 5.3 μm, as presented in Fig. 11(b) and 11(c). In Fig. 11(c), the MIR ASE peak power exceeds the signal power and the NIR ASE peak power for an active fiber length of 4.5 m.
Fig. 11. For a 4.1 μm co-pumped Pr3+-doped chalcogenide-selenide fiber amplifier seeded with
a 4.53 μm signal laser: Output spectra (red curves) and backward ASE spectra (blue dashed curves) for a: (a) 1.5 m long active fiber, (b) 3 m long active and (c) 4.5 m long active fiber. Power distributions of pump (blue curves), signal (red curves), forward (green dashed curves) and backward ASE (purple dashed curves) for a: (d) 1.5 m long active fiber, (e) 3 m long active fiber and (f) 4.5 m long active fiber.
The significant power drop at the signal wavelength of 4.53 μm with further increase in fiber length, shown in Fig. 10(a), is the consequence of re-absorption of the 4.53 μm signal laser. As presented in Fig. 11(e) and 11(f), in the front section (< 1.5 m) of the active fiber, the
4.53 μm laser is amplified since the pump power is strong enough to provide gain at this
m), the pump power is depleted and most of the Pr3+ ions thus remain in the ground state.
Subsequently, these Pr3+ ions in the ground state absorb the 4.53 μm signal laser and transit to
the 3H
5 level. Finally, the Pr3+ ions excited to the 3H5 level return to the ground state via
spontaneous emission. The generated spontaneous emission noise will be augmented by propagating along the active fiber in the forward and backward directions, which results in the excitation of forward and backward ASE. Somewhat surprisingly for the situation of a 4.5 m long active fiber length shown in Fig. 11(f), almost all signal power is converted into ASE power in the rear section of the active fiber.
Moreover, it can be seen from Fig. 11(f) that the backward ASE power is two times higher than the forward ASE power, which reveals that backward ASE has larger gain than the forward ASE in the 4.5 m long active fiber. We suggest that this is because in the longer active fiber,
backward ASE may extract both the 4.53 μm signal power and the 4.1 μm pump power, while
forward ASE can only extract the 4.53 μm signal power. It should be noted that strong backward ASE power is likely to cause a reduction of the signal laser power, thus the active fiber length would have to be carefully selected to suppress the backward ASE for the 4.1 μm co-pumping fiber amplifier seeded with a 4.53 μm signal laser.
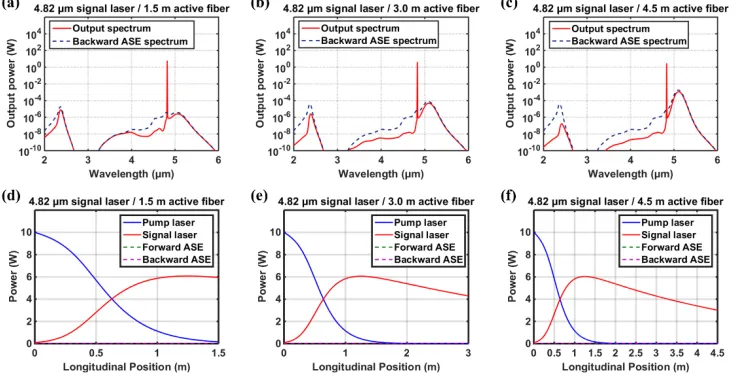
For the situation of a 4.82 μm signal laser, the peak powers of forward and backward MIR ASE are gradually increased as the active fiber length increases from 1.5 m to 4.5 m due to the re-absorption of the 4.82 μm signal laser, as shown in Fig. 12(a)-12(c). The most distinct ASE power peak is contributed by MIR ASE located at 5.1 μm. Compared to the situation for a 4.53
μm signal laser, the NIR and MIR ASE effects are both weaker for a 4.82 μm signal laser.
Particularly, the MIR ASE peak power at 5.1 μm always maintains a level at least 20 dB lower
[image:13.612.123.494.445.634.2]than the peak power of amplified signal laser when the active fiber length is 4.5 m, as demonstrated in Fig. 12(c). Meanwhile, the weak ASE effects are also observed in the power distribution of the amplification process of the 4.82 μm signal laser shown in Fig. 12(d)-12(f). Both forward and backward ASE powers are imperceptible for the three different active fiber lengths. However, the signal power still begins to drop after propagating for over 1.5 m in the active fiber. These observations of the simulated behavior suggest that this power drop is mainly attributed to the background loss of the fiber rather than the excitation of NIR and MIR ASE.
The weak MIR ASE effect observed for the situation of a 4.82 μm signal laser is because the ACS of the 3H
4→3H5 transition at the wavelength 4.82 μm is much smaller than that at 4.53
μm, as shown in Fig. 5. It is clearly seen from Fig.5 that the ACS experiences a sharp decrease
when the signal wavelength is longer than 4.75 μm, which means that the signals above 4.8 μm
are difficult to be re-absorbed by Pr3+ ions. It indicates that better MIR ASE suppression could
be achieved by shifting the signal wavelength towards longer wavelengths.
This is further confirmed by the results of simulation for a 5.1 μm signal laser, as shown in Fig. 13(a)-13(c). The NIR and MIR ASE signals are approximately six orders of magnitude lower than the signal power, which can be seen as the noise in both the output and backward ASE spectra for each of the three active fiber lengths. In addition, no distinct MIR ASE peak is found in the spectral results for a 5.1 μm signal laser compared with those for 4.53 μm and
4.82 μm signal lasers. From Fig. 13(d)-13(f), it can be seen that only the 5.1 μm signal laser is amplified, and neither forward nor backward ASE power are excited along the active fiber. Although, NIR and MIR ASE effects are better suppressed using a longer signal wavelength in a 4.1 μm co-pumped Pr3+-doped chalcogenide fiber amplifier, it is found that a higher quantum
[image:14.612.121.493.283.474.2]defect is brought about as well, which will be discussed further in Section 5.
Fig. 13. For a 4.1 μm co-pumped Pr3+-doped chalcogenide-selenide fiber amplifier seeded with
a 5.1 μm signal laser: Output spectra (red curves) and backward ASE spectra (blue dashed curves) for a: (a) 1.5 m long active fiber, (b) 3 m long active and (c) 4.5 m long active fiber. Power distributions of pump (blue curves), signal (red curves), forward (green dashed curves) and backward ASE (purple dashed curves) for a: (d) 1.5 m long active fiber, (e) 3 m long active fiber and (f) 4.5 m long active fiber.
4.3 Counter-pumping scheme
Apart from the co-pumping scheme described in Section 4.2, a counter-pumping scheme is also considered to be an efficient pumping scheme for the amplifier configuration [38]. The output optical properties of the 4.1 μm counter-pumped Pr3+ -doped chalcogenide fiber amplifier were
Fig. 14. The optical structure of the simulated 4.1 μm counter-pumped Pr3+-doped-selenide chalcogenide fiber amplifier.
It can be clearly seen from Fig. 15(a) that the maximum output signal power in a 4.1 μm
counter-pumped Pr3+ -doped chalcogenide fiber amplifier was obtained under two distinct
conditions: (1) 7.19 W for 2.2 m of active fiber, seeded with a 4.53 μm signal laser; (2) 7.22 W for a 2.2 m of active fiber, seeded with a 4.82 μm signal laser. These simulated output powers are ~ 1 W higher than the results observed in the 4.1 μm co-pumping scheme (6.03 W for 1.5
m of active fiber, seeded with a 4.53 μm signal laser; 6.08 W for 1.2 m of active fiber, seeded with a 4.82 μm signal laser), shown in Fig. 10(a). Meanwhile, the output power evolution for the counter-pumping scheme may be described by two different trends in Fig. 15(a), as follows. When the signal wavelengths are below 4.8 μm, the output signal power first increases to 7 W, and then dramatically decreases along the fiber length. On the other hand, the output power for signal wavelengths beyond 4.8 μm, after an initial increase in the front section of the fiber length, remains stable at 7 W as the active fiber length is increased. The signal wavelength of 4.8 μm can also be seen as a boundary between different variations of the SNR in Fig. 15(b).
When the signal wavelengths are less than 4.8 μm, the SNR shows a rapid downward trend
from 50 dB to -30 dB. For a signal wavelength longer than 4.8 μm, SNR increases at first, then slowly decreases with the active fiber length. The maximum SNR of 50.4 dB emerges for an active fiber length of 1.4 m, seeded with a 5.1 μm signal laser.
Fig. 15. (a) The output signal power evolution and (b) the SNR evolution with signal wavelength
varying from 4.5 μm to 5.3 μm and active fiber lengths varying from 0.5 m to 5 m in a4.1 μm
counter-pumped Pr3+-doped chalcogenide fiber amplifier.
In order to analyze further the evolution of the output signal power and SNR in a 4.1 μm counter-pumped Pr3+ -doped chalcogenide fiber amplifier, more detailed simulations of the 4.53
μm and 4.82 μm signal amplification were undertaken. Their output spectrum, backward ASE spectrum and power distribution were respectively calculated for active fiber lengths of 2.2 m, 3 m and 4 m.
[image:15.612.143.463.399.522.2]Fig. 16. For a 4.1 μm counter-pumped Pr3+-doped chalcogenide-selenide fiber amplifier seeded
with a 4.53 μm signal laser: Output spectra (red curves) and backward ASE spectra (blue dashed curves) for a : (a) 2.2 m long active fiber, (b) 3 m long active and (c) 4 m long active fiber. Power distributions of pump (blue curves), signal (red curves), forward (green dashed curves) and backward ASE (purple dashed curves) for a : (d) 2.2 m long active fiber, (e) 3 m long active fiber and (f) 4 m long active fiber. Note that the power distributions for 2.2 m and 3 m long fibers are respectively presented on a log. scale to distinguish the curves.
The generation mechanisms of NIR and MIR ASE in the two 4.1 μm pumping schemes
with 4.53 μm signal laser, i.e. co-pumping and counter pumping, are quite different, as follows. The MIR ASE in the co-pumping scheme is mainly attributed to the reabsorption of the signal laser, whilst the MIR ASE in the counter-pumping scheme is mainly induced by the 4.1
μm pump laser. Since the 4.1 μm pump laser is launched from the rear end of the fiber in the counter-pumping scheme, as shown in Fig. 16(e) and 16(f), in the front section of the active fiber (< 1 m), the pump power is quite low. Thus, the 4.53 μm signal laser is likely to be reabsorbed before being amplified by the 4.1 μm pump laser; this fits the decrease of the signal power observed in the front section of fiber. In Fig. 16(e), for a 3 m long fiber, the propagating
signal power at 4.53 μm is higher than the forward ASE power along all the fiber length. The former could be amplified in the rear section of the active fiber despite the fact that a part of the signal power is reabsorbed in the front section of fiber. However in Fig. 16(f), on further increasing the active fiber length to 4 m, the propagating signal power at 4.53 μm is exceeded by the forward ASE power in the rear section of the fiber, by 20 dB, which indicates that the pump power is eventually converted to NIR and MIR ASE power instead of the signal power
at the wavelength of 4.53 μm.
In terms of the generated NIR ASE, due to the ESA process of the 4.1 μm pump laser, this is much stronger in the counter-pumping scheme than that in the co-pumping scheme. For counter-pumping with 4.53 μm signal laser, it is obvious that the peak of NIR ASE is almost at the same power level as the peak of the MIR ASE presented in Fig. 16(b) and 16(c). For co-pumping, however, the NIR ASE is lower than the MIR ASE shown in Fig. 11(b) and 11(c). More specifically, in the counter-pumping scheme, the 4.53 μm signal laser is launched from
the front end of the active fiber while the 4.1 μm pump laser is launched from the opposite end. Thus, due to the existence of reabsorption of the 4.53 μm signal laser, the signal power will begin to decrease from the front section of the active fiber. For a 4 m long active fiber, presented in Fig. 16(f), after the long distance propagating to the rear section of fiber, the 4.53 μm signal power is too weak to depopulate the excited Pr3+ ions in the 3H
5 level, even though there is a
surplus of 4.1 μm pump power. These excited Pr3+ ions populating the 3H
directly transit to the ground state in the form of MIR ASE, or be pumped to the 3H
6 level by
absorbing the 4.1 μm photons and then transit to the ground state in the form of NIR ASE. Hence, in the counter-pumping scheme with a longer active fiber, the 4.1 μm pump power are likely to be converted to the MIR ASE and the NIR ASE instead of the signal amplification. In contrast to counter-pumping, in a 4.1 μm co-pumping scheme with a 4.53 μm signal laser, the signal laser and pump laser are launched together at the front end of the active fiber and propagate in the same direction simultaneously. Thus, the initial pump power and the signal power are both strong at the same time; this enables the 4.53 μm signal laser to experience gain from the 4.1 μm pump power along the active fiber. In this case, most of the Pr3+ ions excited
to the 3H
5 level could transit to the ground state via amplification of the signal laser and the
ESA process will be almost blocked. It should be noted that for the situation shown in Fig.
11(f), although a part of the 4.1 μm pump power converts to the backward ASE power in the
front section of the active fiber, this backward ASE could also depopulate the Pr3+ ions in the 3H
5 level to the ground state, mainly in the form of the MIR ASE rather than NIR ASE, as
shown in Fig. 11(c). Therefore, it is suggested that the NIR ASE due to the ESA process is still very weak in the co-pumping scheme with longer active fiber.
For the situation of a 4.82 μm signal laser under a 4.1 μm counter-pumping scheme, the signal laser is distinctly amplified in three different active fiber lengths, as shown in Fig. 17(a)-17(c). Meanwhile, the signal power is always higher than the forward ASE power along the active fiber, as shown in Fig. 17(d)-17(f). This is because the reabsorption of the 4.82 μm signal laser is so weak along all the fiber length, so that the signal power is strong enough to experience gain from the pump power in the rear section of the active fiber. Consequently, the 4.1 μm pump power will be mainly converted to the 4.82 μm signal amplification rather than to both NIR and MIR ASE. It is suggested that the weak reabsorption of the 4.82 μm signal laser could
benefit ASE suppression compared to a 4.53 μm signal laser. Both NIR and MIR ASE peak
[image:17.612.122.493.395.591.2]powers are at least 30 dB lower than the signal peak, as shown in cases of Fig. 17(a)-17(c).
Fig. 17. For a 4.1 μm counter-pumped Pr3+-doped chalcogenide-selenide fiber amplifier seeded
with a 4.82 μm signal laser: Output spectra (red curves) and backward ASE spectra (blue dashed curves) for a: (a) 2.2 m long active fiber, (b) 3 m long active and (c) 4 m long active fiber. Power distributions of pump (blue curves), signal (red curves), forward (green dashed curves) and backward ASE (purple dashed curves) for a: (d) 2.2 m long active fiber, (e) 3 m long active fiber and (f) 4 m long active fiber. Note that the power distributions for 2.2 m and 3 m long fibers are respectively presented on a log. scale to distinguish the curves.
To further compare the co- and counter-pumping schemes, Fig. 18(a) plots the dependency of
maximum achievable power conversion efficiency (PCE) of the 4.1 μm resonantly pumped
Pr3+-doped chalcogenide-selenide fiber amplifier with the signal wavelength. For the
co-pumping scheme, the maximum achievable PCE varies from 66.8 % down to 54 % for signal
wavelengths increasing from 4.5 μm to 5.3 μm. The maximum achievable PCE is from 72.3 %
to 62.8 % over the same signal wavelength range for the counter-pumping scheme. Both the maximum achievable PCEs of the co- and counter-pumping schemes are much higher than those simulated in previously designed optical set-ups for Pr3+-doped chalcogenide fiber lasers
or amplifiers [29-31]. Furthermore, the dependency of the maximum achievable PCE for the
[image:18.612.148.464.255.377.2]4.82 μm signal laser with different background loss of the fiber in the 4.1 μm counter-pumping scheme is shown in Fig. 18(b). It can be seen that increasing the background loss will greatly reduce the maximum achievable PCE. The background loss should less than 3.43 dB/m to maintain the PCE higher than 50 %.
Fig. 18. The dependency of maximum achievable PCE of the 4.1 μm resonantly pumped Pr3+ -doped chalcogenide-selenide fiber amplifier with: (a) signal wavelength, varied between 4.5 μm
to 5.3 μm for the co- and counter-pumping scheme. (b) Background loss for the counter-pumping scheme with a 4.82 μm signal laser.
It is clearly seen in Fig. 18(a) that, no matter whether using a co- or counter- pumping scheme, the maximum achievable PCE decreases as the signal wavelength increases beyond
4.8 μm. This is because the quantum defect between the 4.1 μm pump laser and the signal laser
has increased as well. Hence, 4.1 μm may not be the optimal pump wavelength for applications
requiring longer MIR wavelengths. In order to improve further the PCE, the pump wavelength can be shifted to 4.5 μm at the upper limit of the available pump wavelengths discussed in
Section 4.1. Then, the output signal power at wavelengths varying from 4.6 μm to 5.3μm and
at fiber lengths varying from 0.5 m to 5 m is presented in Fig. 19(a). Figure 19(b) shows the maximum achievable PCE of a 4.5 μm counter-pumped Pr3+-doped chalcogenide-selenide fiber
amplifier. The counter-pumping scheme is presented since it provides higher PCE than the equivalent co-pumping scheme. All the other parameters used in the simulation were the same as those used earlier in Section 4.3.
The simulated output power evolution with different active fiber lengths and signal wavelengths for a 4.5 μm counter-pumped Pr3+-doped chalcogenide fiber amplifier is shown in
Fig. 19(a). It can be seen that high output power is achieved when the signal wavelength is
above 4.8 μm. The maximum output power observed is 7.84 W, at each of the signal
wavelengths of 4.82 μm and 5.01 μm, respectively. However, from Fig. 19(a), the output power
for signal wavelengths below 4.8 μm is observed to be much lower than those for signal wavelengths above 4.8 μm. The reason for the poor amplification of the signal laser when the wavelength below is 4.8 μm is the reabsorption of the signal laser, which is similar to the situation presented in Fig. 16. It is noted by comparing Fig. 18(a) and Fig. 19(b) that the
maximum achievable PCE for a 4.5 μm counter-pumping scheme is higher than that for a 4.1
19(b), the maximum achievable PCE is from 77% down to 62 % for signal wavelengths ranging
from 4.8 μm to 5.4 μm for 4.5 μm counter-pumping; however, the maximum achievable PCE quickly decreased below 60 % when the signal wavelength was less than 4.8 μm, which is also consistent with the results shown in Fig. 19(a). Nevertheless, a 4.5 μm resonantly counter
-pumped Pr3+-doped chalcogenide fiber amplifier potentially achieves more efficient
amplification for signal wavelengths longer than 4.8 μm than a 4.1 μm resonantly counter -pumped scheme.
Fig. 19. For a 4.5 μm counter-pumped Pr3+-doped chalcogenide-selenide fiber amplifier: (a) output signal power evolution, at a signal wavelength within the range 4.6 μm to 5.3μm and fiber length from 0.5 m to 5 m. (b) Maximum achievable PCE evolution.
6. Conclusions
In this paper, a model for a 4.1 μm resonantly pumped Pr3+-doped chalcogenide fiber amplifier
with signal wavelengths varying from 4.5 μm to 5.3 μm was demonstrated. In this model, the
ESA and the full spectral ASE spanning from 2.0 μm to 6 μm, covering NIR and MIR ASE
regions, were considered. The model used true absorption cross sections of Pr3+-doped
chalcogenide-selenide fiber; these were the experimentally measured absorption cross sections with the underlying extrinsic vibrational absorption due to H-Se numerically removed. In the model, 1 dB/m attenuation was assumed across the whole fiber active wavelength region; however this still has not been achieved in practice owing to the unwanted extrinsic hydride loss in experimental fiber. Both NIR and MIR PL were experimentally observed from the Pr3+
-doped chalcogenide-selenide fiber, and were explained within this model. In the simulation, both co- and counter- pumping schemes were considered and systematically investigated. Similar evolutions of NIR and MIR ASE effects were found in the two opposing pumping
schemes. When the signal laser wavelength was below 4.8 μm, further output power scaling
was greatly limited by MIR ASE effects; this was due to re-absorption of the signal laser. In
contrast, when the signal wavelength was above 4.8 μm, both NIR and MIR ASE effects could
be suppressed due to a lowered re-absorption of the signal laser, which resulted in an enhanced output signal power. Furthermore, the modeling results showed that over 62.8 % PCE can be realized by a 4.1 μm counter-pumping Pr3+-doped chalcogenide-selenide fiber amplifier with
signal wavelengths ranging from 4.5 μm to 5.3 μm. To our best knowledge, this is the highest simulated PCE for a Pr3+-doped chalcogenide fiber amplifier.
Acknowledgments
[image:19.612.148.466.183.306.2]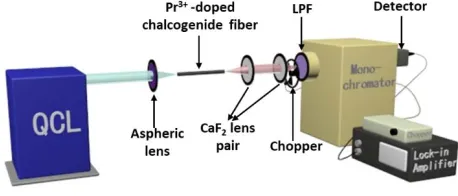

![Fig. 8. Cross sections of the ESA (σ(a23), GSA (σa12), emission from the 3H5→3H4 transition σe21) in the Pr3+-doped chalcogenide-selenide fiber [31]](https://thumb-us.123doks.com/thumbv2/123dok_us/8561982.365930/10.612.209.403.593.660/cross-sections-emission-transition-doped-chalcogenide-selenide-fiber.webp)