Reducing Annotation Efforts in Supervised Short Answer Scoring
Torsten Zesch Language Technology Lab University of Duisburg-Essen
Michael Heilman∗ Aoife Cahill Educational Testing Service
660 Rosedale Rd Princeton, NJ 08541, USA
Abstract
Automated short answer scoring is increas-ingly used to give students timely feedback about their learning progress. Building scor-ing models comes with high costs, as state-of-the-art methods using supervised learning require large amounts of hand-annotated data. We analyze the potential of recently proposed methods for semi-supervised learning based on clustering. We find that all examined meth-ods (centroids, all clusters, selected pure clus-ters) are mainly effective for very short an-swers and do not generalize well to several-sentence responses.
1 Introduction
Automated short answer scoring is getting more and more important, e.g. in the context of large-scale as-sessment in MOOCs or PISA (OECD, 2010). The state of the art is currently to use supervised systems that are trained for a certain assessment item using manually annotated student responses. For high-stakes assessments like PISA, the effort that goes into manually scoring a large number of responses in order to train a good model might be justified, but it becomes a large obstacle in settings where new items need to be generated more frequently, like in MOOCs. Thus, in this paper we explore ways to reduce the number of annotated training instances required to train a model for a new item.
In the traditional setting, human annotators score responses until a certain total or score distribution is reached that is deemed sufficient to train the model.
∗Michael Heilman is now a Data Scientist at Civis Analyt-ics.
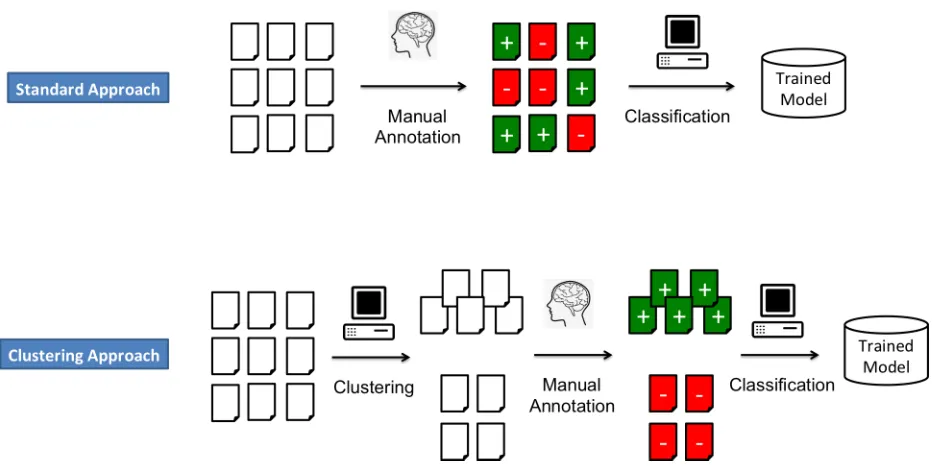
As long as responses are randomly chosen for man-ual scoring, it is inevitable that annotators will see a lot of similar answers that will not add much new knowledge to the trained model. Another drawback is that the class distribution in the data is often highly skewed (e.g. because there are only very few excel-lent answers). Thus, the number of responses that need to be manually scored is much higher than it perhaps needs to be. It should be possible to replace the random selection of responses to be annotated with a more informed approach. In this paper, we explore two approaches: (i) annotating single se-lected instances, and (ii) annotating whole answer clusters. The difference between the two approaches is visualized in Figure 1.
In the first approach, we try to maximize lexical diversity based on the assumption that the classifier is best informed by responses that are as different as possible (i.e. in the words used). In the second ap-proach, we simulate letting annotators score whole clusters with a label that is used for all instances in this cluster. The main advantage of this method is that it yields multiple training instances with just one decision from the annotator. At the same time, judg-ing whole clusters – especially if they are large – is more difficult than judging a single response, so we need to take this into consideration when comparing the results.
2 Related Work
Basu et al. (2013) describe a related study on Power-grading, an approach for computer-assisted scoring of short-answer questions. They carry out experi-ments using crowd-sourced responses to questions from the US citizenship test. The end goal of that
Figure 1: Comparison of the classical supervised approach with clustering approach where a subset of instances is selected for manual annotation.
work is the clustering itself, which they argue is use-ful for the teacher to understand the misconceptions of the students, while for us it is only an intermediate step towards a trained model for complete automatic scoring of responses. Another major difference be-tween our work and theirs is that we cluster the same feature space that is also used for supervised clas-sification (in order to ensure direct comparability), while Basu et al. (2013) use a pairwise similarity-based space.
The work closest to ours is Horbach et al. (2014) who investigate approaches for selecting the opti-mum response from within a cluster of responses for a human to score in order to train automated scor-ing models. They propagate the human score for this optimum response to the rest of the cluster and use this to train an automated scoring system. In experiments on 1,668 very short German responses, they show that a scoring accuracy of over 85% can be achieved by only annotating 40% of the training data. It is unclear what the distribution of scores is in this dataset, and since they only report accu-racy and do not report agreement measures such as quadratic weighted kappa, we cannot easily interpret the changes in performance between models.
Basu et al. (2013) and Horbach et al. (2014) both use datasets with very short responses. As we will
show later, shorter responses are easier to cluster and it is unclear whether these techniques generalize to several-sentence responses.
While we only focus on the side of the training data, it is also possible to change the learning pro-cess itself. Lewis and Gale (1994) introduce un-certainty sampling, a form of active learning where a classifier is trained on a small annotated sample and the classifier then finds examples where it is un-certain, which are then also labeled by the teacher. Ienco et al. (2013) combine active learning and clus-tering to avoid sampling bias which is especially im-portant for streaming data, i.e. when not all answers are available at the beginning. Those first answer might have a strong bias towards a certain outcome class, e.g. better grades because the unmotivated stu-dents wait until the last minute to submit. However, this is less of a problem in standardized testing when all students take the test at the same time.
# items # classes ∅# responses ∅# tokens type/token ratio ASAP 10 3-4 1,704 (±157) 48 (±12) .040 (±.016)
PG 10 2 486 (±157) 4 (±2) .100 (±.005)
Table 1: Overview of datasets
3 Experimental Setup
In this section, we describe the datasets used for evaluation as well as the principal setup of our su-pervised scoring system.
3.1 Evaluation Datasets
We use two publicly available datasets. Table 1 gives an overview of their properties.
Automated Student Assessment Prize (ASAP)
This dataset was used to run the 2012 short answer scoring competition. See Higgins et al. (2014) for a good overview of the challenge and the results. The dataset contains 10 items with approximately 20,000 graded student answers. All responses were written by students primarily in grade 10 and mostly consist of multiple sentences. The responses were graded on a 0-2 or 0-3 scale (i.e. 3–4 classes).
Powergrading (PG) The dataset was created by Basu et al. (2013) and contains about 5,000 crowd-sourced responses to 10 questions from the US citi-zenship test.1 As can be quickly seen from Table 1,
the responses in this dataset are rather short with on average 4 tokens. Looking into the data, it quickly becomes clear that there is relatively little variance in the answers. We thus expect clustering to work rather well on this dataset.
We are not aware of any supervised systems using the PG dataset before. In order to have a point of ref-erence for the performance of the automatic scoring, we computed an average pairwise inter-annotator-agreement of .86 (quadratic weighted kappa) for the three human annotators.
3.2 Scoring System
In order to allow for a fair comparison of all ap-proaches, we implement a basic short answer scor-ing system usscor-ing the DKPro TC (Daxenberger et al.,
1In all our experiments, we excluded item #13 as it has mul-tiple correct answers and is thus an anomaly amongst all the other items.
2014) framework. We preprocess the answers using the ClearNLP tools2 (segmenter, POS-tagger,
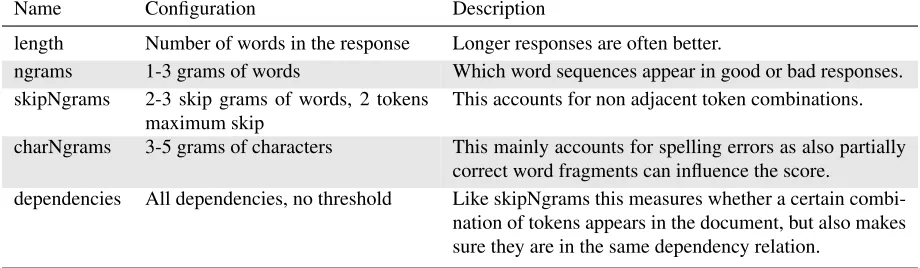
lem-matizer, and dependency parser). As we are not in-terested in tuning every last bit of performance, we use a standard feature set (length, ngrams, depen-dencies) described in more detail in Table 2. We use the DKPro TC wrapper for Weka and apply the SMO learning algorithm in standard configuration.
3.3 Evaluation Metric
We use the evaluation metric that was also used in the ASAP challenge: quadratic weighted kappaκ. We follow the ASAP challenge procedure by apply-ing Fisher-Z transformation when averagapply-ing kappas. According to Bridgeman (2013), quadratic weighted kappa is very similar to Pearson correlationrin such a setting.
4 Baseline Results
Applying our basic scoring system and using all available training data, we get a kappa of .67 for the ASAP dataset and .96 for the PG dataset. The extraordinaryly high result on the PG dataset (even much higher than the inter-annotator agreement) im-mediately stands out. As we have already discussed above, the answers in the PG dataset are very short and show very limited lexical variance making it quite easy to learn a good model.
Our results on the ASAP dataset are about 10 per-centage points lower than the best results from the literature (Higgins et al., 2014). This is due to our feature set and classifier not being tuned directly on this dataset. The results are in line with what similar systems achieved in the original competition. Re-sults closer to the best reRe-sults in the literature can be reached by using more specialized features (Tan-dalla, 2012) or by ensembling multiple scoring mod-els (Zbontar, 2012).
With our system, we get quite consistent results on all ASAP items, while attempts to tune the
Name Configuration Description
length Number of words in the response Longer responses are often better.
ngrams 1-3 grams of words Which word sequences appear in good or bad responses. skipNgrams 2-3 skip grams of words, 2 tokens
maximum skip This accounts for non adjacent token combinations. charNgrams 3-5 grams of characters This mainly accounts for spelling errors as also partially
correct word fragments can influence the score.
[image:4.612.76.536.60.194.2]dependencies All dependencies, no threshold Like skipNgrams this measures whether a certain combi-nation of tokens appears in the document, but also makes sure they are in the same dependency relation.
Table 2: List of features
tem on a certain item led to decreased performance on the others. For our experiments consistency is more important than especially good baseline re-sults, and so we choose to run the same system on all ten items rather than developing ten separate sys-tems that require individual tuning.
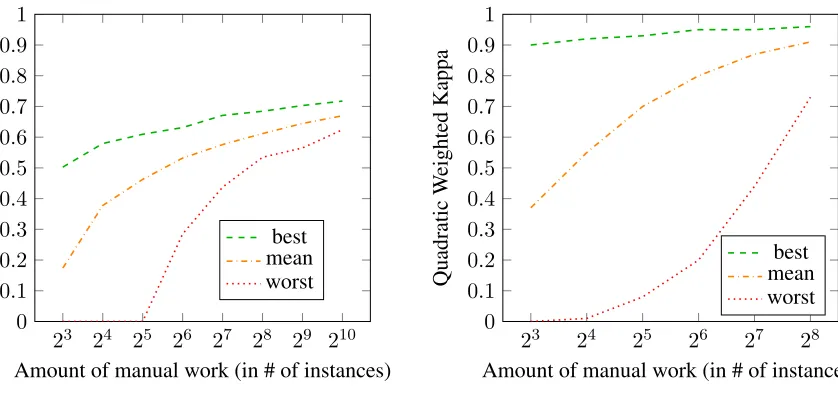
Impact of Training Data Size The main question that we are exploring in this paper is whether some answers are more valuable for training than others (Lewis and Gale, 1994; Horbach et al., 2014). By carefully selecting the training instances, we should be able to train a model with performance compara-ble to the full model that uses less training data and thus is cheaper to create. In order to assess the po-tential of this approach, it will be useful to compare against the upper and lower bound in performance. For this purpose, we need to find the best and worst subset of graded answers. As the number of possi-ble combinations ofk instances from nanswers is much too high to search in its entirety, we test 1,000 random samples while making sure that all outcome classes are found in the sample. In Figure 2, we show the performance of the best and worst subset, as well as the mean over all subsets. In order to avoid clutter, we show averaged curves over all items in a dataset.
Looking at the ASAP dataset first, we see that in the average case doubling the amount of training data yields a steady performance increase, but with diminishing returns. Using about 100 (27) answers
means sacrificing more than 10 percentage points of performance compared with using about 1,000 (210)
answers. However, it should be noted that in an av-erage practical setting annotating 1,000 answers is
next to impossible and 100 still means a consider-able effort even if one is willing to live with the sub-optimal performance.
For the PG dataset, the pattern is similar in the average case, but we need more training examples in the worst case to get up and running, while the ASAP worst case has a much steeper climb.
We see that the selection of instances actually has an enormous effect for both datasets. Especially for small numbers of training instances, depending on how lucky or unlucky we are in picking instances to score, we might end up with performance near zero, or performance very close to what we can ex-pect when training on all instances. When insex-pecting the selected subsets it becomes clear that one crucial factor is the lexical variance that we see in instances. We explore this in more detail in the next section.
5 Selecting Answers for Annotation
The idea behind this approach is that given a limited amount of training instances, we should only anno-tate answers that inform the machine learner in an optimal way. Our hypothesis is that the learning al-gorithm should gain more from a lexically diverse sample than from a sample of very similar answers. For example, if we have already scored an answer like Edison invented the light bulb, rating another very similar one like The light bulb was invented by Edison adds little additional information to the model.
23 24 25 26 27 28 29 210 0
0.1 0.2 0.3 0.4 0.5 0.6 0.7 0.8 0.9 1
Amount of manual work (in # of instances)
Quadratic
W
eighted
Kappa
best mean worst
(a) ASAP dataset
23 24 25 26 27 28 0
0.1 0.2 0.3 0.4 0.5 0.6 0.7 0.8 0.9 1
Amount of manual work (in # of instances)
Quadratic
W
eighted
Kappa
best mean worst
[image:5.612.100.519.55.256.2](b) PG dataset
Figure 2: Learning curves for the supervised approach. Best and worst lines indicate the range of potential for selecting good/bad subsamples for training.
desired number of instances we want to annotate. As k-means might result in ‘virtual’ centroids that do not correspond to any real instance, we deter-mine the instance that is closest to the centroid. In a practical setting, this selected instance would now be presented to a teacher to be scored. In our setting, we simulate this step by using data that was already scored before. (Note that we do not use the score during clustering so that a cluster might contain an-swers with different scores.) The classifier is then trained using the selected instances.
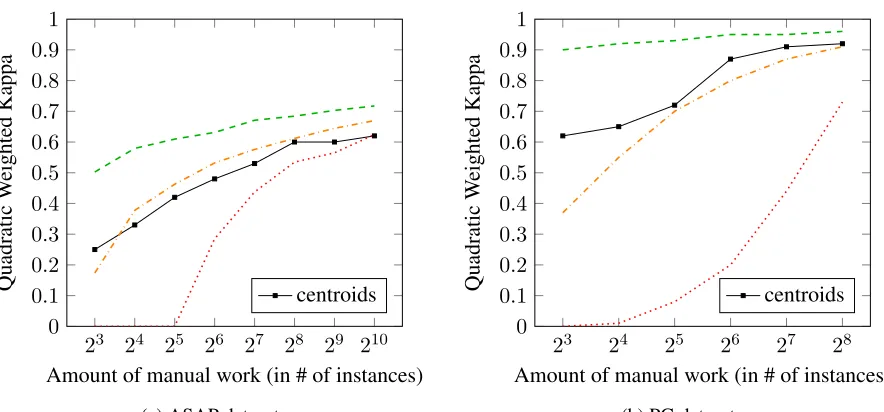
Results Figure 3 shows the resulting performance when using only the centroids for training. We also show the corresponding learning curves from Fig-ure 2 for comparison.
For the ASAP dataset, results are very close to the average performance, but most of the time slightly worse. For the PG dataset, results are slightly above average with the highest gains for the small-est amount of training data. In both cases, the cen-troids are obviously not the instances that maximize the performance, as there is quite some room for im-provement to reach the best performance.
However, we believe that the result is more impor-tant than it might seem, as the average case against which we are comparing here is only a statistical observation. When selecting a subset of instances
for manual annotation, we might be lucky and get even better performance than compared with all in-stances, or we might be very unlucky and get a model that does not generalize at all. Using cen-troids, we can at least be sure of getting a reasonable minimum performance even if it does not reach the model’s full potential.
A disadvantage of maximizing lexical diversity is that similar but contradicting answers likeThe solu-tion is AandThe solution is not Awill be in the same cluster and the difference cannot be learned. This implies a need for better features so that the cluster-ing can get better at distcluster-inguishcluster-ing those cases.
In the next section, we explore whether using the whole clusters might get us closer to the optimal per-formance as was proposed in previous work. 6 Annotating Whole Clusters
In this section, we explore whether we can take the clustering idea one step further. We explore how we can make use of the whole clusters, not just the cen-troids.
6.1 Using all clusters
[image:5.612.316.524.55.233.2]23 24 25 26 27 28 29 210 0
0.1 0.2 0.3 0.4 0.5 0.6 0.7 0.8 0.9 1
Amount of manual work (in # of instances)
Quadratic
W
eighted
Kappa
centroids
(a) ASAP dataset
23 24 25 26 27 28 0
0.1 0.2 0.3 0.4 0.5 0.6 0.7 0.8 0.9 1
Amount of manual work (in # of instances)
Quadratic
W
eighted
Kappa
centroids
[image:6.612.84.526.88.294.2](b) PG dataset
Figure 3: Results for training only on answers selected using cluster centroids. Learning curves from Figure 2 are shown for comparison.
23 24 25 26 27 28 29 210 0
0.1 0.2 0.3 0.4 0.5 0.6 0.7 0.8 0.9 1
Amount of manual work (in # of instances)
Quadratic
W
eighted
Kappa
all pure
(a) ASAP dataset
23 24 25 26 27 28 0
0.1 0.2 0.3 0.4 0.5 0.6 0.7 0.8 0.9 1
Amount of manual work (in # of instances)
Quadratic
W
eighted
Kappa
all pure
[image:6.612.318.523.420.593.2](b) PG dataset
Figure 4: Results for projecting centroid score to whole clusters(all) and when selecting pure clusters
costs. However, this might obviously also result in a large training error if the clusters are not pure, as we would assign incorrect labels to some instances in that case.
Following Horbach et al. (2014), we use the score assigned to the centroid for the whole cluster and obtain the results shown in Figure 4. For the ASAP dataset, the curve is almost flat, i.e. no matter how many cluster centroids the teacher annotates, predic-tion results do not improve. The results even dip be-low the ‘worst’ line which can be explained by the fact that we are using a lot of noisy training data in this case instead of fewer correct instances. For the PG dataset, results are better due to the much eas-ier clustering. In this case, we can get a significant performance increase compared to just using cen-troids especially for smaller amounts of annotated instances.
As we are always clustering the whole set of an-swers, selecting a small number of clusters and at the same time asking for noise-free clusters is equivalent to finding a perfect solution for the scoring prob-lem. For example, if we have 4 scores (0,1,2,3) and 4 clusters, than the clusters can only be pure if all the answers for each score are in their own cluster. This is unlikely to happen. If the number of clusters grows, we expect to have some smaller, purer clus-ters where similar answers are grouped together, and some larger clusters with a lot of noise.3 We thus
need to find a way to minimize the impact of noise in our training data.
6.2 Using only pure clusters
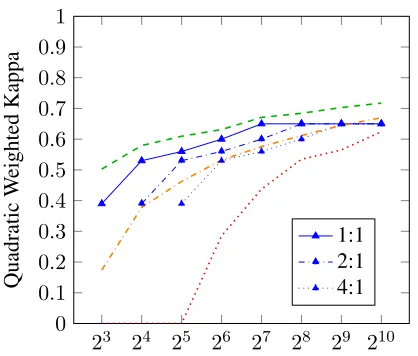
One possible approach to reduce noise in the clus-tered data would be to have the teacher look at the whole clusters instead of individual answers only. The teacher would then select only those clusters that are relatively pure, i.e. only contain answers cor-responding to the same score. We simulate this step by computing the purity of each cluster using the already known scores for each answer. The solid line in Figure 4 shows the result for this scenario. We see that for both datasets, the results are sig-nificantly above average, getting close to the opti-mal performance. We believe that this is due to
3Note that, if we ask for as many clusters as there are an-swers in the set, each answer gets its own cluster and we get the baseline results.
23 24 25 26 27 28 29 210 0
0.1 0.2 0.3 0.4 0.5 0.6 0.7 0.8 0.9 1
Amount of manual work (in # of instances)
Quadratic
W
eighted
Kappa
[image:7.612.315.524.54.232.2]1:1 2:1 4:1
Figure 5: Results annotating pure clusters for differ-ent ‘exchange rates’, where 1:1 means that annotat-ing a cluster and a sannotat-ingle answer takes the same time, 2:1 a cluster takes twice as long as a single answer, etc.
the pure clusters representing frequent correct an-swers or frequent misconceptions shared between students, while impure clusters represent noisy an-swers that lead to overfitting in the learned model.
thus conclude that the effectiveness of this method strongly depends on how well the answers can be clustered. This in turn depends on both the nature of the answers and the quality of the feature space (or similarity function for graph clustering). As we are using the same feature set for both datasets, the good results on PG can only be explained with the rather short answers and the low lexical variance. How-ever, a better baseline model of answer similarity might also push results on the ASAP dataset more towards the optimal result.
7 Conclusions
In this paper, we explored approaches for minimiz-ing the required amount of annotated instances when training supervised short answer scoring systems. Instead of letting a teacher annotate all instances in advance, we argue that by carefully selecting the instances we might be able to train a comparable model at much lower costs. We do this by cluster-ing the answers and havcluster-ing the teacher only annotate the cluster centroids. We find that – especially for small amounts of instances to be annotated – using centroids yields results comparable to the average random selection of the same number of instances. This means that centroids provide a convenient way to select suitable instances for annotation instead of random selection, but only if one is comfortable with significantly sacrificing scoring quality.
In a second experiment, we follow Horbach et al. (2014) projecting the score assigned to the centroid to the whole cluster. Especially for longer answers that doesn’t work well due to the noise introduced by imperfect clustering. Having the teacher select and annotate only pure clusters counters the noise problem, but introduces quite high annotation costs that probably negate any gains.
To summarize: the results indicate that clustering has limited potential for reducing the annotation ef-fort if the answers are short enough to be partitioned well, but is not well suited for longer answers. It remains an open question whether better clustering based on a deeper understanding of multiple sen-tence answers could change that picture. We make the full source code publicly available so that our experiments can be easily replicated.4
4https://github.com/zesch/exp-grading-bea2015
Acknowledgements
We thank Nitin Madnani for helpful discussions. We also thank Keelan Evanini, Matthew Mulholland and the anonymous reviewers for thoughtful comments and suggestions.
References
Sumit Basu, Chuck Jacobs, and Lucy Vanderwende. 2013. Powergrading: a Clustering Approach to Am-plify Human Effort for Short Answer Grading. Trans-actions of the Association for Computational Linguis-tics (TACL), 1:391–402.
Brent Bridgeman. 2013. Human Ratings and Auto-mated Essay Evaluation. In Mark D Shermis and Jill Burstein, editors, Handbook of Automated Essay Evaluation: Current Applications and New Directions, chapter 13, pages 221–232. Routledge, New York. Johannes Daxenberger, Oliver Ferschke, Iryna Gurevych,
and Torsten Zesch. 2014. DKPro TC: A Java-based Framework for Supervised Learning Experiments on Textual Data. In Proceedings of the 52nd Annual Meeting of the Association for Computational Linguis-tics. System Demonstrations, pages 61–66, Baltimore, MD, USA, June.
Derrick Higgins, Chris Brew, Michael Heilman, Ramon Ziai, Lei Chen, Aoife Cahill, Michael Flor, Nitin Madnani, Joel R Tetreault, Daniel Blanchard, Diane Napolitano, Chong Min Lee, and John Blackmore. 2014. Is getting the right answer just about choosing the right words? The role of syntactically-informed features in short answer scoring. Computation and Language.
Andrea Horbach, Alexis Palmer, and Magdalena Wol-ska. 2014. Finding a Tradeoff between Accuracy and Rater’s Workload in Grading Clustered Short An-swers. In Proceedings of the Ninth International Conference on Language Resources and Evaluation (LREC’14), pages 588–595, Reykjavik.
Dino Ienco, Albert Bifet, Indre Zliobaite, and Bernhard Pfahringer. 2013. Clustering based active learning for evolving data streams. In Proceedings of Discovery Science - 16th International Conference, pages 79–93. Chinmay E. Kulkarni, Richard Socher, Michael S. Bern-stein, and Scott R. Klemmer. 2014. Scaling short-answer grading by combining peer assessment with al-gorithmic scoring. In Proceedings of the first ACM conference on Learning @ scale conference - L@S ’14, pages 99–108. ACM Press.
of the 17th Annual International ACM SIGIR Confer-ence on Research and Development in Information Re-trieval, SIGIR ’94, pages 3–12.
OECD. 2010. PISA 2009 Assessment Framework: Key Competencies in Reading, Mathematics and Science. PISA, OECD Publishing.
Luis Tandalla. 2012. Scoring short answer es-says. Technical report, ASAP Short Answer Scoring Competition System Description. Downloaded from http://kaggle.com/asap-sas/.