Syllable and language model based features for detecting non-scorable
tests in spoken language proficiency assessment applications
Angeliki Metallinou, Jian Cheng
Knowledge Technologies, Pearson
4040 Campbell Ave., Menlo Park, California 94025, USA
[email protected] [email protected]
Abstract
This work introduces new methods for de-tecting non-scorable tests, i.e., tests that cannot be accurately scored automatically, in educational applications of spoken lan-guage proficiency assessment. Those in-clude cases of unreliable automatic speech recognition (ASR), often because of noisy, off-topic, foreign or unintelligible speech. We examine features that estimate signal-derived syllable information and compare it with ASR results in order to detect responses with problematic recognition. Further, we explore the usefulness of guage model based features, both for lan-guage models that are highly constrained to the spoken task, and for task inde-pendent phoneme language models. We validate our methods on a challenging dataset of young English language learn-ers (ELLs) interacting with an automatic spoken assessment system. Our proposed methods achieve comparable performance compared to existing non-scorable detec-tion approaches, and lead to a 21% rela-tive performance increase when combined with existing approaches.
1 Introduction
Automatic language assessment systems are be-coming a valuable tool in education, and provide efficient and consistent student assessment that can complement teacher assessment. Recently, there has been a great increase of English Lan-guage Learners (ELLs) in US education (Pear-son, 2006). ELLs are students coming from non-English speaking backgrounds, and often require additional teacher attention. Thus, assessing ELL student language proficiency is a key issue.
Pearson has developed an automatic spoken as-sessment system for K-12 students and collected
a large dataset of ELL students interacting with the system. This is a challenging dataset, con-taining accented speech and speech from young students. Thus, for a small percentage of tests, it is technically challenging to compute an accurate automatic score, often because of background/line noise, off-topic or non-English responses or un-intelligible speech. Such tests as referred to as non-scorable. Here, our goal is to propose new methods for better classifying non-scorable tests and describe a system for non-scorable detection.
We propose two new sets of features: sylla-ble based and language model (LM) based. The intuition is to contrast information from differ-ent sources when processing a test, in order to detect inconsistencies in automatic speech recog-nition (ASR), that often appear in non-scorable tests. Syllable features measure similarity be-tween different estimates of syllable locations, one extracted from ASR and the second from the raw signal. LM features measure similarity between two ASR results, one using a standard item spe-cific word LM, and the second using a item inde-pendent phoneme LM. Finally, an additional set of ASR confidence scores and log-likelihoods is computed using the proposed phoneme LM.
Compared to existing work, our new methods achieve comparable performance, although they approach the problem from a different perspective. Furthermore, our proposed features carry comple-mentary information to existing ones, and lead to a 21% relative performance increase when com-bined with existing work.
2 Related Work
A review of spoken language technologies for ed-ucation can be found in Eskanazi (2009). There is a considerable amount of previous work on automatic speech assessment. Pearson’s auto-mated speech scoring technologies that measure the candidates’ speaking skill (pronunciation,
ency, content) have been used in the Versant series tests: English, Aviation English, Junior English, Spanish, Arabic, French, Dutch, Chinese (Bern-stein et al., 2000; Bern(Bern-stein and Cheng, 2007; Cheng et al., 2009; Bernstein et al., 2010; Xu et al., 2012), and Pearson Test of English Academic (Pearson, 2011). A non-scorable detection com-ponent (Cheng and Shen, 2011) is usually required for such systems. Educational Testing Service de-scribed a three-stage system on spoken language proficiency scoring, that rates open-ended speech and includes a non-scorable detection component (Higgins et al., 2011).
The system described here evaluates spoken En-glish skills of ELL students in manner and con-tent. Past work on children’s automatic assess-ment of oral reading fluency includes systems that score performance at the passage-level (Cheng and Shen, 2010; Downey et al., 2011) or word-level (Tepperman et al., 2007).
Regarding detecting problematic responses in speech assessment applications, related work in-cludes off-topic and non-scorable detection. Non-scorable detection is a more general problem which includes not only off-topic responses, but also noisy, poor quality, foreign or unintelligible responses, etc. Higgins et al. (2011) describe a system that uses linear regression and four infor-mative features (number of distinct words, average ASR confidence, average and standard deviation of speech energy) for filtering out non-scorable re-sponses. Yoon et al. (2011) use a set of 42 signal-derived and ASR features along with a decision tree classifier for non-scorable response detection. Many of their features are also extracted here for comparison purposes (see Section 7).
Chen and Mostow (2011) focus on off-topic detection for a reading tutor application. They use signal features (energy, spectrum, cepstrum and voice quality features) and ASR features (per-centage of off-topic words) with a Support Vector Machine (SVM) classifier. In our previous work (Cheng and Shen, 2011), we described an off-topic detection system, where we computed three vari-ations for ASR confidence scores, along with fea-tures derived from acoustic likelihood, language model likelihood, and garbage modeling. Linear regression was used for classification.
Here, we focus on non-scorable test detection, using aggregate information from multiple test re-sponses. We propose new similarity features that
are derived from syllable location estimation and the use of a item independent phoneme LM.
3 The ELL student dataset 3.1 The asessment system
Pearson has developed an English proficiency as-sessment test, which has been administered in a large number of K-12 ELL students in a U.S. state. The speaking component of the test is delivered via speakerphone, and the student performance is automatically scored. Each tests consists of a se-ries of spoken tasks which are developed by pro-fessional educators to elicit various displays of speaking ability. There are repeat tasks, where students repeat a short sentence, and open ended tasks, where students are required to answer ques-tions about an image or a topic, give instrucques-tions, ask a question about an image, etc. Each test contains multiple test prompts (also referred to as items), some of which may belong to the same task. For example, for the ‘question about image’ task, there may be items refering to different im-ages. Each test contains student responses to the items. Responses which are typically two or three sentences long.
Figure 1 summarizes the components of Pear-son’s automatic proficiency assessment system. Assessment is done through combination of ASR, speech and text processing, and machine learn-ing to capture the llearn-inguistic content, pronuncia-tion and fluency of the student’s responses. In this work, we focus on the lower block of Figure 1 that illustrates the non-scorable detection component, whose purpose is to detect the tests that cannot be reliably scored. It exploits signal related and ASR information to extract features that are later used by a binary classifier to decide whether a test is scorable or not. Our goal is to filter out non-scorable tests, to be graded by humans. The pro-ficiency assessment system (upper part of Figure 1) is described elsewhere (Cheng and Shen, 2010; Downey et al., 2011). The word error rate (WER) over the test set using the final acoustic models is around 35%.
3.2 The non-scorable tests
Figure 1: Outline of the assessment system. The lower block is the non-scorable test detection module, that is the focus of this work.
were used for testing. Professional human graders were recruited to provide a grade for each test response, following pre-defined rubrics per item. The grades per test are then summed up to com-pute an overall human grade in the range 0-14. Each test was double graded and the final human grade was computed by averaging. Our automatic scoring system was also used to estimate an over-all machine grade in the range 0-14 for each test, after considering all student responses.
We define a test as non-scorable when the over-all machine and human grades differ by more than 3 points. For our dataset of 6000 tests, only 308 (or approx. 5.1%) are non-scorable, according to this definition. Inspecting a subset of those tests, revealed various reasons that may cause a test to be non-scorable. Those include poor audio qual-ity (recording or background noise, volume too loud or too soft), excessive mouth noises and vo-calizations, foreign language, off-topic responses and unintelligible speech (extremely disfluent and mispronounced). As expected, the above issues are more common among younger test takers. Al-though the cases above can be very different, a commonality is that their ASR results are unreli-able, therefore making subsequent automatic scor-ing inaccurate. In the followscor-ing sections, we pro-pose new methods for detecting problematic ASR outputs and filtering out non-scorable tests.
4 Syllable based features
The intuition behind the syllable based features is to compare information coming from the ASR component with information that is derived di-rectly from the speech signal. If these two sources are inconsistent, this may indicate problems in the recognition output, which often results in non-scorable tests. Here, we focus on syllable loca-tions as the type of information to compare. Sylla-ble locations can be approximated as the vowel
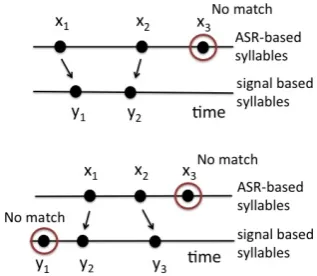
lo-Figure 2: Two examples of mapping between ASR-derived and signal-derived syllable loca-tions.
cations of the speech recognition output. Alterna-tively, they can be approximated using the speech pitch and intensity signals. By examining inten-sity, we may find intensity peaks that are preceded by intensity dips, and by examining pitch, we may select voiced intensity peaks as estimates of ble locations. This method for identifying sylla-bles was described by Jong and Wempe (2009), and the number of syllables has been used as a feature for non-scorable detection in Yoon et al. (2011). In this work, we propose to use the sylla-ble information in order to compute features that measure similarities between signal-derived and ASR-derived syllable locations.
Assume that we have a sequence of n ASR-derived syllable locations: X = {x1, x2, . . . , xn} and a sequence of m signal-derived locations:
Y = {y1, y2, . . . , ym}. The first step in com-puting similarity features is finding a mapping be-tween the two sequences. Specifically, we want to find an appropriate mapping that pairs points (xi, yj), xi ∈ X, yj ∈ Y such that the smallest possible distancesd(xi, yj) are preferred. Poten-tially inconsistent points can be discarded. Two examples are presented in Figure 2. In the up-per examplen > m, therefore some syllable lo-cations of the longer sequence will be discarded (here locationx3). In the lower example, although
n =m, the mapping that produces location pairs with the smallest distances is(x1, y2)and(x2, y3),
while locationsy1, x3 will be discarded. A
map-ping(x3, y1)would be invalid as it violates time
[image:3.595.76.298.56.139.2]distance. A mapping (xi, yj) is valid if no time constraints are violated, e.g., there is no previously selected mapping(xk, yl), wherek < i, l > j or
k > i, l < j.
The algorithm is described in Algorithm 1. Our implementation is recursive: after finding the loca-tions that define the best available mapping at each step, the algorithm is recursively called to search for mappings between points that are both either at the right subsequences, or at the left subsequences, with respect to the recent mapping. The right sub-sequences contain points on the right of the se-lected mapping (similarly for left subsequences). That way we avoid searching for mappings that would violate the time constraints.
Data: Syllable locationsX={x1, x2, . . . , xn}and
Y ={y1, y2, . . . , ym}
Result: Mapping between X and Y. Some locations in X or Y may be discarded
Compute pairwise distances:d(xi, yj), xi∈X, yj∈Y; Set of pairs:E=mapping(1, n,1, m);
function mapping(i, j, k, l) returns set of pairs ; ifi > jork > lthen
return empty set end
Findmin(d(xu, yv)),u∈[i, j], v∈[k, l];
Enow= (u, v); //check left subsequences
Eleft=mapping(i, u−1, k, v−1); //check right subsequences
Eright=mapping(u+ 1, j, v+ 1, l); returnunion(Eleft, Enow, Eright);
Algorithm 1:Compute mapping between
ASR-based and signal-ASR-based syllable locations
Based on the mapping of Algorithm 1, we es-timate a set similarity features including number of pairs found, number of syllables that were not paired, the absolute length difference between the two sequences, as well as normalized versions of these features (we normalize the features by divid-ing with the maximum sequence length). For ex-ample, in the lower part of Figure 2, there are two pairs and the longest sequence has length three, so the normalized number of pairs found is 2/3. Other features include average, min, max and stan-dard deviation of the distances of the pairs found, as well as the lengths of the two sequences. These features are a set of descriptions of the quality of the mapping or, in other words, of the similarity between the two syllable sequences.
Algorithm 1 follows a greedy approach, how-ever, one could derive a similar mapping using dy-namic programming (DP) to minimize the average distance over all selected pairs. In practice, we do
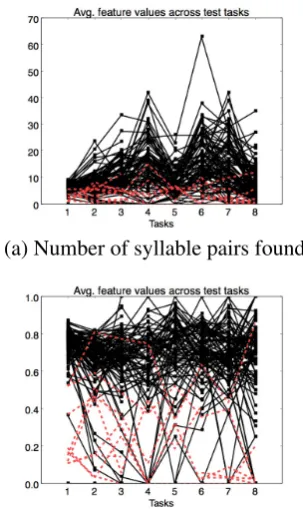
(a) Number of syllable pairs found.
[image:4.595.332.484.57.312.2](b) Number of pairs over length of largest sequence.
Figure 3: Visualization of feature values across tasks during a test, for sampled tests. Scorable tests are in black, non-scorable in dashed red lines. For tasks that contain multiple responses, we aver-age the feature values of the responses of a task.
not expect the choice of greedy or DP approach to greatly affect the final computed similarity fea-tures, and we chose the greedy approach for sim-plicity (although DP implementations could be ex-plored in the future).
vi-sualizes the normalized pairs found, and again this percentage is lower for non-scorable tests, indicat-ing that fewer pairs were found for those tests.
In our implementation, we computed the ASR-based syllable sequences by performing phoneme-level forced alignment of the ASR, and approxi-mating the syllable location as the center of each vowel segment of the force aligned result. We computed the signal-based syllable sequence by augmenting the open source Praat script developed by Jong and Wempe (2009) to output syllable lo-cations. The syllable locations are approximate: computing the syllable detection accuracy would require human annotation of syllables in our cor-pus, which is out of the scope of this work. Our focus is to estimate syllables well enough, so as to compute useful features. Based on Figures 3(a) and (b) and the results of Section 9, our syllable detection works sufficiently well for our purpose.
5 Language model based features
Language models (LMs) are used to model word transition probabilities in ASR systems, and are learnt using large text corpora. For cases where the input speech belongs to a specific topic, it is common to use constrained LMs, e.g., learn the word transitions from corpora related to the topic in question. Here we explore the idea of using dif-ferent LMs for our ASR system, either highly con-strained or unconcon-strained ones, and comparing the corresponding recognition results. If the ASR re-sults of the two LMs are very different, then it is likely that the ASR result is problematic, which may be indicative of a non-scorable test. To de-tect those cases, we introduce a set of features that measure the similarity between ASR results ob-tained using different language models.
In our system, each item requires the user to talk about a specific known topic. The default LM used by our ASR component is item dependent and is constrained on the topic of the item. In general, this is beneficial to our system as it allows the ASR to focus on words that have a high enough likeli-hood of appearing given the item topic. However, for some non-scorable tests, we noticed that this approach may result in misrecognizing phrases that are off-topic or non-English as valid on-topic phrases. Therefore, we introduce an unconstrained LM to detect cases where the constrained LM causes our system to misrecognize topic specific words that were not actually spoken. We create the
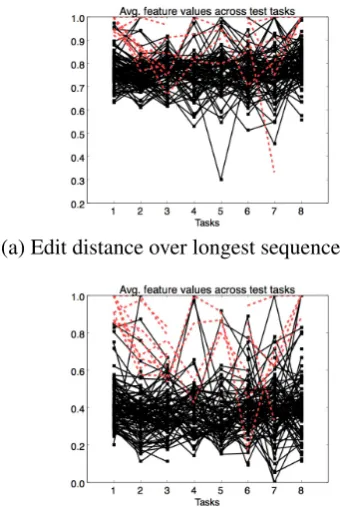
(a) Edit distance over longest sequence length.
[image:5.595.309.480.66.320.2](b) Length difference over longest sequence length.
Figure 4: Visualization of feature values across tasks during a test, for sampled tests. Scorable tests are in black, non-scorable in dashed red lines.
unconstrained LM independent of the vocabulary used, by training a phoneme bigram LM that mod-els phoneme transition probabilities. Hence, our LM can handle out of vocabulary or non-English words that often appear in non-scorable tests.
se-quence lengths as features.
Similarly to Section 4, we visualize feature in-formation by plotting feature values across tasks, for randomly sampled tests. The resulting plots for edit distance and length difference between se-quences, both normalized, are presented in Figures 4 (a) and (b) respectively. Scorable tests are in black and non-scorable in red dashed lines. Intu-itively, the more dissimilar the sequences from the two LMs are, the larger the features values will be for these two features. Looking at the plots, we notice that, as expected, non-scorable tests tend to have larger feature values compared to scorable ones. This indicates that the proposed phoneme LM can help detect cases of non-scorable tests.
6 Confidence features
The ASR component of the Pearson assessment system assigns confidence scores to the recog-nized words. Three variants of confidence scores are computed: mconf (based on normalized acous-tic scores), aconf (based on force alignment and phoneme recognition) and lconf (lattice-based). They are described in our previous work (Cheng and Shen, 2011), where they were used for off-topic detection. Here, we use them for non-scorable detection, and compute them separately using the ASR result obtained from either the item specific word LM or the item independent phoneme LM. For each confidence score, our fea-ture set includes the average score value over words of a response, and the maximum, mini-mum and standard deviation. We also compute the word-level recognition log-likelihood using each of the two LMs, and include as features the aver-age, minimum, maximum and standard deviation of these log-likelihoods over words of a response. Although the confidence scores are described in Cheng and Shen (2011), here we compute them using the proposed phoneme LM (in addition to the standard word LM), thus they are significantly different from prior work. Indeed, scores com-puted by the proposed phoneme LM prove to be highly informative (see Section 9, Table 3).
7 Signal derived and ASR features
A variety of signal-derived and ASR-based fea-tures have been used in the literature for non-scorable detection (Cheng and Shen, 2011; Yoon et al., 2011; Chen and Mostow, 2011), as well as related work on pronunciation and fluency
assess-ment (Bernstein et al., 2010; Higgins et al., 2011). In this study, we extract and include a set of com-mon features.
Signal-derived features typically describe prop-erties of the pitch and energy of the speech sig-nal. Our feature set includes maximum and mini-mum energy, number of nonzero pitch frames and average pitch. We also extract features that esti-mate noise level, specifically Signal to Noise Ra-tio (SNR). For SNR estimaRa-tion we used the NIST Speech Quality Assurance package (NIST, 2009)
Furthermore, we use features extracted from the ASR result, including utterance duration, number of words spoken, number of interword pauses, av-erage interword pause duration, avav-erage pause du-ration before the first spoken word (response la-tency), and number of hesitations. Pauses, hesi-tations and response latency have been found in-formative of speaking fluency (Bernstein et al., 2010), and could be indicative of problematic, non-scorable tests. We also compute two varia-tions of speech rate: words over total response duration and words over duration of speech (ex-cluding pauses). Other ASR features we use in-clude recognition log-likelihood, average LM like-lihood, number of phonemes pruned during recog-nition, and average word lattice confidence. We include some additional confidence-related fea-tures, like percentage of low confidence words or phonemes in the response (low confidence is de-fined based on an experimental threshold).
We compute ASR features that are specific to the task: either repeat or non-repeat. For the re-peat tasks, where the student is asked to rere-peat a prompt sentence, we compute the number of inser-tions, deletions and substitutions of the recognized response compared to the prompt, as well as the number and percentage of the recognized prompt words. For the open question (non-repeat) tasks, where the student gives an open ended response on a topic, we estimate the number of key words recognized in the response, from a set of prede-fined, topic key words.
that indicates when the number of non zero pitch frames exceeds a certain threshold but the ASR recognizes only silence. This is a rough way to detect inconsistencies between the ASR and the pitch signal, where pitch indicates the presence of voiced speech, but the ASR recognizes silence. Although these features are new, for simplicity, we merge them in our baseline feature set.
Overall, we have extracted a diverse and pow-erful set of representative features, which will be referred as ‘base’ feature set, and is summarized in Table 1.
Table 1: Summary of features included in the ‘Base’ feature set
description
signal max and min energy, nonzero pitch frames, avg. pitch, num-ber of clipped frames, SNR
ASR number of words spoken, pauses and hesitations, utteranceduration, speech rate (2 variations), avg. interword pause du-ration, leading pause duration.
ASR log-likelihood, average LM likelihood, number of phonemes pruned, average word lattice confidence, percent-age of low confidence words and phonemes
Repeat types: number of insertions, deletions, substitutions, number of recognized prompt words, percentage of recog-nized prompt words.
Non repeat types: number of recognized key words indicator indicator when number of zero pitch frames exceeds a
thresh-old while ASR recognizes silence
8 Random forest classification
We use a binary random forest classifier to decide if a test is scorable or not. A random forest is an ensemble of decision trees where each tree de-cides using a subset of the features and the final decision is computed by combining the tree deci-sions (Breiman, 2001). Random forests can take advantage of feature combinations to construct a complex, non-linear decision region in the feature space. In addition, they can be trained fast, have good generalization properties and do not require much parameter tuning, which makes them popu-lar classifiers in the machine learning literature. In our work, a variety of diverse reasons may cause a test to be non-scorable, including background or line/static noise, off-topic responses, non-English or unintelligible speech. Random forests combine a number of decision trees that could correspond to the different sub-cases of our problem, there-fore they seem well suited for non-scorable test detection. According to our experiments, random forests outperform decision trees and maximum entropy classifiers. Therefore, all results of Sec-tion 9 are based on random forest classificaSec-tion.
Up to now, we have described feature extraction
for each test response. The non-scorable detection system needs to aggregate multiple response in-formation to make an overall decision at the test level. We can combine response-level features in a straightforward manner by taking their average over a test. However, responses may belong to different types of tasks, either repeat or non repeat ones, and some of the features are task specific. Also, repeat task responses often resemble recited speech, while non-repeat ones tend to be more spontaneous. To preserve this information, we separately average features that belong to repeat responses and non-repeat responses of a test (two averaged features are extracted per test and per feature). There are cases where a feature cannot be extracted for a response, because it is undefined, i.e., for a response that is recognized as silence the average interword pause duration is undefined. Therefore, we also include the percentage of re-peat or non-rere-peat responses used to compute the average, i.e., two percentage features (for repeat and non-repeat cases) are extracted per test and per response. More statistics could be extracted when combining response features, e.g., variance, max and min values, and others. However, our pre-liminary experiments indicated that including just averages and corresponding percentages is suffi-cient, and adding more statistics greatly increases the feature vector size without significant perfor-mance gains. Therefore, our final feature set in-cludes only averages and percentages.
9 Experiments and results 9.1 Experimental setup
Our experiments are organized in 5-fold cross val-idation: we randomly split the 6000 tests into five sets, and each time we use three sets for training the random forest classifier, one set as a develop-ment for optimizing the number of trees, and one set for testing non-scorable classification perfor-mance. Performance is computed after merging all test set results. Because the percentage of non-scorable tests in our dataset is small (approx. 5%) and random forests are trained with a degree of randomness, different runs of an experiment can cause small variations in performance. To mini-mize this effect, we repeat each 5-fold cross vali-dation experiment 10 times, and report the average and standard deviation over the 10 runs.
rejec-tion rate (FRR) for the binary (scorable vs non-scorable) classification task. Our goal is to mini-mize the area under the curve (AUC), e.g., achieve low values for both FAR and FRR. Our exper-iments were performed using the Python Scikit-Learn toolbox (Scikit-Scikit-Learn, 2014).
9.2 Results
[image:8.595.319.516.63.225.2]Table 2 presents the average AUC performance of non-scorable test detection over 10 experi-ment runs, using different feature sets and ran-dom forests. ‘Base’ denotes the set of standard ASR-based and signal-based features described in Section 7. Syllable based and LM based denote the similarity features introduced in Sections 4 and 5 respectively. Finally, ‘confidence’ denotes the confidence and log-likelihood features derived from the standard and the proposed phoneme LM, as described in Section 6. According to our results, ‘base’ features are the best performing. However, it is encouraging that our proposed comparison-based syllable and LM approaches, that approach the problem from a different perspective and only use similarity features, still achieve comparable performance.
Table 2: Average and standard deviation of AUC over 10 experiment runs for the different feature sets, and combinations of feature sets.
features AUC (Avg±Std.dev) Base 0.102±0.007 Syllable based 0.122±0.011 LM based 0.123±0.008 Confidence 0.106±0.011
Feature Combination Base+Syllable 0.091±0.007
Base+LM 0.091±0.011 Base+Confidence 0.094±0.011 All 0.097±0.011 Feature Combination (select top 300 features)
Base+Syllable 0.092±0.008 Base+LM 0.088±0.012 Base+Confidence 0.097±0.010 All 0.092±0.008 Classifier Decision Combination Base+Syllable 0.087±0.008
Base+LM 0.085±0.007 Base+Confidence 0.084±0.007
All 0.081±0.006
Table 2 also presents the AUC performance af-ter concatenating the feature vectors of different feature sets, under ‘Feature Combination’. We no-tice that adding separately each of our proposed syllable based, LM based and confidence features to the base features improves performance by de-creasing AUC. This further indicates that the
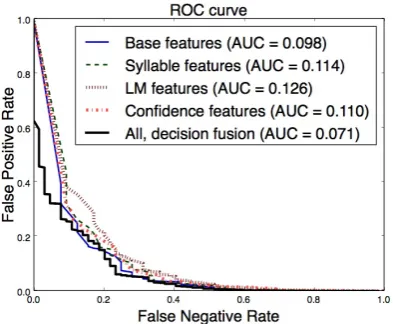
pro-Figure 5: Test set ROC curves for different feature sets, and their combination using decision fusion (averaging), for one run of the experiment.
posed features carry useful information, which is complementary to the ‘base’ feature set. Combin-ing all features together leads to a relatively small performance increase, possibly because the large number of features may cause overfitting.
We also perform feature selection by selecting the top 300 features from each feature set. Fea-tures are ranked based on their positions in the trees of the random forest: features closer to the root of a tree contribute to the decision of a larger number of input samples, thus, the expected frac-tion of the samples that each feature contributes to, can be used as an estimate of feature impor-tance. We use Scikit-Learn to compute the fea-ture importance for each feafea-ture, and rank feafea-tures based on their average importance over the 10 ex-periment runs. The results, presented in Table 2, show that feature selection helps for cases of large feature sets, i.e., when combining all features to-gether. However, for cases when fewer features are used, the performance does not change much compared to no feature selection.
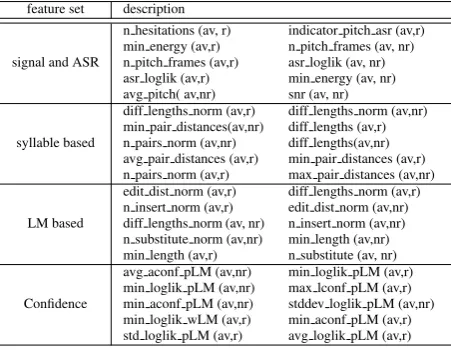
[image:8.595.102.264.457.659.2]Table 3: Top-10 ranked features from each feature set. ‘Av’ and ‘prc’ denote that the feature is an av-erage or percentage respectively, while ‘r’ and ‘nr’ denote that the feature is computed over repeat or non-repeat responses, respectively. For the confi-dence features, ‘wLM’ denotes the feature is com-puted using regular bigram word LM and ‘pLM’ denotes proposed bigram phoneme LM.
feature set description
signal and ASR
n hesitations (av, r) indicator pitch asr (av,r) min energy (av,r) n pitch frames (av, nr) n pitch frames (av,r) asr loglik (av, nr) asr loglik (av,r) min energy (av, nr) avg pitch( av,nr) snr (av, nr)
syllable based
diff lengths norm (av,r) diff lengths norm (av,nr) min pair distances(av,nr) diff lengths (av,r) n pairs norm (av,nr) diff lengths(av,nr) avg pair distances (av,r) min pair distances (av,r) n pairs norm (av,r) max pair distances (av,nr)
LM based
edit dist norm (av,r) diff lengths norm (av,r) n insert norm (av,r) edit dist norm (av,nr) diff lengths norm (av, nr) n insert norm (av,nr) n substitute norm (av,nr) min length (av,nr) min length (av,r) n substitute (av, nr)
Confidence
avg aconf pLM (av,nr) min loglik pLM (av,r) min loglik pLM (av,nr) max lconf pLM (av,r) min aconf pLM (av,nr) stddev loglik pLM (av,nr) min loglik wLM (av,r) min aconf pLM (av,r) std loglik pLM (av,r) avg loglik pLM (av,r)
achieved a decrease in AUC from 0.102 to 0.081, a 21% relative performance improvement.
Figure 5 presents the ROC curves for one run of the experiment, for the four feature sets, and their combination using averaging of the classifier decisions. Combining all feature sets leads to a lower AUC (thick black line). We notice improve-ment especially in reducing false positives, e.g., misclassifying scorable test as non-scorable.
In Table 3, we present the top 10 selected fea-tures from each feature set, based on their aver-aged feature importance. Overall, we notice that both repeat and non-repeat features are among the top ranked, indicating that both types are infor-mative. Only average features are among the top ranked, which suggests that averages carry more information than percentage features. For the syl-lable and LM features, we can see many intuitive similarity features being at the top, such as differ-ence of sequdiffer-ence lengths, edit distance and num-ber of insertions (LM based feature set), and aver-age, min and max of the distances of paired sylla-bles (syllable based feature set). For confidence, we note that many log-likelihood features are at the top (here log-likelihood statistics are computed over words of a response). Also, note that the great majority of top-ranked confidence features are computed using our proposed item indepen-dent phoneme LM, instead of the regular item
de-pendent word LM, indicating the usefulness of this approach.
10 Conclusion and future work
In this work, we have proposed new methods for detecting non-scorable tests in spoken language proficiency assessment applications. Our meth-ods compare information extracted from differ-ent sources when processing a test, and compute similarity features. Inconsistencies suggest prob-lematic ASR, which is often indicative of non-scorable tests. We extract two sets of features: syllable based, which compare syllable location information, and LM based, which compare ASR obtained using item specific and item independent LMs. Our proposed item independent LM is a bigram phoneme LM, which can handle out-of-vocabulary or non-English words, that often ap-pear in non-scorable tests. By visualizing the pro-posed similarity features, we verify that they can highlight inconsistencies that are common in non-scorable tests. We experimentally validate our methods in a large, challenging dataset of young ELLs interacting with the Pearson spoken assess-ment system. Our features carry compleassess-mentary information to existing features, and when com-bined with existing work, they achieve a 21% rel-ative performance improvement. Our final, non-scorable detection system combines the decisions of four random forest classifiers: one using base-line features, and the rest using proposed features. We are currently collecting human annotations for non-scorable tests in our dataset, which contain additional annotation of the different non-scorable subcases in these tests, e.g., noise, off-topic, non-English, unintelligible speech etc. In the future, we plan to use these annotations to further validate our methods, as well as perform detailed evalua-tion of the usefulness of our proposed feature sets for each of the non-scorable test subcases.
References
J. Bernstein and J. Cheng. 2007. Logic and valida-tion of a fully automatic spoken English test. In V. M. Holland and F. P. Fisher, editors, The Path of Speech Technologies in Computer Assisted Lan-guage Learning, pages 174–194. Routledge, New York.
J. Bernstein, A. Van Moere, and J. Cheng. 2010. Vali-dating automated speaking tests. Language Testing, 27.
L. Breiman. 2001. Random forests. Machine Learn-ing, 45.
W. Chen and J. Mostow. 2011. A tale of two tasks: De-tecting children’s off-task speech in a reading tutor. InProc. of Interspeech.
J. Cheng and J. Shen. 2010. Towards accurate recog-nition for children’s oral reading fluency. InProc. of IEEE-SLT, pages 91–96.
J. Cheng and J. Shen. 2011. Off-topic detection in automated speech assessment applications. InProc. of Interspeech.
J. Cheng, J. Bernstein, U. Pado, and M. Suzuki. 2009. Automated assessment of spoken modern standard arabic. InProc. of the Fourth Workshop on Innova-tive Use of NLP for Building Educational Applica-tions.
R. Downey, D. Rubin, J. Cheng, and J. Bernstein. 2011. Performance of automated scoring for chil-dren’s oral reading. In Proc. of the 6th Workshop on Innovative Use of NLP for Building Educational Applications.
M. Eskanazi. 2009. An overview of spoken language technology for education. Speech Communication, 51.
D. Higgins, X. Xi, K. Zechner, and D. Williamson. 2011. A three-stage approach to the automated scor-ing of spontaneous spoken responses. Computer Speech and Language, 25.
N. H. De Jong and T. Wempe. 2009. Praat script to detect syllable nuclei and measure speech rate auto-matically. Behavior research methods, 41:385–390.
NIST. 2009. The NIST SPeech Quality Assurance
(SPQA) Package. http://www.nist.gov/
speech/tools/index.htm.
G. Pearson. 2006. Ask NCELA No.1: How many school-aged English-language learners (ELLs) are
there in the U.S.? Washington, D.C:
Na-tional Clearing House for English-Language Ac-quisition and Language Instruction Educational Programs 2006, Retrieved Online February 2007
at http://www.ncela.gwu.edu/expert/
faq/01leps.htm.
Pearson. 2011. Skills and scoring in PTE
Aca-demic. http://www.pearsonpte.com/
SiteCollectionDocuments/US_Skills_
Scoring_PTEA_V3.pdf.
Scikit-Learn. 2014. The Scikit-Learn Machine
Learn-ing Python Toolbox. http://scikit-learn.
org/.
J. Tepperman, M. Black, P. Price, S. Lee, A. Kazemzadeh, M. Gerosa, M. Heritage, A. Al-wan, and S. Narayanan. 2007. A Bayesian network classifier for word-level reading assessment. In
Proc. of Interspeech.
X. Xu, M. Suzuki, and J. Cheng. 2012. An automated assessment of spoken Chinese: Technical definition of hanyu standards for content and scoring develop-ment. InProc. of the Seventh International Confer-ence & Workshops on Technology & Chinese Lan-guage Teaching.