DOI: 10.4236/wjet.2018.64047 Sep. 29, 2018 723 World Journal of Engineering and Technology
Pingzhi Gong, Bin Liu, Junting Zhang, Zheng Lv, Guohao Zhang
CNOOC China Limited, Tianjin Branch, Tianjin, China
Abstract
The classification method of relative permeability curves is rarely reported, when relative permeability curves are applied; if the multiple relative permea-bility curves are normalized directly, but not classified, the calculated result maybe cause a large error. For example, the relationship curve between oil displacement efficiency and water cut, which derived from the relative per-meability curve in LD oilfield is uncertain in the shape of low water cut stage. If being directly normalized, the result of the interpretation of the water flooded zone is very high. In this study, two problems were solved: 1) The mathematical equation of the relationship between oil displacement efficiency and water cut was deduced, and repaired the lost data of oil displacement ef-ficiency and water cut curve, which solve the problem of uncertain curve shape. After analysis, the reason why the curve is not available is that relative permeability curves are not classified and optimized; 2) Two kinds of classifi-cation and evaluation methods of relative permeability curve were put for-ward, the direct evaluation method and the analogy method; it can get the typical relative permeability curve by identifying abnormal curve.
Keywords
Relative Permeability Curve, Displacement Efficiency, Classification, Correction
1. Introduction
There are few reports on the classification of relative permeability curves, and the static parameter method represented by J function is common, but the rela-tive permeability curve is the core of static and dynamic transformation. Static parameters alone are not sufficient to describe the full meaning of the curve, such as the law of water cut rising, etc. Based on the relative permeability curve
How to cite this paper: Gong, P.Z., Liu, B., Zhang, J.T., Lv, Z. and Zhang, G.H. (2018) Classification Study on Relative Permeabil-ity Curves. World Journal of Engineering and Technology, 6, 723-737.
https://doi.org/10.4236/wjet.2018.64047
Received: August 22, 2018 Accepted: September 26, 2018 Published: September 29, 2018
Copyright © 2018 by authors and Scientific Research Publishing Inc. This work is licensed under the Creative Commons Attribution International License (CC BY 4.0).
DOI: 10.4236/wjet.2018.64047 724 World Journal of Engineering and Technology of water phase, Wang Guoxian and Wang Lijun [1][2] divided the relative per-meability curve into five categories, and analysed the geological characteristics of each curve. He Jianmin [3] summarized and analyzed the reasons of abnormal curve, but did not give recognition and repair method of abnormal curve.
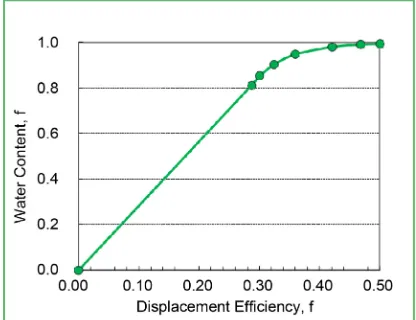
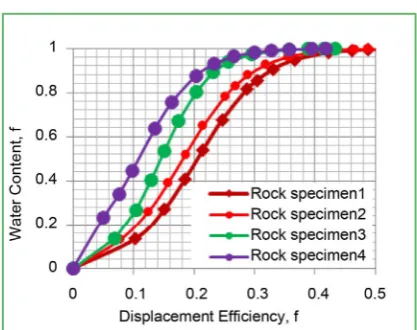
In the water flooding experiment, when the water is produced, the water con-tent is higher, so there is no experimental data in the low water cut stage (Figure 1), and there is uncertainty in the shape of the curve (Figure 1 and Figure 2). Although the missing curves can be repaired by the normalization [4][5][6][7]
of the relative permeability curves, the results of the interpretation of the water-line layer are higher and the error is larger.
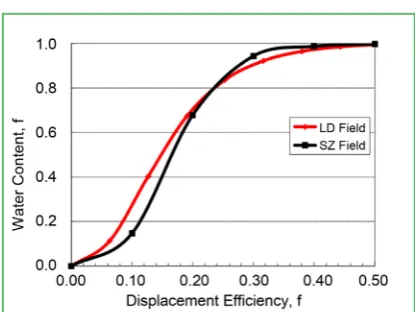
[image:2.595.268.478.340.496.2]Generally, the lower the viscosity of crude oil is, the slower the increase rate of water cut is [8][9][10] [11]. The crude oil viscosity is 13 mPa·s in LD oilfield and 50 mPa·s in SZ oilfield. However, the relationship between oil displacement efficiency and water content in the two oilfields shows the abnormal phenome-non that water cut rises faster in low water content stage in LD oilfield (Figure 3) and this phase is exactly the missing piece of experimental data. The reason is that there may be abnormal curves in many relative permeability curves, which
Figure 1. The relative permeability curve in LD oilfield.
[image:2.595.268.476.530.690.2]DOI: 10.4236/wjet.2018.64047 725 World Journal of Engineering and Technology Figure 3. Comparison of oil displacement efficiency and
water cut curve.
need to be optimized and corrected [12][13][14].
Based on the actual production of oilfields, two classification methods are proposed to optimize the relative permeability curves, and the two methods are combined; recognition gives the abnormal curve, thus obtaining the representa-tive curve of oil field, and then guides the development and production of oil fields.
2. Derivation of Mathematical Relationship between Oil
Displacement Efficiency and Water Cut
The oil-water two-phase relative permeability curve expression [15] [16] [17] [18] is:
ebSw ro
rw
K a
K = (1)
where Krois relative permeability of oil phase, Krwis relative permeability of wa-ter phase, Sw is water saturation.
According to the fractional flow equation, under the condition of ignoring the effects of capillary force, gravity and dissolved gas, the water cut can be ex-pressed as: 1 1 o w w ro w o o rw Q f K Q Q K µ µ = = + + ⋅ ⋅ (2)
where fwis water content. Qois daily oil production,the unit is m3/d. Qwis daily water production,the unit is m3/d. μ
ois oil viscosity,the unit is mPa·s. μwis wa-ter viscosity,the unit is mPa·s.
The oil displacement efficiency expression is:
1 wiwi S
S η =
− (3)
where η is oil displacement efficiency. Swi is original oil saturation.
DOI: 10.4236/wjet.2018.64047 726 World Journal of Engineering and Technology obtained by simultaneous solving the above three equations:
(1 )
1
1 e wi wi
w b S bS
f
a − η+
=
+ (4)
In the above formula, a, b and Swi are constants, let A a= , B b=
(
1−swi)
and C b s= ⋅ wi, so simplify it to:
1 1 e
w B C
f
A η+
=
+ (5)
Take the logarithm:
( )
1ln 1 ln
w
B C A
f η
− = + +
(6)
In the above formula, B and C + ln(A) are constants, let α =B ,
( )
ln
C A
β = + , so they can be simplified to:
1
ln 1
w
f αη β
− = +
(7)
The above formula is the mathematical expression of oil displacement effi-ciency and water content, and it can be seen from the expression that oil dis-placement efficiency and the logarithm of water content are linear. By fitting curve, the exact expression of the displacement efficiency and water cut can be determined, and then the curve form is completed.
3. Mathematical Relationship Verification between Oil
Displacement Efficiency and Water Cut
As the largest oilfield in Bohai sea, SZ oilfield has accumulated a lot of expe-rience in the interpretation of water-flooded layers. In order to verify the cor-rectness of the derived mathematical equation of oil displacement efficiency and water content, it is applied to SZ oil field first, and then to guide the application of the equation in LD oil field.
The relative permeability curve of SZ oilfield is shown in Figure 4. Figure 5 is a linear relationship between oil displacement efficiency and water content cor-responding to relative permeability curve.
According to Figure 5 linear fitting relation, the mathematical relation be-tween oil displacement efficiency and water content is obtained.:
1
ln 1 19.353 3.353
w
f η
− = − +
(8)
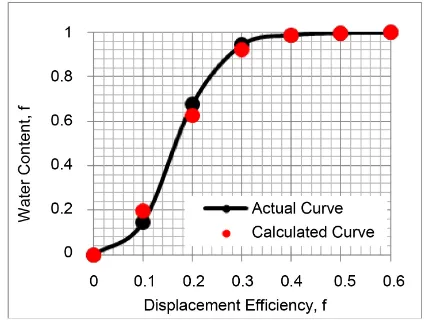
The relation curve between oil displacement efficiency and water content can be calculated by using the above formula, and its calculated value and actual value are compared as shown in Figure 6. It can be seen from the figure that the fitting effect is very good.
DOI: 10.4236/wjet.2018.64047 727 World Journal of Engineering and Technology Figure 4. Oil displacement efficiency and water cut curve
[image:5.595.267.479.272.432.2]in SZ oilfield.
Figure 5. Fitting of linear relationship between oil dis-placement efficiency and water cut.
Figure 6. Fitting result of oil displacement efficiency and water cut curve.
[image:5.595.266.478.476.636.2]DOI: 10.4236/wjet.2018.64047 728 World Journal of Engineering and Technology Figure 7. Oil Displacement efficiency and water cut
curve in SZ oilfield.
Figure 8. Linear relation fitting.
1
ln 1 18.668 2.987
w
f η
− = − +
The curve of the orange curve in Figure 9 is a repaired curve. It is shown that the curve is different from the actual curve at low water cut stage, and further correction is needed.
4. Mathematical Relationship Correction between Oil
Displacement Efficiency and Water Cut
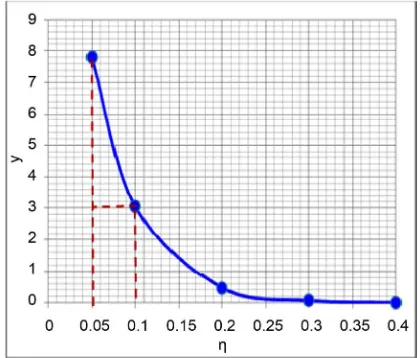
The exponent part of Formula (5) is:
eb C
y= η+ (10) The above formula is drawn as Figure 10. After analysis, the reason why the error in the low water cut stage is greater is that the smaller the oil displacement efficiency, the faster the index (Y value in Figure 10) rises, so the error is bigger. The cause of the error is found, and then the curve can be corrected.
[image:6.595.266.479.273.431.2]DOI: 10.4236/wjet.2018.64047 729 World Journal of Engineering and Technology Figure 9. Repaired curves.
Figure 10. Calculation error analysis.
Figure 11. Linear relation fitting.
[image:7.595.266.478.469.646.2]DOI: 10.4236/wjet.2018.64047 730 World Journal of Engineering and Technology Figure 12. Schematic diagram of error analysis.
Figure 13. Comparison before and after curve correction.
and the maximum error is only about 5%, which can be used for the interpreta-tion of the water flooded layer. The correctness of the mathematical equainterpreta-tion of oil displacement efficiency and water content is proved.
There are 4 relative permeability curves in LD oilfield. After correction, as shown in Figure 14, the water content range is 20% to 48%, when the displace-ment efficiency is 88%. The data span is large. Therefore, if the relative permea-bility curve is normalized directly for use, the accuracy of the results of interpre-tation is difficult to ensure, there will be a large error. The curve must be cor-rected.
Therefore, the reason for the high interpretation result of the water flooded layer is that the relative permeability curve has not been classified and opti-mized, and the water content has increased faster than the heavy oil field.
5. Classification Evaluation Method of the Relative
Permeability Curve
5.1. Conventional Classification Method
[image:8.595.268.477.282.431.2]DOI: 10.4236/wjet.2018.64047 731 World Journal of Engineering and Technology Figure 14. The oil displacement efficiency and water cut
curve.
parameter method represented by J function [19] [20], which is classified ac-cording to the value of K Φ. The classification results of LD oilfield are as follows.
Comparing the classification data (Table 1) with the oil displacement effi-ciency and water cut curve (Figure 14), we can see that there is no regularity between the data and the curve shape. This is because the conventional classifi-cation method is only based on the geological static parameters, and the relative permeability curve contains both geological and dynamic parameters. It is the central link of static and dynamic transformation. Therefore, only static para-meters are used to classify the curve, it is not enough to describe all the informa-tion represented by the relative permeability curve, and there are certain defects.
5.2. Direct Evaluation Method
Take the logarithm of both sides of Formula (1):
ln ro ln
w rw
K bs a
K
= +
(11)
The above formula can be transformed into:
ln
ebsw a ro
rw K K
+
= (12)
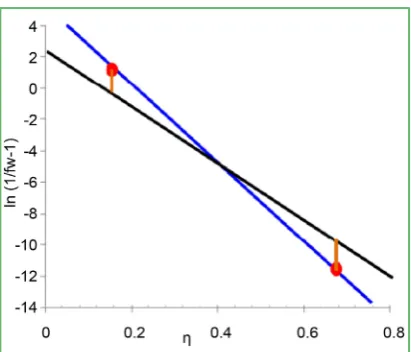
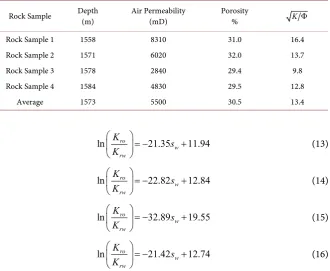
The slope and intercept of the Formula (11), and the exponential part of the Formula (12) are related to the shape of the oil-water relative permeability curve, so the slope, intercept and index can quantitatively characterize the morphology of the curve, and they can be used as a basis for the classification of relative per-meability curves. It can be seen from mathematical expressions that the ratio of oil-water relative permeability has a linear relationship with water saturation (Formula 11). According to relative permeability curve data, draw a straight line diagram as follows:
DOI: 10.4236/wjet.2018.64047 732 World Journal of Engineering and Technology Table 1. Classification data of relative permeability curves in LD oilfield.
Rock Sample Depth (m) Air Permeability (mD) Porosity % KΦ
Rock Sample 1 1558 8310 31.0 16.4
Rock Sample 2 1571 6020 32.0 13.7
Rock Sample 3 1578 2840 29.4 9.8
Rock Sample 4 1584 4830 29.5 12.8
Average 1573 5500 30.5 13.4
ln ro 21.35 11.94
w rw K s K = − +
(13)
ln ro 22.82 12.84
w rw K s K = − +
(14)
ln ro 32.89 19.55
w rw K s K = − +
(15)
ln ro 21.42 12.74
w rw K s K = − +
(16)
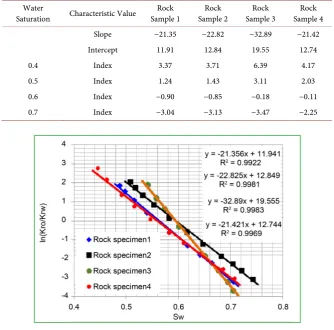
The slope, intercept and index statistics of each line are as follows.
It can be seen from Table 2 that the slope and intercept of the rock sample 3 are greater than the values of the other three samples. The slope values of the other three rock samples are about 22, and the intercept value is about 12. In
Figure 15, the straight line of the rock sample 3 intersects the straight lines of the remaining three rock samples. By comparing the index values corresponding to different water saturations, the values of rock samples 1 and 2 are always close, so rock samples 1 and 2 can be divided into one class.
5.3. Analogy Method
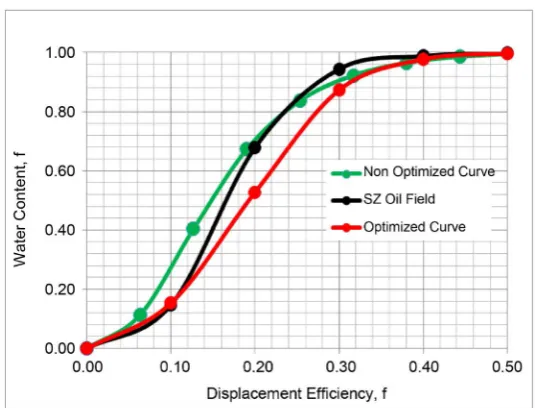
By analogy with the curve of oil field with slightly larger viscosity, the curve can be classified qualitatively according to the rising law of water content. The com-parison of each oil displacement efficiency and water cut curve of LD oilfield is shown in Figure 16. The black curve in Figure 16 is for the SZ field, the viscosi-ty of the crude oil is 50 mPa·s, and the viscosiviscosi-ty of the LD field is 13 mPa·s. Compared with the curve of the SZ oilfield, it can be found that the rock samples 1 and 2 can be divided into one class, and the rock samples 3 and 4 are divided into one class.
DOI: 10.4236/wjet.2018.64047 733 World Journal of Engineering and Technology Figure 15. Fitting of linear relation of relative permeability curve.
Figure 16. The oil displacement efficiency and water cut curve.
[image:11.595.238.510.445.646.2]DOI: 10.4236/wjet.2018.64047 734 World Journal of Engineering and Technology Figure 17. Comparison of curves before and after optimization.
water flooded layer. With the development of oil field into the middle and late period, it is more and more difficult to comprehensive adjustment. This requires more and more fine research by reservoir engineers. By studying the classifica-tion of relative permeability curve, the accuracy of applicaclassifica-tion of the curve can be guaranteed.
6. Application
6.1. Historical Fitting of Numerical Simulation
The relative permeability curves before and after optimization were put into the CMG numerical simulation software to calculate the water cut of a well. The comparison results are shown in Figure 18. It can be seen that the fitting effect of the optimized relative permeability curve is better than that before optimiza-tion, thus reducing the workload of numerical simulation parameters adjust-ment. In addition, it was applied to the interpretation of water flooded zones in oilfield adjustment wells, which guided the optimization of perforation project and achieved good development results.
6.2. Law of Water Cut Rising
Using the fractional flow Formula (17), combined with the water injection de-velopment process, the average water saturation of oil layer can be expressed by the Formula (18). According to the two standardization results of LD oilfield, the theoretical curve of water content and water cut rising rate can be calculated by using Formula (17) and Formula (19), the comparison with the actual pro-duction data is shown in Figure 19.
1 1
w
w ro
o rw
f K
K
µ µ
⋅ ⋅ =
DOI: 10.4236/wjet.2018.64047 735 World Journal of Engineering and Technology Figure 18. Comparison of numerical simulation results.
Figure 19. Relationship curve between water cut rise rate and water content.
(
1)
P
w N wi wi
S S S
N
= − + (18)
where NPis cumulative oil production,the unit is m3. N is petroleum geological reserves,the unit is m3.
2 1
2 1
1 1
w w wi
w
f f wi or
f f S
f
R R S S
− −
′ = ⋅
− − − (19)
where fw′ is Water content derivative, Rf is recovery percent, Soris residual oil saturation.
As can be seen from Figure 19, theoretical curve of water content and water cut rising rate obtained from the optimized relative permeability curve is in good agreement with the actual situation of the oil field. It shows that this method is more in line with the actual oil-water migration law of reservoir.
7. Conclusions
[image:13.595.247.502.283.446.2]DOI: 10.4236/wjet.2018.64047 736 World Journal of Engineering and Technology been deduced by combining the equation of the fractional flow equation, oil dis-placement efficiency and relative permeability curve. The correctness of the equ-ation is verified by the data of relative permeability curve in SZ oilfield.
2) Two methods of classification and evaluation of relative permeability curves are proposed: direct evaluation and analogy method. The direct evalua-tion method can classify the curve quantitatively according to the characteristic value, and the analogy method can classify the curves qualitatively according to the law of the effect of viscosity on water cut rise. In the practical application process, it is necessary to combine the two methods to identify the abnormal curve, so as to obtain the representative relative permeability curve of the oil-field. The classification and optimization can ensure the accuracy of the applica-tion of the relative permeability curve, especially for the interpretaapplica-tion of the water flooded layer.
3) The classification method of relative permeability curve was applied to LD oilfield, and a representative relative permeability curve was obtained. By using the direct evaluation method, the multiple relative permeability curves were di-vided into two categories, and then the curve which is more in line with the law of water rising was chosen by analogy. It is proved by practical application that the optimized relative permeability curve is more in line with the actual oil field and more representative.
Conflicts of Interest
The authors declare no conflicts of interest regarding the publication of this pa-per.
References
[1] Wang, G.X. (2004) On Relative Permeability Curves and Production Characteristics of Reservoirs. XINJIANG Petroleum Geology, 25, 301-304.
[2] Wang, L.J. (2012) Analysis of Oil-Water Relative Permeability Curve’s Characteris-tics. Science Technology and Engineering, 12, 2160-2162.
[3] He, J.M. (2009) Discussion on the Factors Affecting the Abnormal Permeability Curve of Oil and Water. Petroleum Geology and Recovery Efficiency, 16, 74-80. [4] Chen, Y.Q. (1990) Standardization on the Curves of Permeability and Capillary
Pressure. Petroleum Geology and Experiment, 12, 64-70.
[5] Miao, F., Liu, X., Zhang, H., Geng, N., Qiu, T., et al. (2013) Evaluation on Standar-dized Methods of Original Relative Permeability Curves. Fault-Block Oil & Gas Field, 20, 759-762.
[6] Chen, Y.Q. (1990) A Standardized Method for the Average Relative Permeability Curve. Standards and Measurements in Petroleum Industry, 3, 6-9.
[7] Miao, F.F., Liu, X.H. and Zhang, H.Y. (2013) Evaluation on Standardized Methods of Original Relative permeability Curves. Fault-Block Oil & Gas Field, 20, 759-762. [8] Wang, S.L., Ai fen, L.I., Peng, R.G., et al. (2017) Effect of Oil Water Viscosity Ratio
DOI: 10.4236/wjet.2018.64047 737 World Journal of Engineering and Technology
[13] Zhang, J.C. and Song, K.P. (2007) Eigen Curve of Relative Permeability and Its Ap-plication. Acta Petrolei Sinica, 28, 104-107.
[14] Yang, X.P. (1998) A Method to Calculate the Relative Permeability Accurately. Pe-troleum Exploration and Development, 25, 63-66.
[15] Schneider, F.N. (1987) Three Procedures Enhance Relative Permeability Data. OGJ, 85, 45-51.
[16] Honarpour, M., Keodaritz, L. and Harvey, A.H. (1989) Relative Permeability of Pe-troleum Reservoir. PePe-troleum Industry Press, Beijing.
[17] Pittman, E.D. (1996) Relationship of Porosity and Permeability to Various Parame-ters Derived from Mercury Injection-Capillary Pressure Curves for Sandstone. AAPG, 76, 191-198.
[18] Zhang, J. (2013) Water Flooding Oilfield Production Prediction Model. Petroleum Industry Press, Beijing.
[19] Leverett, M.C. (1941) Capillary Behavior in Porous Solids. Transactions of the AIME, 142, 151-169.